Nontargeted, Discovery-Based Profiling of the Yeast Metabolome Using QTOF LC–MS and LC–MS-MS
Special Issues
A discovery-based, untargeted metabolomics analysis of hundreds of yeast metabolites under robust, controlled extraction conditions followed by identification is described.
This article describes a nontargeted, discovery-based approach for analyzing the yeast metabolome in response to calcium and immunosuppressant drug treatment, using multiple liquid chromatography (LC) conditions and quadrupole time-of-flight mass spectrometry (QTOF-MS) analysis. Yeast cultures were exposed to calcium only or calcium and one of two immunosuppressant drugs with the goal of perturbing the calcineurin- and any other calcium- or immunosuppressant-responsive pathways. Compounds were extracted from the raw data using an unbiased extraction algorithm. These results were subsequently analyzed using multidimensional statistical analysis and data visualization software and reduced to a list of compounds that were differentially expressed according to culture condition. Accurate-mass–based identifications were done using an endogenous metabolite database. MS-MS spectra were acquired for a subset of compounds, allowing for matching at multiple fragmentation energies against an endogenous metabolite library to provide higher confidence identifications.
Baker's yeast, Saccharomyces cerevisiae, is used extensively as a model organism for all eukaryotic cells, facilitating research into the biochemistry and biological pathways of more complex organisms. It is especially attractive because it can grow for extended periods under highly controlled conditions (1). Moreover, its genome has been fully sequenced (2–4). Metabolomics entails the study of an organism's complete set of small molecule metabolites, which includes a wide variety of compounds. An understanding of the yeast metabolome can shed light on the metabolic pathways of higher organisms and their response to drugs and environmental changes. Methods are needed to provide as much coverage as possible of the yeast metabolome.
This article describes a discovery-based, untargeted metabolomics analysis of hundreds of yeast metabolites under robust, controlled extraction conditions followed by identification, which is a prerequisite for studying biological pathways, especially when comparing response to environmental stress (5,6).
A metabolite extraction protocol was optimized to maximize metabolome coverage. The liquid chromatography quadrupole time-of-flight (LC–QTOF) system was run in multiple chromatographic and detection modes to separate and detect large numbers of metabolites. Data analysis was performed using MassHunter Qualitative Analysis (Agilent Technologies) and Mass Profiler Professional (MPP) software, as well as the Personal Compound Database and Library (PCDL) containing content derived from the Agilent METLIN database. Yeast cultures were exposed to calcium only or calcium and one of two immunosuppressant drugs (cyclosporin A and FK 506), with the goal of perturbing the calcineurin- and any other calcium- or immunosuppressant-responsive pathways (7,8). Initial liquid chromatography–mass spectrometry (LC–MS) accurate mass matches to METLIN content resulted in many compounds with differential abundances. Subsequent confirmation by rerunning samples on the LC–QTOF system for LC–MS-MS analysis provided the highest-confidence identifications.
Experimental
Instrumentation
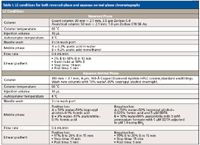
This study was performed using a 1200 SL Series LC system (Agilent Technologies) with a binary pump and degasser, a well-plate autosampler with thermostat, and a thermostated column compartment. Both reversed-phase and aqueous normal-phase chromatography were performed to maximize coverage of the yeast metabolome. The LC method parameters are listed in Table I.

Table I: LC conditions for both reversed-phase and aqueous normal-phase chromatography
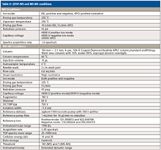
The LC system was coupled to an Agilent 6530 Accurate-Mass Q-TOF mass spectrometer with an atmospheric-pressure chemical ionization (APCI) source operated in positive ion mode, as well as an electrospray ionization (ESI) source operated in positive and negative ion modes. Dynamic mass axis calibration was achieved by continuous infusion of a reference mass solution using an isocratic pump. The MS and MS-MS method parameters are given in Table II.

Table II: QTOF-MS and MS-MS conditions
Sample preparation
S.cerevisiae strain BJ5459 was cultured in parallel and at an OD600 of 0.8 exposed to vehicle control (4 mL of 90:10 ethanol–Tween 20) for wild type-WT and calcium control-CA, or 4 µg/mL FK506 (FK), or 4 µg/mL cyclosporinA (CY), suspended in 90:10 ethanol–Tween 20. After 1 h, an equal fraction of media containing CaCl2 was added to FK and CY cultures as well as to the calcium-only exposed culture (CA), to a final concentration of 100 mM. After 15 min of exposure to either vehicle control or calcium, cultures were centrifuged and washed with phosphate-buffered saline (PBS) to remove any residual media. Quenching was done with 1 mL of methanol added to the final pellet at -40 °C. After quenching, the final sample was lyophilized.
Wet milling was performed with 5 mg of dry sample in 2-mL Eppendorf tubes in 1.1 mL of an extraction solvent of 5:3:3 chloroform–methanol–water. A Retsch MM301 ball mixer mill was used with a single 5-mm ball bearing as a tube insert to facilitate mechanical rupture of the yeast. External standards were added before milling. Nine samples for each culture condition were processed for 3 × 1 min cycles at 30 Hz. The milling process resulted in polar and nonpolar phases. The polar-phase supernatants were filtered first through 0.2-µm and then 10 kDa ultrafiltration membranes to ensure removal of any residual protein or cellular debris.
Data Analysis
Compounds were extracted from the raw data files using an unbiased, molecular feature extraction (MFE) algorithm in Agilent MassHunter Qualitative Analysis B.04.00 software. The processed data files were subsequently analyzed using MPP multidimensional statistical analysis and data visualization software. Provisional compound identification was performed by matching accurate mass results to content from the Agilent METLIN PCDL. Orthogonal retention time matching was used to increase the specificity of the database match by requiring a match to the retention time information contained in the PCDL. In addition, MS-MS spectra, acquired for ions present in samples that were previously identified by database matching, were queried against a library of LC–MS-MS spectra acquired from more than 2200 individual standards.
Results and Discussion
Feature Extraction
The MFE algorithm in MassHunter finds all ions that are related, including isotopes and any adducts, such as Na+ or K+ and dimers and sums all ion signals into one value (feature), in a fully automated mode. Table III shows the results for the four culture types: wild type (WT), calcium-exposed (CA), FK 506-treated (FK), and cyclosporin A–treated (CY). Each culture was analyzed using both reversed phase and aqueous normal-phase chromatography, with QTOF-MS analysis done using an ESI source operated in positive and negative modes, as well as an APCI source operated in positive ion mode. For the most part, the results for all four culture types were similar, with aqueous normal-phase ESI+ generating the most features. By incorporating two chromatographic separation techniques, two MS sources (ESI and APCI), as well as both positive and negative ionization modes, broader detection coverage of the yeast metabolome was possible.

Table III: MFE results by treatment and analysis type
Data Analysis in Mass Profiler Professional
Data filtering for the biological replicates resulted in a condensed list of compounds of interest, which was then assessed for statistical significance to determine differential abundance of metabolites according to the culture conditions. Chemical entities (features) that were present in at least six of the nine data files, and in at least one of the four culture conditions were retained (column 1, Table IV). The filtered list of compounds was then queried against the Agilent METLIN content of >25,000 compounds in PCDL (column 2). The filtered features were then evaluated for statistical significance between culture conditions at a cutoff of p <0.05 (column 3). Features that passed this cutoff were again queried in terms of accurate mass against the METLIN PCDL (column 4).

Table IV: MPP results by analysis type
Principal Component Analysis
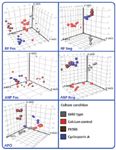
Principal component analysis (PCA) resulted in spatial separation for all four of the culture treatments (Figure 1). Analysis of the differential abundances for several compounds revealed the effect of the various treatments on several metabolic pathways. One example was the metabolites 5’-methylthioadenosine and S-adenosylhomocysteine which are both substrates of the enzyme 5’-methylthioadenosine nucleosidase (EC 3.2.2.9) in the cysteine and methionine metabolism pathway. The abundances of these two metabolites increased in the calcium treated data set (CA), indicating possible inhibition of 5’-methylthioadenosine nucleosidase in a calcium dependent manner (Figure 2). This was previously reported in an orthologous pathway in Arabidopsis thaliana (9). Good reproducibility for the biological replicates was reflected by the low relative standard deviations (RSDs).

Figure 1: Principal component analysis (PCA) plots generated using MPP for each analysis type. Spatial separation for each culture condition (n = 9) was observed, indicating the unique effect of each culture treatment.
MS-MS Spectral Matching
MS-MS spectral matching can provide the most confidence in discovery-based MS identification, and spectral matching in PCDL provides a level of confidence that cannot be obtained using other publicly available libraries. The addition of MS-MS library searching capability against 2200 standards with MS-MS spectra in PCDL provided a chromatography-independent means for compound identification.

Figure 2: Differential abundances calculated in MPP at p

New Method Explored for the Detection of CECs in Crops Irrigated with Contaminated Water
April 30th 2025This new study presents a validated QuEChERS–LC-MS/MS method for detecting eight persistent, mobile, and toxic substances in escarole, tomatoes, and tomato leaves irrigated with contaminated water.
Accelerating Monoclonal Antibody Quality Control: The Role of LC–MS in Upstream Bioprocessing
This study highlights the promising potential of LC–MS as a powerful tool for mAb quality control within the context of upstream processing.
University of Tasmania Researchers Explore Haloacetic Acid Determiniation in Water with capLC–MS
April 29th 2025Haloacetic acid detection has become important when analyzing drinking and swimming pool water. University of Tasmania researchers have begun applying capillary liquid chromatography as a means of detecting these substances.

.png&w=3840&q=75)

.png&w=3840&q=75)


.png&w=3840&q=75)


.png&w=3840&q=75)


