A Novel Approach to Measure Crop Plant Protein Expression
Special Issues
Crop development to improve yield or disease resistance has been explored for centuries and the technologies to measure these improvements have subsequently become complex.
A Novel Approach to Measure Crop Plant Protein Expression
Crop development to improve yield or disease resistance has been explored forcenturies and the technologies to measure these improvements have subsequently becomecomplex. The use of transgenes in crop plants is a more technically advanced approach thantraditional breeding and the success of this approach is best assessed using moderntechniques that accurately quantify the desired traits. Here, we applied targeted liquidchromatography–mass spectrometry (LC–MS) using synthetic stableisotope–labeled peptides to identify and quantify the relative levels of transgenic tonative protein. The methodology was developed using rice plants in which mRNA expression andphenotypic effect of the transgene had been validated. Relative quantification of transgenicbarley alanine aminotransferase (AlaAT) used targeted LC–MS of tryptic proteinfragments. We chose the LC–MS method as a superior technique to directly measureprotein levels because other methods such as western blot analysis and RNA were unable todistinguish the minor amino acid differences between the transgenic and native proteins.Establishment of this methodology is a first step toward using LC–MS as a predictivetool to quantify the value of genetically engineered plants before the high investment of afull field trial.
The improvement of crop plants for yield, insect resistance,and abiotic stress tolerance is a continuous process in agriculture.In addition to traditional breeding, genetic engineeringoffers an approach to introduce changes with a targetedadjustment in a plant’s ability to grow. While the ultimate goal incrop improvement is often focused on increasing yield, the tools tomeasure the biological changes in the plant vary. Selecting the righttool to quantify the improvement hinges on many factors but allother things being equal, the most important consideration is thebalance of time and cost.
Here we describe the use of liquid chromatography–mass spectrometry(LC–MS) to quantify the expression levels of a transgenicprotein, barley alanine aminotransferase (AlaAT) across multiplerice lines. LC–MS is an increasingly popular tool in proteomicanalyses because it bypasses the difficulties and time often neededfor generating antibodies to detect specific proteins (1–5). LC–MSwould be particularly useful when specific antibodies are not available,as is the case for barley AlaAT. The AlaAT protein superfamilyis highly conserved, and currently available antibodies detect boththe native and transgenic protein, thus confounding our ability toquantify the presence of the specific transgene. Therefore, LC–MStechnology was selected based on its ability to accurately differentiatetransgenic from native proteins.
We detected and quantified transgenic proteotypic peptidesusing stable isotope–labeled peptides as internal standards andspiked them into rice leaf samples to accurately quantify the endogenouslevels of transgenic protein. This workflow is similar to othertargeted proteomic workflows for the identification of biomarkersand low-level endogenous proteins in complex matrices (6,7).
Our goal was to measure the amount of transgenic barley AlaATprotein against the amount of native AlaAT across multiple ricelines. If the technique proves to be a robust and accurate meansto measure protein levels, in the future we could apply LC–MS toevaluate the potential performance of a rice line before the investmentin space, time, and resources for a field trial. By correlatingyield improvements to transgenic protein levels in the greenhouseor growth chamber, we could significantly reduce the number oftransformation lines that require field testing. The first step in thisprocess is to establish the methodology with plant lines that havebeen evaluated in the field and determine whether LC–MS is a suitabletool for measuring protein levels. The work we describe hereestablished the necessary resources to differentiate transgenic fromnative protein using LC–MS as a primary tool.
Experimental Methods
Tissue Collection
Flag leaves were collected at the booting stage from field-grownrice plants in which mRNA expression level and phenotypic effectof the transgene had been validated. The plant leaves wereimmediately frozen in liquid nitrogen and stored until manually ground to homogenizationusing a chilled mortar and pestle.

Table I: Targeted peptides of barley alanine aminotransferase.
Total Protein
Quantification and Normalization
Protein samples were prepared using theNucleoSpin RNA/Protein kit and quantifiedusing the Protein QuantificationAssay (both from Macherey-Nagel) accordingto manufacturer instruction. Allprotein samples were analyzed by 4–12%Bis-Tris sodium dodecyl sulfate–polyacrylamidegel electrophoresis (SDS-PAGE) inMES buffer (Invitrogen).
Protein Gel Electrophoresis
A 5-μL volume of Kaleidoscope Prestained Standard (Bio-Rad) and 70 μg of each total protein sample were loaded onto a NuPAGENovex 4–12% Bis-Tris Gel 1.5 mm, 10-well precast polyacrylamide gel (Invitrogen). The protein bands were visualized using the Colloidal Blue Staining Kit(Invitrogen).
Excision of Barley AlaAT Protein Bands
The gel was cut into approximately 1-mmpieces for each sample between the BSAband (<78 kDa) and the carbonic anhydraseband (>45.7 kDa), a section thatcontains the target barley AlaAT protein.Blank lanes were used as controls. Gelpieces were stored separately at -20 °C in1.5-mL siliconized Eppendorf tubes.
Peptides and Digest
The bands corresponding to AlaAT wereexcised, destained, reduced with tris(2-carboxyethyl)phosphine (TCEP), andalkylated with iodoacetamide before digestionusing an in-gel tryptic digestionkit (Thermo Fisher Scientific). Quantificationof AlaAT in transgenic rice usedtargeted LC–MS of four peptides. We previouslydiscovered which peptides couldbe readily detected in the transgenic ricelines. Peptides were selected based on resultsfrom transgenic rice samples and aredescribed in Table I. Liquid chromatography–multiple reaction monitoring-massspectrometry (LC–MRM-MS) was usedto determine which of the specific proteotypicpeptides generated clear MRMsignals in the endogenous matrix of backgroundpeptides. The peptides were alsoselected based on unique sequence identityfor barley over the rice native AlaAT.Four synthetic heavy peptides (Table I,Thermo Fisher Scientific) were mixedwith sequencing-grade porcine trypsin(Promega) just before its addition toexcised gel pieces. Protein was digestedusing a protein-to-enzyme ratio of approximately50:1 and incubated at 37 °Cfor 16 h. The amount of each stable isotope(13C/15N)–labeled peptide added toeach gel sample was 1500 fmol. For eachanalysis, one-half of the recovered trypticdigest was analyzed.
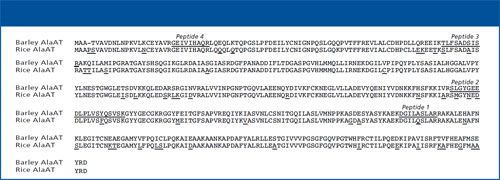
Figure 1: Protein sequence alignment of the barley and rice AlaATs.
Chromatography and Mass Spectrometry
Chromatography of peptides used a ParadigmMDLC MS4 LC pump and a 150mm × 0.2 mm, 3-μm dp, 200-Å C18AQcolumn (Michrom Bioresources). Peptideswere eluted using a 2-μL/min flow rate anda gradient of acetonitrile (solvent B) in 0.1%formic acid (solvent A) as follows: 5–40% Bover 50 min, 40–80% B over 1 min, hold at80% B for 1 min, 80–5% B over 1 min, andhold at 5% B for 14 min.
An LCQ Deca XP-plus ion-trap massspectrometer (Thermo Scientific) equippedwith a Michrom Advance Spray Sourcewas used for MS-MS analysis in positiveionelectrospray mode. The source sprayvoltage was 1200 kV and the capillarytemperature was 200 °C. The MS-MS filters,instrument conditions, and voltageswere optimized for each targeted peptideby direct infusion and LC–MS analyses ofthe heavy synthetic peptides. LC–MS datawere integrated and processed using Xcalibursoftware (Thermo Scientific).
Results
For the first iteration of barley AlaAT detection,we needed to establish a cost-effectiveprotein separation technique that couldlater be applied to multiple plant lines in amoderate high-throughput manner. Proteinsfrom all samples were extracted andpurified by SDS-PAGE. While there areother ways to separate proteins in a crudeextract, separation by SDS-PAGE allowsfor a rapid, relatively inexpensive way toprocess a high number of samples. The expressionof transgenic barley AlaAT was expectedto be low, therefore, minimizing theinfluence of other, more highly abundantproteins through SDS-PAGE provided apotentially reproducible approach for multipleplant lines and species. The proteinbands were digested, in gel, with trypsin inthe presence of synthetic heavy peptides tominimize the variables that could interferewith relative quantification.
The next step was to select AlaAT peptidesthat could differentiate between nativerice and transgenic barley protein. Wechose four peptides that were frequentlydetected in LC–MS analysis for AlaATand used stable isotope–labeled peptidesto identify and measure the levelsof transgenic protein in rice. Peptides 1-3are specific to barley AlaAT and peptide 4is present in both barley and rice AlaATsbased on their known protein sequences(Figure 1). These synthetic peptides wereused for quantification of barley AlaATin the transformed rice lines using theisotopic dilution technique (8) and fullscanMS-MS detection at the expectedretention times to maximize sensitivity.The MS-MS filters, instrument conditions,and voltages were optimized foreach targeted peptide by direct infusionand LC–MS-MS analysis of the individualheavy synthetic peptides (Table II).
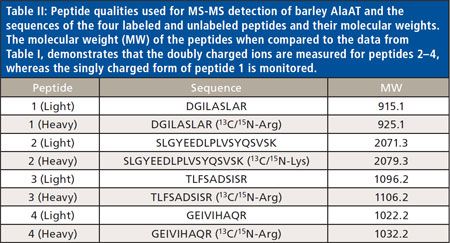
Table II: Peptide qualities used for MS-MS detection of barley AlaAT and thesequences of the four labeled and unlabeled peptides and their molecular weights.
Next, we evaluated the ability of LC–MSto detect and relatively quantify the levels ofbarley AlaAT protein in six transgenic ricelines using the selected synthetic peptidesspecific to barley AlaAT. Two rice cultivars,Nipponbare and Taipei, were used to examinethe potential differences in response tonitrogen stress. Four transgenic lines, twofrom the Nipponbare cultivar (NAAT1 andNAAT2) and two from the Taipei cultivar(TAAT3 and TAAT4) were compared totheir parental wild-type (Nipponbare andTaipei) varieties grown at the same timeto ensure any variation detected was becauseof natural differences among differenttransformation events. Each transgeniccultivar contained a single copy of AlaATisolated from barley (Hordeum vulgare) aspreviously described (9). Though mRNAexpression level and phenotypic effect of thetransgene had been validated in the plants,the protein level of barley AlaAT in each ofthese lines is unknown.
A representative LC–MS chromatogramand spectra of all the peptides in thetransgenic NAAT2 rice sample is shownin Figure 3a. The base peaks correspondingto each of the heavy and light barleyAlaAT peptides have been selected. Figure3b shows the same three peptides inthe transgenic rice sample TAAT3. Eachof the peptides is eluted separately and isdistinguishable from other potentiallyinterfering peptide ions as indicated by the retention times. We determined thattargeting the scan methods to the specificions from each peptide greatly increasedthe sensitivity over the use of data-dependentMS-MS analysis and provided alimit of detection of approximately 5 fmolper gel-purified sample. This is equivalentto about 4 ppm, based on total proteinlevels in the extract before SDS-PAGEpurification.
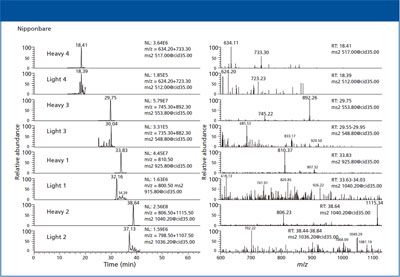
Figure 2: Chromatograms and spectra of all four heavy peptides and one light peptide in theNipponbare wild-type rice sample.
The results for all six rice lines are summarizedin Table III. The values representthe femtomolar amount of each peptidemeasured in all samples. The area undereach peak of the relevant peptide was measuredand calculated as a ratio of heavyto light. Based on the results of the ratio,the total amount (in femtomoles) of eachpeptide was reported. To calculate the approximateamounts of barley AlaAT proteinin the samples, the values for peptides1–3 were averaged and are reported as afunction of the total protein loaded on thegel. While the values for peptide 4 are presented,they were not used to calculate theamount of barley AlaAT in the transgenicrice samples.

Table III: Presence of AlaAT protein in transgenic and wild-type rice leaf samples. The results for all six rice lines are summarizedin Table III. The values representthe femtomolar amount of each peptidemeasured in all samples. The area undereach peak of the relevant peptide was measuredand calculated as a ratio of heavyto light. Based on the results of the ratio,the total amount (in femtomoles) of eachpeptide was reported. To calculate the approximateamounts of barley AlaAT proteinin the samples, the values for peptides1–3 were averaged and are reported as afunction of the total protein loaded on thegel. While the values for peptide 4 are presented,they were not used to calculate theamount of barley AlaAT in the transgenicrice samples.
The measured amounts for each of thepeptides in all of the samples were affectedrelatively similarly. That is, if a low amountof peptide 3 was found in NAAT1, it wasalso found to be within a similarly lowrange in NAAT2, TAAT3, and TAAT4.Therefore, it appears that the peptides wereaffected equally in each sample. The onlyexception was peptide 4, which was expectedbecause this peptide detects both endogenousAlaAT and barley AlaAT. Thereare currently no publicly available data thatmeasure native AlaAT in rice flag leaves.
The data indicate that barley AlaAT proteinlevels are relatively equal across theseselected transgenic lines: NAAT1 andNAAT2 were calculated to contain 134 and160 fmol of barley AlaAT per gram of plantleaf tissue, respectively. The low amounts ofpeptides 1–3 in NAAT1 clearly contributedto a reduced calculated protein value andthe lowest overall. Interestingly, the peptide4 value in NAAT1 was measured nearlyas high as the Taipei wild-type sample.The Taipei transgenic lines TAAT3 andTAAT4 contained 170 and 204 fmol of barleyAlaAT protein per gram of leaf tissue,respectively. Overall, the Taipei transgeniclines contained slightly more protein thanthe Nipponbare transgenic lines; howeverthe difference is not significant. The slightdifference could be because of the timingof the harvest. Although all the plants wereharvested during the booting phase, Taipeitakes slightly longer to mature and thereforethe developmental stages could have beenslightly different. The values for each peptidein all samples agreed with the averagecalculated protein levels of barley AlaAT.For example, if peptide 1 was higher inTAAT3 than NAAT1 that was also truefor peptides 2 and 3. The values of peptide4 varied the most among all the peptides,ranging from 120 to 602 fmol; however, recallthat this peptide is shared between riceand barley and therefore its levels are likelyskewed because of interference from the nativelevels of AlaAT, which could also varyamong the lines and rice varieties.
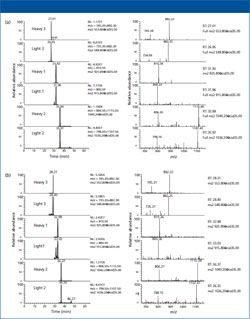
Figure 3: Representative chromatograms and spectra of the three unique barley AlaAT heavypeptides in the transgenic (a) Nipponbare (NAAT2) and (b) Taipei (TAAT3) rice samples.
Discussion
Here we provide evidence that LC–MS isuseful for the quantification of a transgenicprotein that has high identity (89%) with itsnative homolog. The sequences are merelypunctuated by single amino acid differencesthat we believe are best observedusing LC–MS. Our previous attempts toquantify AlaAT included several iterationsof antibody generation and assay optimizationthat only resulted in a simple scaleof transgene protein levels that was notquantitative because of interference fromendogenous AlaAT. The amounts of barleyAlaAT could only be measured relative tobackground (wild-type) and other transgeniclines. Moreover, barley AlaAT has thesame mass as the most abundant proteinin plant leaves, Rubisco, and migrates onits gel front further interfering with reliabledetection. We found that using LC–MS tomeasure the relative levels of barley AlaATwas a reliable alternative to traditional proteindetection techniques. Once peptideswere identified that would work for LC–MSdetection of barley AlaAT, optimizationof the MS parameters for consistent andaccurate detection was relatively simpleand provided a way to overcome interferencefrom other proteins such as Rubisco.Within a month, the limit of detection wasestablished, all four peptides were producingreliable spectra, and several plant lineshad been screened. The methodology hasbecome so facile that we intend to apply thetechniques to other rice lines that have notyet been evaluated in the field.
LC–MS can be subject to unpredictablematrix affects, creating difficulty inmeasuring specific target proteins. Herewe found that even though the relativeamounts of each peptide varied within asample, the averaged values provided away to more accurately quantify the levelsof transgenic protein in rice leaf tissue.
Before the development of LC–MS,researchers relied on using antibodies todetermine whether the targeted transgenicprotein was present in transformed material.However, antibodies are limiting inspecificity, expensive to develop, and requireseveral months to fully develop a reliableassay. Targeted protein detection usingMS reduces the total investment of time andmoney, while applying methodology thataccurately detects the target separate fromother proteins that may share similar oridentical sequences that may not be discernibleby older techniques.
Conducting field trials requires an extremelydemanding investment of time andmoney and is the core of the agriculturalbusiness. Demonstrating field efficacy isparamount to the potential commercializationof a product; without clear field data,the product is not considered. Therefore,several field trials are conducted over severalgrowing seasons, often yielding onlyone or two lead events that demonstrate apotential commercial product. The processcan take at least 4–5 repeated trials with thesingle event before the data can be compoundedto show the trait is working. Theprocess of plant transformation lends itselfto a range of lines with extremely low or nogene expression through high expression.In the event that protein levels can be tied totrait efficacy, LC–MS provides the ability toprescreen the transformation events in thegreenhouse before investment in full fieldevaluation.
Conclusion
We applied targeted LC–MS using syntheticstable isotope–labeled peptides tomeasure the levels of transgenic barleyAlaAT protein in various plant samples.LC–MS offered a unique approach to measurethe transgenic protein against nativeprotein levels. We were able to establish amethodology that can be applied to other rice transgenic events that may have differentprotein expression levels. The nextstep will be to discover the relationship betweenprotein levels and trait efficacy andthen continue to expand the methodologyto other plant species. Until recently, detectionof transgenic proteins mostly relied onolder methodology that could not discernsubtle differences in protein composition.As we continue to develop MS techniques,even more enhancements can be made todetect minor differences between molecularspecies and a broader application can bediscovered.
Acknowledgment
The authors would like to thankDr. Brett Phinney and Rudy Alvarado forinitially establishing the detected peptidesand providing helpful advice and guidanceregarding proteomic analyses. We wouldalso like to thank Dr. Margaret Miller andDr. Ann Slade for careful reading of thismanuscript.
References
(1) C.C. Wu and J.R. Yates III, Nat. Biotechnol.21(3), 262–267 (2003).(2) S.E. Ong and M. Mann, Nat. Chem.Biol.1(5), 252–262 (2005).(3) U. Lehmann et al., Plant J. 55(6),1039–4106 (2008).(4) M. Mann, J. Proteome Res. 7(8),3065–3065 (2008).(5) T. Fortin et al., Mol. Cell Proteomics8(5), 1006–1015 (2009).(6) A.K. Yocum and A.M. Chinnaiyan,Brief. Funct. Genomic. Proteomic.8(2),145–157 (2009).(7) A. Prakash et al., J. Proteome Res.8(6), 2733–2739 (2009).(8) H.W. Lahm and H. Langen, Electrophoresis21(11), 2105–2114 (2000).(9) A.K. Shrawat et al., Plant Biotechnol. J.6(7), 722–732 (2008).
Wayne Skinner, Zina Dahmani,Yingzhi Lu, Jean C. Kridl, andGia C. Fazioare with Arcadia Biosciences,Inc., in Davis, California. Direct correspondence to : gia.fazio@arcadiabio.com
Measuring Vitamin K1 Concentrations in Dogs with Chronic Enteropathy Using LC–MS/MS
May 14th 2025A joint study between the University of Tennessee (Knoxville, Tennessee) and the University of Pennsylvania School of Veterinary Medicine (Philadelphia, Pennsylvania) compared directly measured vitamin K1 (vitK1) concentrations in healthy dogs and dogs with chronic enteropathy (CE) using liquid chromatography tandem mass spectrometry (LC–MS/MS); they also investigated whether supplementation of vitK1 in dogs with CE would significantly increase vitK1 concentrations.
HPLC 2025 Preview: Fundamentally Speaking (Part 2)
May 14th 2025Michael Lämmerhofer from the Institute of Pharmaceutical Sciences, University of Tübingen, Germany, spoke to JFK Huber Lecture Award winner of 2024 Torgny Fornstedt, professor in analytical chemistry and leader of the Fundamental Separation Science Group, Karlstad University, Sweden, about his pioneering work in high performance liquid chromatography (HPLC) with a focus on fundamentals, ion-pair chromatography, and oligonucleotide applications.

.png&w=3840&q=75)

.png&w=3840&q=75)


.png&w=3840&q=75)


.png&w=3840&q=75)


