Peak Shape Problems
What causes split or fronting peaks?
Most of us are quite familiar with tailing peaks in liquid chromatography (LC) separations. In my experience, it is a rare chromatogram that is free of peak tailing. Peak tailing is understood reasonably well by most workers. In reversed-phase separations, it is primarily a result of unwanted secondary interactions — especially basic and acidic compounds that undergo ion exchange or interaction with metal contaminants in the silica-based stationary phase. These tailing problems usually affect just one or a few peaks in a chromatogram. What about those chromatograms in which all the peaks have severely tailing peaks, or split or doubled peaks? Then there are peaks that front badly — a rare event for most workers — but common under certain conditions. This month's "LC Troubleshooting" column will consider these last two problem areas.
Against the Flow
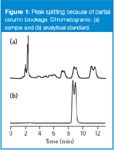
Recently, a reader sent me the two chromatograms shown in Figure 1. He observed that when he ran his samples for analysis, all the peaks in the chromatogram appeared as if in double vision, as seen in Figure 1(a). Reinjection of the same sample gave similar results, so he injected another sample, which also gave doubled peaks. This led him to wonder if the problem was associated with all injections, so he injected the analytical standard and observed the chromatogram shown in Figure 1(b). The laboratory had limited resources, with only one LC system and no spare column. This restricted the use of one of the most powerful troubleshooting techniques — substituting a known good part for a questionable one. Nevertheless, he did what he could. A new batch of mobile phase was made and new autosampler wash solvent was used with no improvement. The entire system was flushed thoroughly with acetonitrile in an effort to clean the column and wash the pump, autosampler and detector; this did not appear to help, either. Finally, in desperation, he reversed the column and was surprised to see the standard coalesce from a double peak to a single one. An injection of a sample also showed single peaks for each of the sample components. Because he was nervous about running the column in the opposite direction of the flow arrow, he returned the column to the normal direction, but found that the problem reappeared. It was at that point that he e-mailed me for help.

Figure 1
A Classic Chromatogram
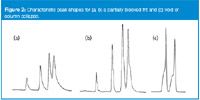
The reader had encountered one of the most easily recognizable problems with a chromatogram. In fact, this is so stereotypical that I often refer to this as a "signature chromatogram". It is characteristic of one of two types of column failure — a partially blocked column frit or a void at the head of the column. Other example chromatograms as a result of this are shown in Figure 2. The common symptom is that every peak in the chromatogram shows the same type of peak distortion — doubling, tailing, or another unexpected shape.

Figure 2
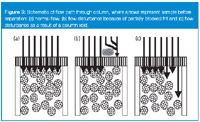
A well-behaved column will behave as shown in Figure 3(a). The frit at the head of the column allows the sample to be distributed evenly across the top of the column. Because no sample separation has taken place yet, each of the sample-stream arrows comprises a mixture of all the components of the sample. This injection front reaches the stationary phase at the same time and the separation process starts in the normal manner with some compounds migrating more quickly through the column than others to create the chromatographic separation. If the frit at the top of the column is partially blocked, the situation illustrated in Figure 3(b) might exist. Here, some of the sample is able to reach the stationary phase in the normal manner, whereas other parts of the injection stream are blocked from passage through the frit, so they must travel a longer path around the blockage before they reach the stationary phase. Thus, this portion of the sample injection stream reaches the column after the undisturbed portion. Because there is no separation yet, this process results in part of the sample getting a head start moving down the column. It is as if two injections took place, separated by a fraction of a second. This translates into a double chromatogram, one slightly delayed relative to the other. Depending upon the nature of the blockage, peak shape can vary widely from one instance to another, but in every instance, all peaks in a chromatogram are distorted in the same way.
Column reversal displaces the contaminant from the frit, perhaps a third of the time, so normal flow and peak shape is recovered. Sometimes the reverse-flush process permanently fixes the problem, even when the column is returned to its normal flow direction. In other instances, reversal can be ineffective or might be effective only when the column is reversed. My guess is that when physical contaminants are embedded in the frit, they are not displaced effectively during column reversal.

Figure 3
Procedural Notes
Column reversal is often effective at removing particulate matter from the head of the column, but a couple of precautions are in order. First, when the column is reversed for flushing, be sure to leave the outlet (the old inlet) routed directly to waste for a few minutes before connecting it to the detector. If particulate matter is displaced, you do not want it to be flushed into the detector to cause problems there!
A second concern is whether or not the column can be reversed. Columns packed with 5 μm or larger particles use 2 μm porosity frits to hold the packing in the column. These columns can usually be reversed without any concern — the flow arrow is more of a reference mark than anything else. Whereas, 3 μm particles often have a sufficiently broad particle size distribution that a 2 μm frit is not sufficiently small to contain all the particles. For this reason, a 0.5 μm frit is used to terminate the column. However, the 0.5 μm frit is the same size as the in-line filter many workers install directly downstream from the autosampler to protect the column. These frits get blocked very easily and are one of the reasons 3 μm particle columns are blocked more easily than 5 μm particle ones. One way to minimize column blockage yet contain the particles is to use a 0.5 μm frit at the column outlet and a 2 μm frit on the inlet. The 2 μm frit is less susceptible to blockage, yet is sufficient to hold the particles in place as long as the flow is in the normal direction. In my experience, 3 μm particle columns with 2 μm inlet frits can be reversed briefly for flushing, but they should not be run in the reversed direction for a long time or particle leakage can occur. With the newest sub-2 μm particles, even the 0.5 μm frit is too porous, so 0.2 μm frits are used. I'm not sure if some manufacturers use a 0.5 μm inlet frit with a 0.2 μm outlet frit, but if this is the case, the same reversal precautions should be taken. As the saying goes: "If all else fails, follow the directions." You should consult the column manufacturer's care and use instructions before reversing any column to be sure you will not damage it.

Figure 4
Of course, the best way to avoid problems related to column blockage is to minimize the exposure of the column to particulate matter. This means that the sample preparation process should include a step to remove particles. Some workers prefer to filter all the samples, but this is expensive and might require extra validation steps to ensure that sample is not selectively lost on the filter or that contaminants are added by the filter. My preference is to centrifuge all samples briefly in a benchtop centrifuge before placing them in the autosampler vials.
Fronting Peaks
Whereas tailing peaks are fairly ubiquitous in reversed-phase separations, fronting peaks are much more rare. Some workers will never see an instance of peak fronting. Figure 4 shows an instance of peak fronting that was encountered in my laboratory several years ago.1 This method used a high-pH (pH 9.0) and highly aqueous (95% buffer) mobile phase with a silica-based C18 column. Column failure occurred with disturbing regularity after approximately 500 injections, with dramatic peak fronting. The source of peak tailing is described easily by secondary chemical interactions between the sample (often a basic compound) and the silica-based column-packing material. Peak fronting, however, is best described by a physical problem with the column. This can be explained by a column void, distorting the sample flow path as shown in Figure 3(c). In this instance, a small portion of the sample is able to move quickly down the column through a void or channel in the column, getting a head start on the bulk of the injected sample. This results in a fronting peak, as in Figure 4(b); when more than one peak is present, all the peaks will show fronting, as in Figure 3(c).
In the present example, the method had two potential problem areas that converged to create the problem. First, the mobile phase pH of 9.0 was necessary to achieve the desired separation. The normal silica-based columns that are used for most LC applications are stable in the range of 2 < pH < 8. Below pH 2, the bonded phase is hydrolysed and lost; above pH 8, the silica particles tend to dissolve. Some columns, such as those using "hybrid" silica-based particles, are designed for operation at pH > 8. Another alternative is to use one of the polymer-particle columns that are not susceptible to base attack.
A second problem associated with the method of Figure 4 was the need to operate in a highly aqueous mobile phase (95% buffer) to get sufficient retention for the analyte of interest. One approach to improving operation in highly aqueous mobile phases is to use one of the embedded-polar-phase or "AQ"-type columns that many manufacturers sell for use with 100% aqueous mobile phases. Another option for use of highly aqueous mobile phases that at least one manufacturer uses is to reduce the surface coverage of the C18 phase so that more of the polar silica surface is exposed. This was the type of column used for the separation of Figure 4.
Unfortunately, two influences converged to make this column and mobile phase combination a problem — high-pH mobile phase plus a low-coverage column. The column collapsed after approximately 500 injections, as indicated by a badly fronting peak [Figure 4(b)]. Fortunately, the peak area was not affected for our method, so failure during a sample batch allowed for accurate quantification of the samples, even with fronting peaks. The column, of course, was replaced before another sample batch was run. One can only speculate on how this deadly combination was missed during development and validation of the method, but by the time it was realized, correction of the problem would have required revalidation of the method. We found that the data were sufficiently accurate for the application and the method has performed well for more than 10000 samples. Yes, column replacement is expensive, but the column cost is only a small fraction of the overall analysis cost. A typical LC–tandem mass spectrometry (MS–MS) method such as this costs $50–$100/sample, so a $500 column replaced after 500 injections amounts to < 2% of the overall costs — certainly not worth the expense of revalidating the method in the present instance.
Conclusions
Physical problems at the inlet of the column can cause split or doubled peaks or peak fronting. These problems often require replacement of the column. If the column life and the data quality are sufficient, it might not be worth changing the method to avoid problems. Two simple practices should minimize or eliminate the problems discussed this month. The use of a 0.5 μm porosity in-line filter plus sample centrifugation or filtration should prevent problems associated with column blockage. Careful adherence to the recommended mobile-phase pH limits or selection of a column designed for high-pH work should have avoided the problems associated with fronting peaks.
Reference
1. R.D. Morrison and J.W. Dolan, LCGC Eur., 18(7), 386–389 (2005).
"LC Troubleshooting" editor John W. Dolan is vice president of LC Resources, Walnut Creek, California, USA; and a member of the Editorial Advisory Board of LCGC Europe. Direct correspondence about this column to "LC Troubleshooting", LCGC Europe, Advanstar House, Park West, Sealand Road, Chester CH1 4RN, UK.
Determining the Effects of ‘Quantitative Marinating’ on Crayfish Meat with HS-GC-IMS
April 30th 2025A novel method called quantitative marinating (QM) was developed to reduce industrial waste during the processing of crayfish meat, with the taste, flavor, and aroma of crayfish meat processed by various techniques investigated. Headspace-gas chromatography-ion mobility spectrometry (HS-GC-IMS) was used to determine volatile compounds of meat examined.

.png&w=3840&q=75)

.png&w=3840&q=75)


.png&w=3840&q=75)


.png&w=3840&q=75)


