Comprehensive 2D GC–QPMS with Differential Flow Modulation
Differential flow modulation is an inexpensive way to perform GCÃ-GC separations which has been attracting growing attention recently. Differential flow modulation uses high carrier gas flow rates in the second dimension column so it is widely thought that this rules out direct coupling with mass spectrometry. However direct coupled GCÃ-GC-QPMS using differential flow modulation is reported here for the first time using an unmodified mass spectrometer comprising a dual inlet turbomolecular pump and fast scanning quadrupole mass analyser. The suitability of the approach for characterization of essential oils is demonstrated.
Comprehensive two-dimensional (2D) gas chromatography (GC×GC) has developed steadily over the past 20 years since its introduction by Liu and Phillips.1 The key to GC×GC is modulation and the literature is dotted with different types of modulation interfaces for GC×GC. While many of these offer unique features, all modulators essentially strive to achieve the same basic function, which is mass-flow modulation of the first dimension chromatographic signal, that is, the modulation interface (the modulator) is placed at the confluence of the first and second dimension columns and varies the first dimension column output between the normal value (shown by a dotted line in Figure 1) and the detector background. Injection into the second dimension column is performed when the modulator releases solute. The modulator then stops solute outflow from the first column while separation of the injected band proceeds in the second dimension separation column. The frequency of injections into the second dimension column is usually 0.25–1 s–1.
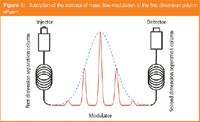
Figure 1
Just about any modern gas chromatograph is suitable to be fitted with a GC×GC modulation interface, provided that the system has electronic pneumatics control and a fast detector, both of which are standard accessories on most gas chromatographs available today. Modulation can be achieved by thermal solute manipulation using cryogenic systems, or it can be performed by using valve-based modulators that are categorized2 as either sub-sampling modulators or differential flow modulators. This article will focus on differential flow modulation and readers are directed elsewhere3 for a detailed description of thermal modulation and of sub-sampling valve-based modulation.
Differential Flow Modulation
The champion of differential flow modulation for GC×GC is John Seeley from Oakland University (Rochester, Michigan, USA). Seeley and co-workers first described a differential flow modulator that incorporated a six-port diaphragm valve that was positioned between the first and second dimension columns.4 The six-port valve is held in the "collect" position for 80% of each modulation cycle [Figure 2(top)] where the sample collection loop is charged with solute from the first dimension column. When the valve is actuated, the sample loop is rapidly discharged using a carrier gas flow-rate that is kept at least 20 times higher than the first dimension flow-rate. The volume of gas collected from the outlet of the first dimension column in the sample loop can be transferred to the second dimension column with a width of approximately 5% of the collection time so the injection bandwidth into the second dimension column is minimized.
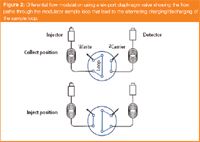
Figure 2
This time compression leads to peak amplitude enhancement, which is a highly desirable artefact of GC×GC modulation. A diaphragm valve-based differential flow modulator can be used with one4 or two5,6 second dimension columns and has been shown to perform well for the analysis of volatile compounds, but its temperature-operating range is severely limited by the upper temperature limits of the diaphragm valve.
Another inherent disadvantage of this interface is that the first dimension sample flows directly to waste for 20% of the modulation cycle, when the valve is in the inject state [Figure 2(bottom)], leading to incomplete sample transfer and reduced peak amplitude enhancement.
The second-generation differential flow modulator7 passed 100% of the sample to the second dimension, had no inherent temperature restrictions and did not use a diaphragm valve. Described as a flow-switching device for GC×GC,7 this type of modulator can be constructed from tubing, four tee unions and a solenoid valve, which is located outside the oven of the gas chromatograph. This modulator was used for diesel analysis7,8 and for analysis of aromatic compounds in gasoline, as well as for trace analysis of pesticides in foodstuff,8 however, this technology has been largely replaced by a further simplified device.2 This third-generation differential flow modulator can also be constructed using tubing, two tee-pieces and a solenoid valve, which is located outside the oven of the gas chromatograph according to the scheme presented in Figure 3.
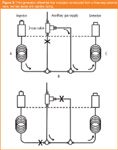
Figure 3
In the upper diagram, solute from the first dimension column (A) is shown flowing into the sample collection loop (B), while carrier gas is provided through the right hand side of the three-way valve to the second dimension column (C). Upon actuating the valve, the sample collection loop is rapidly discharged and the first dimension column is momentarily in stop-flow state.
This third-generation differential flow modulation has been proven highly effective and a few applications of gasoline analysis have been presented2,10,11 as well as analysis of biodiesel/petroleum diesel blends12 in addition to analysis of extractable petroleum hydrocarbons13 in water and soil. A proprietary version of this type of differential flow modulator has been commercialized recently by Agilent Technologies.14
All differential flow modulators use high second dimension column carrier gas flow-rates (10–20 mL/min), so it is widely thought that this rules out direct mass spectrometric detection.2 Usually differential flow modulation GC×GC–MS requires a specialized MS interface, for instance Diehl and Di Sanzo used an open split interface to perform GC×GC–MS with differential flow modulation15 and Amirav and co-workers have reported GC×GC–MS using differential flow modulation8 by coupling their GC×GC to a custom MS incorporating supersonic molecular beam (SMB) technology. Unlike most GC–MS interfaces, SMB-MS actually needs a high helium flow (typically 90 mL/min) for proper operation.16 In the present study we have investigated the suitability of a non-modified quadrupole mass spectrometer (QPMS) for GC×GC–QPMS with differential flow modulation. Although QPMS instrument data collection rates are not optimal for GC×GC, Shellie and Marriott first showed that rapid-scanning QPMS was compatible with GC×GC when a nominal scan rate of 20 scans/s was applied (with full-scan spectrum acquisition 41–229 u).17 Later, Adahchour et al.18 and others19–21 have also shown suitability of GC×GC–QPMS with cryogenic modulation. The instrument chosen for this study uses a differentially pumped vacuum system with a dual inlet turbomolecular pump (179 L/s + 185 L/s He). The instrument is reported to permit column flow of up to 15 mL/min,22 and it was with this in mind that GC×GC–QPMS with differential flow modulation was attempted with direct MS coupling. It was found that highly satisfactory results could be obtained for essential oils analysis. Some of these analyses are discussed here.
Experimental
Samples and standard compounds: A commercial tea tree essential oil (Melaleuca alternifolia) was purchased from a local store in Hobart, Australia. The hydrodistilled hop essential oil (Humulus lupulus) was received from the School of Plant Science, University of Tasmania, Australia. This sample was extracted from hop cones collected from plants grown at Bushy Park Estates (Bushy Park, Australia). 20% solutions of each of the essential oils were prepared by diluting the neat essential oils with methylene chloride. An n-alkane mix (C8–C20) was purchased from Sigma (Castle Hill, Australia) for determination of retention indices and was used as received.
Instrumentation and operating conditions: The Shimadzu QP2010 Plus GC–MS system (Shimadzu Oceania, Sydney, Australia) consisted of a GC–2010 gas chromatograph an MS-QP2010 quadrupole mass spectrometer and an AOC-20i autosampler.
The GC was equipped with two split/splitless (S/SL) injectors and a rapid scanning quadrupole mass spectrometer. The differential flow modulator was constructed using two Swagelok stainless steel tees (part number SS-100-3; Swagelok, Broadmeadows, Australia) and various lengths of deactivated fused silica capillary (SGE, Ringwood, Australia) as shown in Figure 4. The first dimension separation column (7.5 m × 0.100 mm i.d. × 10 μm BPX5; 5% phenyl polysilphenylene-siloxane; SGE) was connected directly to one of the S/SL injectors and terminated 30 mm inside the 0.5 m × 0.530 mm i.d. deactivated fused silica modulator sample tube, in the same way described by Amirav and co-workers.10 Similarly, the inlet of the second dimension column (1.0 m × 0.320 mm i.d. × 0.25 μm BP20; polyethylene glycol; SGE) was inserted 30 mm into the terminal end of the modulator tube, with the outlet coupled directly to the MS interface. Two lengths of deactivated fused silica capillary tubing completed the differential flow modulator. These were each 0.60 m × 0.250 mm i.d. and were connected either to the second S/SL or the three-way switching valve (part number 091-0094-900; Parker Hannifin Australia, Castle Hill, Australia) located outside the GC oven.
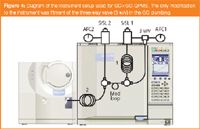
Figure 4
The carrier gas supply to each of the S/SL injectors was controlled by a Shimadzu Advanced Flow Control (AFC) unit. Both AFCs were operated in constant pressure mode 75 KPa (AFC2) and 125 KPa (AFC1). Other operating parameters were as follows: injection mode (230 °C); split flow (20 mL/min); injection volume 1.0 μL; carrier gas (He); temperature programme 60–240 °C at 3 °C/min. MS Ion source 200 °C; interface temp 250 °C; interval scan 40–400 m/z; scan speed 10000 amu/s. The data acquisition rate for all analyses was 33.33 scans/s.
All data were collected by the GC–MS Solution software (Shimadzu). Compounds were identified by using the FFNSC 1.2 mass spectral library database (Shimadzu).
Results and Discussion
Retention indices are vitally important in GC–MS analysis of essential oils, flavours and fragrances. Thus a homologous series of C8–C20 normal alkanes was analysed using identical conditions to the essential oil analyses. A line of best fit for retention time of each alkane vs linear retention Index (LRI) was constructed by least squares regression.
The coefficient of determination (R2) for the linear regression was 0.9980 for C9–C20 (C8 was eluted within the solvent cut period). This is a good indication that the integrity of the first dimension chromatogram is essentially unaffected by the stop–start flow regime in the first dimension column.
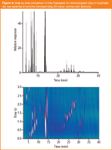
Figure 5
A typical GC×GC–QPMS chromatogram of tea tree essential oil is shown in Figure 5 along with the corresponding 2D separation space colour contour plot. The general appearance of these chromatograms and the numbers of analytes detected are comparable to previously reported studies of this sample using cryogenic modulation.23 A list of compounds identified in the essential oil is given in Table 1.

Table 1: List of compounds identified in the tea tree essential oil sample with match quality and retention index indicated. *Terpinen-4-ol, the major component in tea tree oil has a longer retention index because the peak is grossly overloaded. **α-Terpineol and trans-dec-4-enal analytes are eluted soon after the terpinen-4-ol peak and their retention is affected by the overloaded peak. An annotated 2D chromatogram may be requested by emailing the author Robert.Shellie@utas.edu.au
Figure 6 shows a comparison of the mass spectrum of two selected compounds with the library spectrum. The upper two spectra reflect the close agreement between the reference spectrum and library spectrum of α-pinene, a monoterpene that is present in relatively high abundance in tea tree essential oil and the lower two spectra reflect similarly high congruency between the reference spectrum and library spectrum for α-guiaene, a sesquitepenoid compound that appears in much lower abundance. Indeed, very close agreement was observed for all of the compounds listed in Table 1, as reflected in the high library match probabilities. This observation is consistent with thermal modulation GC×GC–QPMS using much lower carrier gas flows into the MS. This indicates that the current instrument configuration is perfectly capable of GC×GC–MS with differential flow modulation.
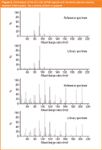
Figure 6
A typical GC×GC–QPMS chromatogram of the more complex hop essential oil is given in Figure 7 along with the corresponding 2D separation space colour contour plot. An expanded region of the modulated chromatogram is inset to highlight the suitability of the 33.33 scans/s data acquisition rate of the QPMS with this GC×GC approach. In differential flow modulation, the width of the injection band into the second dimension column is determined by the flow ratio of the two columns10 and this is typically broader than thermal modulation, which delivers a very narrow injection band. Even though a very high second dimension flow-rate is used in the long second dimension column, the hold-up times are at least twice as long as GC×GC with thermal modulation and short columns. This translates to longer retention times and broader peaks in the second dimension column. In this study 33.33 Hz has provided satisfactory data density to reliably detect the GC×GC peaks.
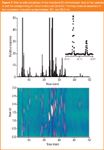
Figure 7
Conclusions
This study has revealed that direct coupling of QPMS with differential flow modulation GC×GC is possible. The basic requirements of the QPMS instrument are fast scan capabilities, in this instance in the order of 10000 amu/s and high pumping capacity. The data acquisition rate used here was 33.33 Hz and was adequate for detection of peaks generated by using differential flow modulation. The differentially pumped QPMS used in this investigation was clearly capable of handling the high second dimension column flows employed in these experiments.
Acknowledgement
This work was supported under the Australian Research Council's Discovery funding scheme (project number DP0771893). The generous support of Shimadzu Oceania is gratefully acknowledged.
Dr Robert Shellie is an Australian Research Council Postdoctoral Fellow at the Australian Centre for Research on Separation Science (ACROSS) and Lecturer in the School of Chemistry at University of Tasmania. His research focuses on the development and application of hyphenated techniques in chromatography to solve complex separation problems.
References
1. Z. Liu and J.B. Phillips, J. Chromatogr. Sci., 29(66), 227–231 (1991).
2. J.V. Seeley et al., Am. Lab., 38(9), 24–26 (2006).
3. M. Adahchour et al., Trends Anal. Chem., 25(6), 540–553 (2006).
4. J.V. Seeley, F. Kramp and C.J. Hicks, Anal. Chem., 72(18), 4346–4352 (2000).
5. J.V. Seeley, F.J. Kramp and K.S. Sharpe, J. Sep. Sci., 24(6), 444–450 (2001).
6. J.V. Seeley et al., J. Sep. Sci., 25(1–2), 53–59 (2002).
7. P.A. Bueno Jr and J.V. Seeley, J. Chromatogr. A, 1027(1–2), 3–10 (2004).
8. M. Kochman et al., J. Chromatogr. A, 1129(1), 95–104 (2006).
9. N.J. Micyus, J.D. McCurry and J.V. Seeley, J. Chromatogr. A, 1086(1–2), 115–121 (2005).
10. M. Poliak, M. Kochman and A. Amirav, J. Chromatogr. A, 1186(1), 189–195 (2008).
11. J.V. Seeley et al., Anal. Bioanal. Chem., 390(1) 323–332 (2008).
12. J.V. Seeley et al., J. Chromatogr. Sci., 45(10), 650–656 (2007).
13. S.K Seeley et al., J. Chromatogr. Sci., 45(10), 657–663 (2007).
14. Simpler, more reliable GCxGC (Agilent Technologies Inc., USA, 2007).
15. J.W. Diehl and F.P. Di Sanzo, J. Chromatogr. A., 1080(2), 157–165 (2005).
16. A. Amirav et al., J. Mass Spectrom., 43, 141–163 (2008).
17. R.A. Shellie and P.J. Marriott, Analyst, 128(7) 879–883 (2003).
18. M. Adahchour et al., J. Chromatogr. A, 1067(1), 245–254 (2005).
19. C. Cordero et al., J. Chromatogr. A, 1150(1),37–49 (2007).
20. H.U. Baier and S. Böhme, LCGC Eur., The Applications Book, 17–18 (March, 2008).
21. C. von Mühlen et al., J. Chromatogr. A, 1200(1), 34–42 (2008).
22. http://www.ssi.shimadzu.com/products/product.cfm?product=qp2010
23. R. Shellie, P. Marriott and C. Cornwell, J. High Resolut. Chromatogr., 23(9), 554–560 (2000).
Analysis of Pesticides in Foods Using GC–MS/MS: An Interview with José Fernando Huertas-Pérez
December 16th 2024In this LCGC International interview with José Fernando Huertas-Pérez who is a specialist in chemical contaminants analytics and mitigation at the Nestlé Institute for Food Safety and Analytical Sciences at Nestlé Research in Switzerland, In this interview we discuss his recent research work published in Food Chemistry on the subject of a method for quantifying multi-residue pesticides in food matrices using gas chromatography–tandem mass spectrometry (GC–MS/MS) (1).
The Use of SPME and GC×GC in Food Analysis: An Interview with Giorgia Purcaro
December 16th 2024LCGC International sat down with Giorgia Purcaro of the University of Liege to discuss the impact that solid-phase microextraction (SPME) and comprehensive multidimensional gas chromatography (GC×GC) is having on food analysis.


