Peak Purity in Liquid Chromatography, Part 1: Basic Concepts, Commercial Software, and Limitations
LCGC Europe
Is that peak “pure”? How do I know if there might be something hiding under there?
Sarah C. Rutan1, C.J. Venkatramani2, and Dwight R. Stoll3, 1Virginia Commonwealth University (VCU), Richmond, Virginia, USA, 2Genentech USA, San Francisco, California, USA, 3LC Troubleshooting Editor
Is that peak “pure”? How do I know if there might be something hiding under there?
If we approach our data with a sceptical mindset, as chromatographers we know that there is always the possibility that a peak in a chromatogram that we perceive as a “pure peak” (that is, only one chemical component is eluted at that time) is actually composed of multiple coeluted components. From the point of view of quantitative analyses-answering the question “how much is there?”-this possibility is always a concern because assuming that a peak is pure when in fact it is not will lead to inaccurate quantitative determinations for the compound of interest. From the point of view of qualitative analyses-answering the question “what is it?”-it is a concern too, because if we think we have identified 10 components when in fact 11 components are present, we will have missed one, and that could have significant consequences (for example, impacts on health or profits). Given the importance of this issue, which we commonly refer to as “peak purity”, an immense amount of research has been dedicated to the development of concepts and tools that can increase our confidence that we know what we are looking at in our chromatograms. However, 50+ years after the introduction of what we now call high performance liquid chromatography (HPLC), we arguably still do not have a one-sizeâfitsâall solution to this problem. In this instalment of “LC Troubleshooting”, we are tackling the peak purity topic in part 1 of a multi-part series where we will explore some of the concepts behind peak purity assessments, describe some tools that are used in commercially available software for these assessments, and highlight some of the limitations of these tools using real-world examples. For this purpose, I have enlisted two experts in data analysis and pharmaceutical analysis to work with me in addressing these issues. In subsequent instalments, we will expand our discussion of the peak purity topic to include advanced data analysis strategies that can be used in cases where simpler tools are inadequate, as well as the potential for two-dimensional liquid chromatography (2D-LC) to provide robust answers to questions about peak purity.
Dwight Stoll
Peak Purity: An Introduction
Of all of the application areas where the concept of peak purity is relevant, it has received the most concentrated attention in the pharmaceutical industry, and thus much of our discussion in this instalment is set in this context. Ensuring drug product quality and patient safety is the primary objective of the pharmaceutical industry and regulatory agencies around the world. Regulators expect that the pharmaceutical industry complies with the International Conference on Harmonization of Technical Requirements for Registration of Pharmaceuticals for Human Use (ICH) guidelines (ICH Q3A – Q3D) (1–4) on impurities in new drug substances and drug products, including residual solvents and elemental impurities. Significant effort on the part of both companies and regulators is dedicated to the delivery of safe and efficacious medications of desired quality and strength.
Various analytical tests that include methods to assess attributes ranging from appearance, identity including form, assay (weight or weight against a standard), impurities (organic and inorganic, including residual solvents), water content, and particle size analysis are performed on active pharmaceutical ingredients (APIs). Similarly, oral drug products (that is, the API plus excipients) are tested for appearance, identity, assay (weight or weight against a standard) and impurities, uniformity of dosage units, dissolution, microbial content, and water content. Among these tests, those for determinations of assay and impurities, including chiral impurities if applicable, are the most critical because they have the most potential to impact the safety and efficacy of the drug product.
Developing a specific, so-called “stability indicating method” to determine the drug substance and drug product content (weight or weight assay), quantitate impurities, and determine potential degradation products is extremely important because it provides evidence that the method is adequate to monitor the quality of the material during its shelf time. Developing this type of method usually starts with screening columns of different selectivity, using mobile phases at different pH values, and the analyses of samples of the drug product stressed by different means (for example, acid, base, peroxide, light, and heat). Stressed samples are used upfront to assess the adequacy of the method to support long-term stability studies of drug products justifying their shelf life (or expiry). In addition, it can help to identify the likely degradation products and hence the degradation pathways. Increasingly, it is expected that method optimization software tools are used to ensure that methods are robust from the start-this is the spirit of the so-called quality-by-design (QbD) approach to method development (5). Typically, in these methods diode-array detection (DAD) or mass spectrometry (MS) is used to detect compounds as they are eluted from the column. To the extent that the spectrum (ultraviolet [UV] or mass) of a particular compound is characteristic of that compound, examination of the evolution of the spectrum across a peak provides a means to assess peak purity. However, impurities and degradation products eluted in the proximity of the main component are usually structurally similar. This, in turn, means that their DAD spectra are often highly similar, and great care is required in the interpretation of spectral purity assessments and consideration of complementary data that support the peak purity assessment (for example, elution patterns observed with complementary column selectivities, and MS data).
The presence of high potency impurities or inactive impurities in the dosage form can impact the biological activity of drug products. There are several wellâknown examples from the history of drug development that illustrate the importance of detecting coelutions. (S)-(+)-naproxen is effective in the treatment of arthritis, whereas its enantiomer causes liver poisoning. Similarly (S,S)-(+)-ethmbutol is effective in the treatment of tuberculosis, whereas its enantiomer causes blindness (6). Finally, R-thalidomide was known to be effective in the treatment of morning sickness; however, the enantiomer is a teratogen (7). Thus, accurate assessment of peak purity is critical to the assurance of the safety and efficacy of drug products.
Principles of Peak Purity Assessment Using DAD
As a chromatographer, the question most often asked when it comes to peak purity is: Is this chromatographic peak comprised of a single chemical compound? Unfortunately, there is no definitive answer for this question using the conventional peak purity methods that are available in commercial software. Rather, these software tools provide an answer to the question: Is this chromatographic peak composed of compounds having a single spectroscopic signature? This concept, typically referred to as spectral peak purity, can be addressed to varying degrees by most commercially available data systems for LC.
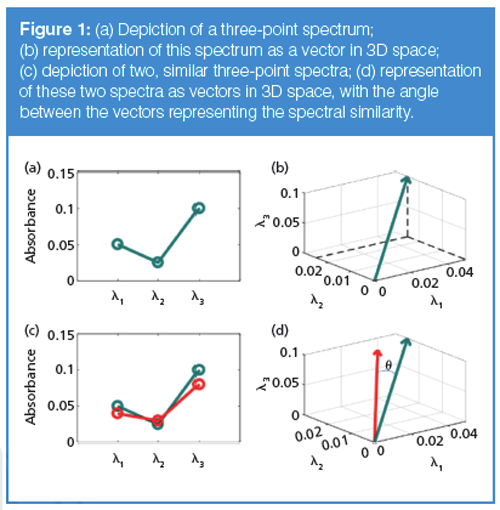
Theoretical Basis of Spectral Peak Purity Assessment: The concept of spectral peak purity, as embodied in most chromatographic data systems, is based on viewing a spectrum as a vector in n-dimensional space, where n is the number of data points in the spectrum (8). To more easily visualize this concept, let us take an example of a spectrum measured at just three wavelengths, λ1, λ2, and λ3, as shown in Figure 1(a). We can plot this spectrum as a vector in threeâdimensional (3D) space as shown in Figure 1(b), where the vector terminates at a point with coordinates that are the absorbance values for the three wavelengths. Then, given a second spectrum, shown in red in Figure 1(c), we are interested in a way to quantify the similarity of the two spectra. A convenient means of assessing spectral similarity is to determine the angle between the two vectors that represents the spectra in n-dimensional space, as shown in Figure 1(d). If the angle Ï´ between the two vectors is zero, the shapes of the two spectra are identical (even if the overall intensities of the two spectra are different). If we denote the blue spectrum (vector) as spectrum a and the red spectrum (vector) as spectrum b, the spectral similarity can be calculated as the cosine of the angle Ï´ as follows:

where the bold face, lowercase letters denote vectors, or a list of the coordinates for the vector (three values in the present illustration; n values for the general n-dimensional case). The numerator represents the dot product of the two vectors, and the || || notation represents the vector norm, or in more conventional terms, the length of the given vector. Dividing by the length of the vectors results in a value for the spectral similarity that is independent of the amplitude of the signal and only dependent on the shape of the spectrum, as mentioned above.
An alternate means of determining the spectral similarity used by some chromatographic data systems involves the correlation coefficient between the two spectra, which is calculated as follows:

where the aj and bi values indicate the absorbance values at the ith wavelength. As long as the vectors are mean-centred prior to applying equation 1, it turns out that

so that the two measures of similarity are equivalent.
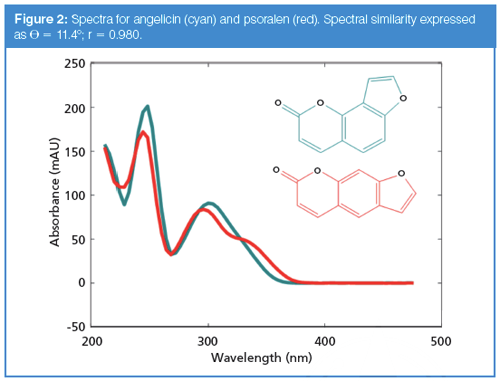
Illustration of Spectral Similarity Determination Using Real Spectra: We next turn to a comparison of two similar, but not identical spectra to see how this concept of spectral similarity applies in practice. Figure 2 shows the spectra of two isomeric compounds, angelicin (blue) and psoralen (red). Applying mean centring, the cosine of the angle between them (and equivalently the correlation coefficient) is 0.980, and the angle (sometimes called the spectral contrast angle) is 11.4°. Without mean centring, the cosine of the angle is 0.988 and the corresponding angle is 8.97°. From inspection, it can be seen that these spectra, while similar, are not identical.
We now explore how to determine whether or not a particular chromatographic peak is pure using this metric. Figure 3(a) shows a chromatographic peak for which we would like to know the peak purity, and Figure 3(b) shows the contour plot for this peak, where the coloured contours indicate the absorbance at each time or wavelength point. The peak purity software provided by many chromatographic data system vendors points out the importance of baseline removal before peak purity analysis; this baseline is shown in Figure 3(a) as running from the peak start and stop limits (red hatch marks) from 9.9 to 12.7 min.
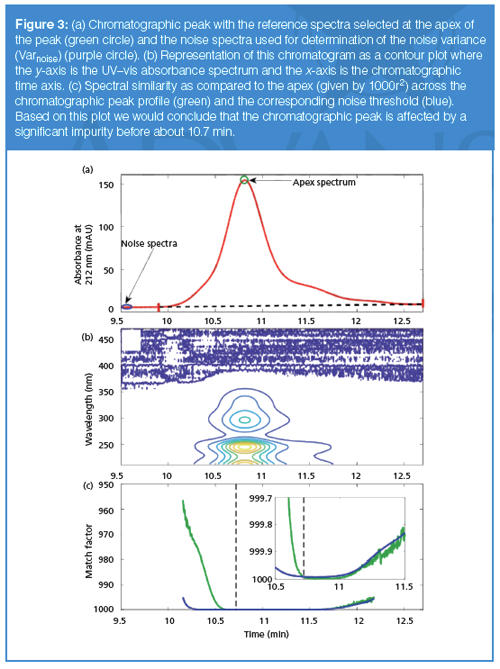
We then select the spectrum at the peak apex to serve as the reference spectrum (one option of several typically provided by the chromatographic data system vendor). It is often recommended to choose the apex from the “max” chromatogram (constructed using largest absorbance observed for each spectrum). Then, the similarity between this apex spectra and all the spectra across this peak (denoted by the index j) is evaluated, as shown in equation 4:

The evolution of this similarity value across the peak is shown in Figure 3(c) by the green curve (shown as 1000r2; this is the match factor used by Agilent software; also note the inverted y-axis used in the Agilent software as well) (9,10). Although the correlation is quite high across the top of the peak, correlation values are lower on the leading edge of the peak, leading to the question of whether or not this peak is “spectrally pure”. To more adequately address this question, we need to establish a threshold to determine whether or not this correlation is sufficiently high enough to conclude that this is a pure peak. It is at this point where the different vendors of chromatographic data systems apply slightly different approaches.
In the Agilent software, the threshold curve is calculated as shown in equation 5:

where the variance of the noise (Varnoise) is calculated from a default or user specified range of spectra where no analytes absorb, indicated by the purple circle in Figure 3(a). The Varj is the variance of the jth spectrum and Varapex is the variance of the apex spectrum (or another reference spectrum as specified by the user). This threshold curve is shown in purple in Figure 3(c). The inset figure shows an expanded view and indicates that this peak appears to be affected by an impurity at elution times earlier than about 10.7 min. In fact, this peak is composed of 50 ppm of psoralen (spectrum shown in red in Figure 2), with a retention time at 10.8 min, and 5 ppm of angelicin (spectrum shown in cyan in Figure 2), with a retention time at 10.4 min, which is the “impurity” detected by the software. In addition to providing a peak purity plot such as that shown in Figure 3(c), vendors often provide an overall peak purity measure and threshold for the entire peak. For example, Agilent determines the total number of spectra within the peak that are judged as impure by comparison of the match factor and threshold, and averages the match factor and thresholds for these spectra. For the example shown above, 1446 out of the 2430 spectra across the peak had match factors that were less than the corresponding threshold values, where the average match factor for these spectra was 992.8 and the average threshold was 999.0, again leading to the conclusion that this is an impure peak.
Other vendors of chromatographic data systems use variations on this general approach to quantify peak purity. For example, Shimadzu (11) uses the cosine of the similarity angle to quantify purity, and uses the following expression for the threshold
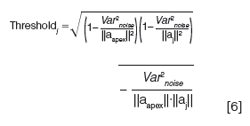
Meanwhile, Waters Empower software uses the similarity angle directly, and calculates a threshold based on both solvent and noise contributions (12). In using any of the chromatographic data system methods for assessing peak purity, it is critical to follow their guidance for baseline subtraction and noise estimation to get the most robust results for a spectral purity conclusion.
The concept of spectral similarity for assessment of peak purity using DAD is very useful in many situations, and it is attractive because of its low cost. A low spectral similarity value or match factor can provide an indication to the analyst that an impurity is present; however, high spectral similarities or match factors that indicate that the spectra across a peak are not significantly different may still occur for impure peaks for one or more of the following reasons:
- impurities are present at much lower concentrations (absorbances) than the main compound,
- the spectra for the main compound and the impurity are identical or very similar, and
- the impurity is coeluted with the main compound with a retention profile that has the same shape and retention time as the main compound (9).
Examples from Analyses of Real Pharmaceutical Materials
In the following case study we show examples from the analysis of a linker drug intermediate that highlights both the strengths and limitations of the spectral purity approach to assess peak purity. In this case, all peak purity calculations were carried out using Waters Empower 3 software. Synthesis and analysis of linker drug intermediates is extremely challenging because of their high reactivity, chemical instability, multistep synthetic routes, and relatively high molecular weight for a small molecule pharmaceutical (13). They are key component of antibody–drug conjugates (ADCs) used in oncology.
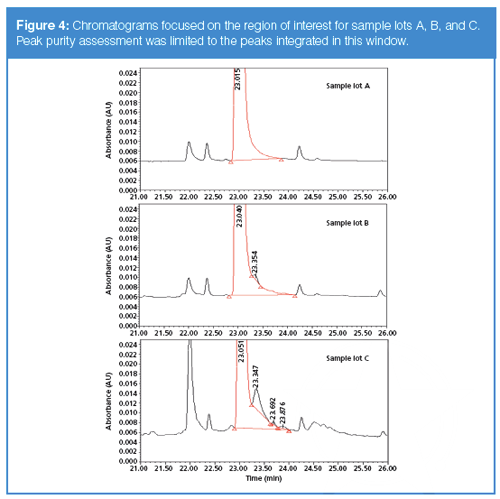
HPLC separations of three synthesis lots of linker drug intermediate are shown in Figure 4, with an expanded scale around the main linker drug peak. This plot shows lot-to-lot variability with multiple components eluted in the proximity of the main component. Developing an HPLC method to resolve these structurally similar compounds is challenging and requires peak purity assessment using DAD data along with MS detection, and screening of complementary column selectivities to minimize the likelihood of impurities coeluted with the main component.
Figure 4(a) shows the chromatographic profile of sample lot A with no noticeable peaks eluted in the trailing edge of the main component (retention time at 23.015 min) whereas sample lot B (Figure 4[b]) shows an impurity at a retention time of 23.354 min. In this example, only peaks in the trailing edge of the main component are integrated. The area percent of the impurity peak is 0.13% (Figure 4[b]). Sample lot C shows multiple components eluted in the trailing edge of the main component with a major impurity at 1.4% relative area (Figure 4[c]).
The results of peak purity analysis of sample lot A are shown in Figure 5. The purity angle of the main component (0.054) was less than the threshold (0.235), and the purity curve is below the threshold curve across the entire peak, indicating spectral homogeneity across the peak.

Figure 6(a) shows peak purity analysis of sample lot B. The main component peak (that is, the peak at 23.036 min) in this case passes spectral peak purity (false negative) even though a visibly noticeable impurity is present in the trailing edge of the peak as shown in Figures 4(b) and 6(b). The overall peak purity was determined to be 0.078 and the overall threshold was 0.235, indicating that the peak is spectrally pure. Possible explanations for this false negative include high spectral similarity between the main component and impurity peak, or the low level of the impurity relative to the main component (~0.13%). The high degree of similarity in the normalized UV spectra of the main component and impurity peak (inset in Figure 6[a]) suggests that spectral similarity is likely to be the cause of the false negative. However, a closer examination of the purity and threshold curves as shown in Figure 6(b) indicates that impurities may be present throughout the tail of the peak. This evidence, along with the clear presence of the small peak in the tail, would allow the analyst to conclude that the peak is spectrally impure, despite the overall purity test indicating that the peak is pure.
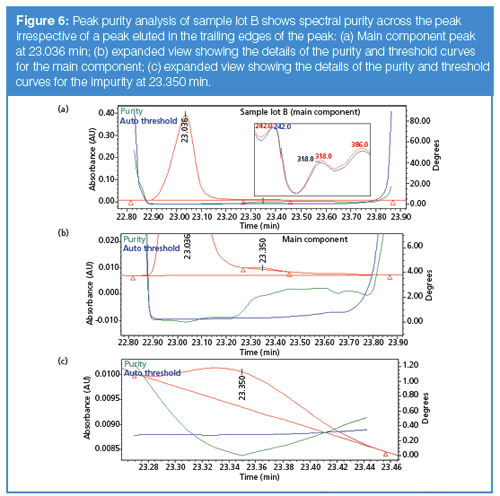
Additionally, the impurity peak shown in Figure 6(b) (that is, the peak at about 23.35 min in Figure 4[b]) fails spectral purity at the leading edge of the peak, with a purity angle of 0.436 and a threshold of 0.272 (Figure 6[c]). This failure is probably because of the impact of the main component on the leading edge of the impurity peak or the presence of other impurities. It is clear in this example that a chromatographer would conclude an impurity is present, because of the chromatographic evidence and the peak purity plot, despite the conclusion of the spectral peak purity test. Further insights may be gained by inspection of the chromatogram for sample lot C shown in Figure 4(c). Here, several impurity peaks are evident in the tail of the main peak, and it is probably the presence of all these impurities (albeit at lower concentration levels) that led to the observed discrepancy between the threshold and purity curves for sample lot B, Figure 5(b). And interestingly, the purity and threshold curves are very close together for sample lot A at 23.35 min (Figure 5[b]), indicating that this impurity is probably also present in this lot, although at a lower concentration, such that both chromatographic and spectroscopic evidence lead to the conclusion that this is a pure peak. The important implication is that if this impurity peak was not as well resolved as in the present case, but was eluted completely underneath the main peak, there would be no chromatographic or spectroscopic evidence that an impurity is present, even for sample lots B and C.
Concluding Thoughts
This discussion of the principles of peak purity assessments using diode-array spectral data highlights both the capabilities and limitations of this type of approach. Although the approach has a tremendous upside because of its low cost and relative ease of implementation, great care must be used especially in the interpretation of results from borderline cases where impurities may be present at relatively low levels.
In a subsequent instalment in this series, we will review the principles of advanced curve resolution techniques, and demonstrate how they can be used to provide more robust analyses of peaks composed of both a major and minor component, but still using diode-array spectral data. Finally, we will review the concept of applying 2D-LC separations to the problem of peak purity assessment, which is particularly useful in cases of coeluted compounds that are isomeric or chiral.
Acknowledgement
We thank Dr. Frank Wolf of Agilent Technologies for many helpful discussions during the preparation of this article.
References
- International Conference on Harmonization, Impurities in New Drug Substances Q3A(R2), (ICH, Geneva, Switzerland, 2006). http://www.ich.org/fileadmin/Public_Web_Site/ICH_Products/Guidelines/Quality/Q3A_R2/Step4/Q3A_R2__Guideline.pdf (accessed 1 December 2017).
- International Conference on Harmonization, Impurities in New Drug Products Q3B(R2), (ICH, Geneva, Switzerland, 2006). http://www.ich.org/fileadmin/Public_Web_Site/ICH_Products/Guidelines/Quality/Q3B_R2/Step4/Q3B_R2__Guideline.pdf (accessed 1 December 2017).
- International Conference on Harmonization, Impurities: Guideline for Residual Solvents Q3C(R6), (ICH, Geneva, Switzerland, 2016). http://www.ich.org/fileadmin/Public_Web_Site/ICH_Products/Guidelines/Quality/Q3C/Q3C__R6___Step_4.pdf (accessed 1 December 2017).
- International Conference on Harmonization, Guideline Elemental Impurities Q3D, (ICH, Geneva, Switzerland, 2014). http://www.ich.org/fileadmin/Public_Web_Site/ICH_Products/Guidelines/Quality/Q3D/Q3D_Step_4.pdf (accessed 1 December 2017).
- International Conference on Harmonization, Pharmaceutical Development Q8(R2), (ICH, Geneva, Switzerland, 2009). http://www.ich.org/fileadmin/Public_Web_Site/ICH_Products/Guidelines/Quality/Q8_R1/Step4/Q8_R2_Guideline.pdf (accessed 1 December 2017).
- N. Chhabra, M. Aseri, and D. Padmanabhan, Int. J. Appl. Basic Med. Res.3, 16 (2013). doi:10.4103/2229-516X.112233.
- S.K. Teo, W.A. Colburn, W.G. Tracewell, K.A. Kook, D.I. Stirling, M.S. Jaworsky, M.A. Scheffler, S.D. Thomas, and O.L. Laskin, Clin. Pharmacokinet.43, 311–327 (2004). doi:10.2165/00003088-200443050-00004.
- H.-J. Sievert and A. Drouen in: Diode Array Detection in HPLC, L. Huber and S.A. George, Eds. (M. Dekker, New York, USA, 1993), pp. 51–126.
- M. Stahl, “Peak Purity Analysis in HPLC and CE Using Diode-Array Technology,” (2003). https://www.agilent.com/cs/library/applications/5988-8647EN.pdf (accessed 1 December 2017).
- “OpenLAB CDS - ChemStation Edition - Understanding Your Spectra Module,” (2017). https://www.agilent.com/cs/library/usermanuals/public/CS_LC3D-SpectraModule_A.01.xx_EN.pdf (accessed 1 December 2017).
- G. Malikin, “Assessing HPLC Peak Purity with Shimadzu Photodiode Detector SPD-M10Avp,” (n.d.). http://www.ssi.shimadzu.com/products/literature/lc/ssiaplc0213.pdf (accessed 1 December 2017).
- “Empower PDA Software - Getting Started Guide,” (n.d.). http://www.waters.com/webassets/cms/support/docs/71500031503ra.pdf (accessed 1 December 2017).
- C.J. Venkatramani, S.R. Huang, M. Al-Sayah, I. Patel, and L. Wigman, J. Chromatogr. A1521, 63–72 (2017). doi: 10.1016/j.chroma.2017.09.022.
Dwight Stoll is the editor of “LC Troubleshooting”. Stoll is an associate professor and co-chair of chemistry at Gustavus Adolphus College in St. Peter, Minnesota, USA. His primary research focus is on the development of 2D-LC for both targeted and untargeted analyses. He has authored or coauthored more than 50 peer-reviewed publications and three book chapters in separation science and more than 100 conference presentations. He is also a member of LCGC’s editorial advisory board. Direct correspondence to: LCGCedit@ubm.com
Sarah C. Rutan is a professor of chemistry at Virginia Commonwealth University (VCU), in Richmond, Virginia, USA, where she has been on the faculty for 33 years. Her research spans a broad range of areas in analytical chemistry and chemometrics, and is currently focused on the development of chemometric methods for improving chromatographic analyses, especially comprehensive 2D chromatography. She has more than 100 publications and numerous presentations on these topics.
CJ. Venkatramani is a senior scientist at Genentech USA and has more than 15 years experience in the pharmaceutical industry. He was the key member of the Genentech technical team instrumental in the successful launch of gRed’s first small molecule Erivedge, leading from development to commercial launch. His areas of interest include multidimensional chromatography and ultra-trace analysis of genotoxic impurities.

New Study Reviews Chromatography Methods for Flavonoid Analysis
April 21st 2025Flavonoids are widely used metabolites that carry out various functions in different industries, such as food and cosmetics. Detecting, separating, and quantifying them in fruit species can be a complicated process.
Quantifying Terpenes in Hydrodistilled Cannabis sativa Essential Oil with GC-MS
April 21st 2025A recent study conducted at the University of Georgia, (Athens, Georgia) presented a validated method for quantifying 18 terpenes in Cannabis sativa essential oil, extracted via hydrodistillation. The method, utilizing gas chromatography–mass spectrometry (GC–MS) with selected ion monitoring (SIM), includes using internal standards (n-tridecane and octadecane) for accurate analysis, with key validation parameters—such as specificity, accuracy, precision, and detection limits—thoroughly assessed. LCGC International spoke to Noelle Joy of the University of Georgia, corresponding author of this paper discussing the method, about its creation and benefits it offers the analytical community.


