Overload or Minor Peak?
LCGC North America
Some possible solutions to the ubiquitous paek-tailing problem are presented by the author.
Peak tailing is nearly ubiquitous for peaks in liquid chromatography (LC) separations. The high-purity silica used by most vendors of reversed-phase columns greatly reduces tailing when compared with materials used in earlier generations of column packings. However, peak tailing rarely is absent, especially when the analyte contains amines or other basic functional groups. If the column is overloaded with sample, any peak can exhibit tailing as well. In still other cases, a small peak eluted on the back edge of a larger peak sometimes can masquerade as a peak tail rather than a separate peak. This last case can be especially problematic in the case of impurity analysis or stability-indicating assays for pharmaceutical products. In such methods, impurity or degradant peaks must be quantified when their peak area is more than 0.1% of the active ingredient. To get an impurity peak large enough for reliable quantification, the main sample component is injected at a very high concentration. For example if the main component has a peak height that is near 1.0 absorbance unit (AU) with a UV detector, an impurity with a peak height of 0.001 AU can be quantified with confidence at the 0.1% level. If the main peak has poor UV absorbance characteristics, if might be possible to inadvertently overload the column and still not exceed the linear range of the detector, so overload is not necessarily related to the visible size of the detected peak.

John W. Dolan
Recently, I taught a class in which a student asked how to tell the difference between a large peak that tailed because a minor component was hidden under the trailing edge and a peak that was overloaded. This led to a discussion that I think is worth sharing, because similar situations can occur whenever one needs to quantify both very large and very small peaks in the same chromatographic run.
Overload
First, let's look at overload, because it is fairly easy to diagnose. When the injected sample mass exceeds the column capacity, badly tailing peaks can arise. In the extreme, these appear to have a right-triangle shape such as that seen in Figure 1a. If overload is suspected, the standard troubleshooting technique is to reduce the mass on column by a factor of 10 or so and examine the resulting chromatogram. If the peak shape improves and the retention time increases, as in Figure 1b, overload is confirmed. It is a good idea to check the method to ensure that the desired maximum sample size does not overload the column. Just make injections twice and half the desired sample size, and see if any changes are observed. If all three injections give similar peak shape and retention, the target sample size should be OK. Otherwise, adjust the sample size and run the test again.
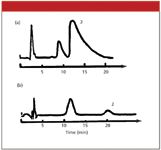
Figure 1: Sample overload: (a) overloaded peaks and (b) increased retention and improved peak shape obtained with a reduced sample size.
What's going on when the column is overloaded? I like to illustrate this with a physical model in which the column is made up of a series of beakers, for example, 250 mL each. If we place a 100-mL sample on the column, it all fits in the first beaker. Then we pick up the first beaker and pour the sample into the second beaker, the second into the third, and so forth down the column. When we reach the end of the column, the sample is still in a single beaker. This is analogous to the normal nonoverload condition in which relatively narrow peak widths are observed. Now consider a 1000-mL sample. It fills the first 250-mL beaker, so we have to move to the second one — it takes four beakers to hold the whole sample. Now to move the sample down the column, we pick up the first beaker, but there is no place to pour it until we get to beaker 5. Then beaker 2 goes in 6, and so forth. As a result, the center of mass of the sample moves more quickly down the column than the nonoverload case. This is analogous to shorter retention times. Also, the sample is broader (four beakers versus one) than the nonoverload case, similar to a broad, tailing peak. Columns aren't made up of beakers, but they do contain active sites in which the chemical interaction responsible for retention takes place. When these sites are busy interacting with a sample molecule, an additional molecule must travel downstream to find an unoccupied active site. This results in broader peaks and smaller retention times, just like our beaker model.
Minor Peaks
The presence of minor peaks that are eluted closely after a large peak can generate a chromatogram that is hard to interpret. An example of this is shown in Figure 2a. The small peak is just 1% of the peak area of the large peak. To make the situation more realistic, I've drawn both peaks with tailing factors of 1.5. The tail of the large peak does not appear to be distorted by the smaller peak hiding under its tail. Figure 2b shows the entire peak envelope for each peak separately (the arrow identifies the peak center of the large peak).
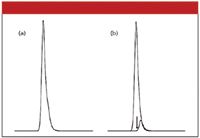
Figure 2: Presence of a minor peak under a peak tail. Peak area ratio 100:1; tailing factor of both peaks of 1.5; retention time difference 0.19 min. Shown are (a) a chromatogram with overlapped peaks and (b) an overlay of separate peaks from (a).
Overload or two peaks?: The overload test is easy, just inject a 10-fold smaller sample and observe the peak shape. In this case, the peak shape would stay the same, although it might be hard to compare the peak tail with a 10-fold smaller peak. I would expand the scale for the second run and overlay the two injections to compare them. The retention time would stay the same for both runs, which would be an easier characteristic to measure in the present case. These observations would support the conclusion that overload was not the root cause of the problem.
One tailing peak or two?: Now that we've ruled out overload, how do we tell if there is a second analyte hiding in the tail? One might use a diode-array detector to measure peak purity. This is a built-in function of the detector software that compares spectra taken at several points across the peak. I have seen very convincing presentations by the detector manufacturers as to the high level of discrimination that can be achieved with this tool. However, every practical worker I ask has had little success using the peak purity parameters to detect the presence of minor peaks in cases such as we have here. One can rationalize why poor discrimination might result. In a high percentage of chromatograms such as this, the chemical structure of the two compounds is very similar — metabolites, degradation products, or other structurally related compounds. After all, the structural similarity can be the reason the compounds are hard to separate in the first place. Compounds of similar structure will have similar UV spectra, so the discriminating power of a spectral ratio is reduced. When the minor peak is a small fraction of the size of the major one, the task gets even more difficult. The present example uses a 100:1 peak area ratio; imagine how hard it would be to discern between two peaks of 1000:1 peak area ratio using spectral ratioing as a tool.
The tail on the large peak in Figure 2 makes visual discrimination of the minor peak especially difficult. As the retention time difference between the two compounds is increased, the ability to visually discern a distorted peak improves. This is shown in Figure 3, where the tail of the major peak obviously is distorted for a 1% minor peak. If the minor peak were only 0.1% of the area of the main peak, it is unlikely that the peak distortion would be noticed.
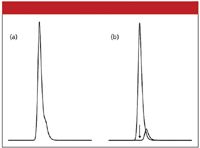
Figure 3: Same as Figure 2, but with a retention time difference of 0.23 min.
MS Detection
A mass spectrometry (MS) detector would be a better choice to determine the presence of a minor peak, such as in Figures 2 and 3. For example, one might take scans across the peak over a range of ±50–100 Da from the mass of the molecular ion. From these data, one should find the presence of peaks at two masses (actually mass-to-charge ratios). Next, extracted ion chromatograms would be generated from the data for each of the two target masses. These would appear to be similar to the individual chromatograms shown in Figures 2b and 3b. Use of peak subtraction techniques and MS–MS data would give even further discriminating power. The problem with this approach, however, is that MS detection rarely is used with stability-indicating or purity assays — UV detection is the mode of choice. The inherent higher variability of MS detectors makes it very difficult to obtain the 1–2% precision and accuracy easily achieved by UV detection for pharmaceutical analysis applications. In my laboratory, we have used LC–MS-MS detection as a backup technique to solve problems, such as peak purity questions, with LC–UV assays. Often, this requires conversion of the method from a non-MS-compatible buffer, such as phosphate, to an MS-compatible one, such as formate or acetate. This can present a whole different set of challenges, because retention times can shift when such method changes are made. I hear people say, "Just use the MS for detection." The solution rarely is as simple as "just" anything.
Collect and Reinject
The problem of discriminating between two closely eluted peaks is made more challenging as the difference in peak areas between the two peaks grows larger. For identification purposes, one can collect peak fractions and reinject them, effectively changing the peak area ratios such that the relative size of the minor peak is easier to see. For example, one could collect fractions of the peak as it is eluted from the detector. A fraction collected before the apex of the main peak in Figure 2b or 3b would contain only the large peak. When these fractions were reinjected, the peaks would be expected to exhibit less tailing than the corresponding chromatograms of Figures 2a and 3a. A fraction collected after the apex of the main peak would be enriched in the minor component. As the relative proportion of the second peak increased, the presence of two peaks in the reinjected fraction should be more obvious. This is shown in Figure 4, where the two chromatograms show the results for equal peak areas for the two peaks with a tailing factor of 1.5. Whereas no visible peak distortion is seen in Figure 2a, the same sample in Figure 4a makes the presence of two peaks obvious when their areas are the same. Increased retention time differences make the result more dramatic, as in Figure 4b for the sample of Figure 3a. Collection and reinjection can be a tedious process, but it can be a very powerful tool to generate evidence to support the presence or absence of a minor peak on the tail of the main peak.
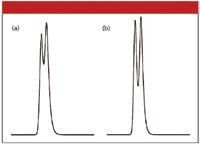
Figure 4: Effect of peak size and visual separation of peaks: (a) same as Figure 2a and (b) same as Figure 3a; both (a) and (b) with 1:1 peak area ratio.
Conclusions
The examples discussed here are for a minor peak that is eluted after a larger peak. The minor peak can have a smaller retention time and exhibit the same problems. However, this generally is less common because nearly every chromatographic peak tails to some extent, and the tail of large peaks tends to mask the presence of minor peaks better than the nontailing leading edge.
The overload test is simple, so if there is any reason to suspect overload, inject a smaller sample to see if the peak shape improves and the retention increases. If only all our problems were so simple!
Comparison of UV spectra may or may not be able to discriminate minor peaks that hide under the tail of a major peak. The use of a mass spectrometer is a powerful tool to find small peaks, but it can be a lot of work if the LC method is not MS-compatible.
Collection and reinjection of peak fractions can be a useful technique to positively identify the presence of a minor peak hiding under the tail of a large peak. Although somewhat tedious, it can help to equalize the peak sizes so that they are easier to distinguish visually.
The suspected presence of a minor peak under the tail of a major peak can be a particularly vexing problem, especially for applications where "all" impurities must be quantified. This month, we've examined several approaches to distinguish between overload and the presence of a minor peak. Hopefully, you've picked up some information that will help you to obtain better results from your LC separations.
John W. Dolan "LC Troubleshooting" Editor John W. Dolan is Vice-President of BASi Northwest Laboratory of McMinnville, Oregon; a Principal Instructor for LC Resources, Walnut Creek, California; and a member of LCGC's editorial advisory board. Direct correspondence about this column to "LC Troubleshooting," LCGC, Woodbridge Corporate Plaza, 485 Route 1 South, Building F, First Floor, Iselin, NJ 08830, e-mail John.Dolan@Bioanalytical.com.
For an ongoing discussion of LC trouble-shooting with John Dolan and other chromatographers, visit the Chromatography Forum discussion group at http://www.chromforum.com.

Study Explores Thin-Film Extraction of Biogenic Amines via HPLC-MS/MS
March 27th 2025Scientists from Tabriz University and the University of Tabriz explored cellulose acetate-UiO-66-COOH as an affordable coating sorbent for thin film extraction of biogenic amines from cheese and alcohol-free beverages using HPLC-MS/MS.
Multi-Step Preparative LC–MS Workflow for Peptide Purification
March 21st 2025This article introduces a multi-step preparative purification workflow for synthetic peptides using liquid chromatography–mass spectrometry (LC–MS). The process involves optimizing separation conditions, scaling-up, fractionating, and confirming purity and recovery, using a single LC–MS system. High purity and recovery rates for synthetic peptides such as parathormone (PTH) are achieved. The method allows efficient purification and accurate confirmation of peptide synthesis and is suitable for handling complex preparative purification tasks.


