Overcoming Fear, Uncertainty, and Doubt in GPC: The Need for an Absolute Measurement of Molar Mass
While conventional calibration for gel permeation (GPC) or size-exclusion chromatography (SEC) is useful, there are inherent disadvantages in this type of analysis that introduce experimental error. This uncertainty may cast serious aspersions on the rigour and utility of the results. Multi-angle light scattering (MALS) detection is quite simple to add to an existing chromatography system and can help overcome the challenges faced with single detector chromatography and conventional calibration-based methods. An alternative separation technique called asymmetric flow field-flow fractionation (AF4) offers tunable, column-free fractionation.
Photo Credit: Mint Images - Paul Edmonds/ Getty Images

While conventional calibration for gel permeation (GPC) or size-exclusion chromatography (SEC) is useful, there are inherent disadvantages in this type of analysis that introduce experimental error. This uncertainty may cast serious aspersions on the rigour and utility of the results. Multi-angle light scattering (MALS) detection is quite simple to add to an existing chromatography system and can help overcome the challenges faced with single detector chromatography and conventional calibration-based methods. An alternative separation technique called asymmetric flow field-flow fractionation (AF4) offers tunable, column-free fractionation.
Gel permeation chromatography (GPC) and size-exclusion chromatography (SEC) are widely used techniques for the analysis of polymer molecular weight. In this technique, a sample is passed through a separation column and fractionated into differing molecular weight species. After exiting the column, the sample then travels through one or more detectors where some characteristic is measured. Traditionally, the downstream detector is either a refractive index (RI) detector or an ultra-violet (UV) absorption detector.
In order to be useful for calculating molecular weights, a column or column set must be calibrated using well-characterized standards where each species ideally has a narrow molecular weight distribution and the chosen standards span a broad range of molecular weights. Because a typical calibration curve has 10â12 points and can be time-consuming to collect, standards are often injected as mixtures with 3â6 species in a cocktail. In column calibration, the apex of each eluting peak is selected from the concentration detector, and the known molecular weight is plotted versus retention time. In universal calibration, a viscometer is added to the chromatography setup, and the intrinsic viscosity of the standard is now plotted along with known molecular weight to generate a calibration curve that may be more generally applicable. There are at least two fundamental assumptions for GPC/SEC methods: 1) The polydispersity within each elution volume slice is negligible and 2) the elution time for a species is an accurate predictor of molecular weight when compared to a calibration curve. However, are these assumptions always true? If not, under what conditions do the assumptions fail?
Described below are several points at which column and universal calibration are challenged, and they illustrate that a method of absolute measurement is required. A multi-angle light scattering detector (MALS) can be plumbed in-line with a high performance liquid chromatography (HPLC) system and concentration detector (typically UV or RI) to provide this type of measurement.
Light scattering is an absolute technique, meaning that it does not depend on any calibration standards or calibration curves. The fundamental light scattering equation is:
where the intensity of scattered light at an angle θ is directly proportional to the product of the molar mass M, the concentration c, the square of the specific refractive index increment dn/dc (a constant for each sample), and an angular factor P(), which equals 1 at = 0. The absolute intensity of scattered light extrapolated to = 0 is used to calculate molecular weight, and the variance of this intensity with angle is used to calculate the rms radius of the sample. Other information can be gleaned from the data such as analysis of copolymers and polymer branching ratio.
The most recent major advance in polymer characterization is the applicability of ultrahigh-pressure liquid chromatography (UHPLC) to polymer separations. As pointed out by Bouvier and Koza,1 UHPLC offers greater resolution and throughput than traditional HPLC methods. Because of the short run times, the volume between peaks is greatly decreased, and the effects described below may be exaggerated, emphasizing the need for MALS detector that makes an absolute measurement.
Potential problems with a column or universal calibration include:
• Poor fractionation, resulting from inappropriate column conditions or interaction with the stationary phase, will result in overlap and co-elution of different molecular weight species that will be assigned incorrectly by calibration curves. MALS will report a weight-average molar mass and size for each time point as sample passes through the flow cell, so high-quality data are dependent on good separation. However, an increase in polydispersity can be obtained from MALS data as evidence of co-elution.
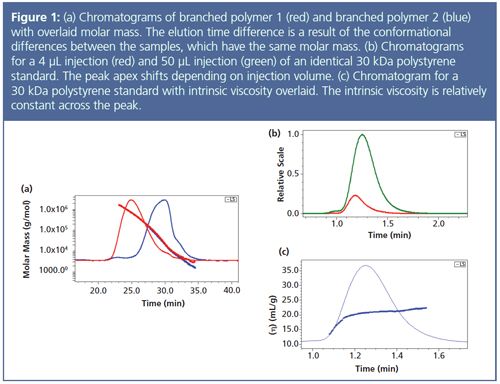
• A well-characterized standard may not be available that matches the sample of interest; this mismatch will result in molecular weight error as a result of density or conformation differences.2 For example, two species of the same molar mass but different sizes will elute at different times (Figure 1[a]). Calibration will assign different molecular weights, but MALS will correctly measure molar mass regardless of conformation or retention time. Since MALS measures rms radius, it may also give insights into the cause of different elution times.
• Changing the injected mass of the sample can change the apex of eluting species, which will change the reported molecular weight according to a calibration curve. In Figure 1(b), an injection of 4 μL is compared to an injection of 50 μL with a clear shift towards longer time (t ~ 0.7 min.). MALS is insensitive to elution time and thus reports the same molecular weight for both peaks.
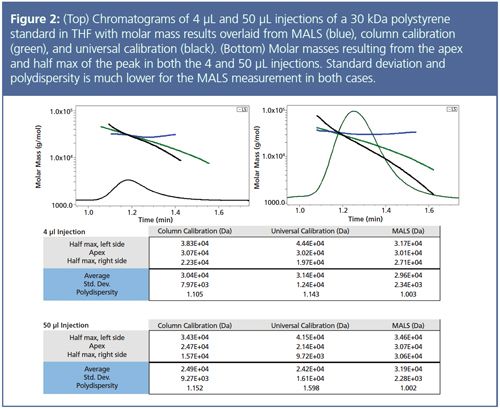
• Both column calibration and universal calibration dictate that species eluting at a later time and later volume must be of lower molecular weight because of the negative slope of the calibration curve; this axiom is inherent in the experimental method. However, peaks in a chromatogram often have a fixed molecular weight across the entire peak width and time. For samples such as a narrow 30 kDa standard, the molecular weight is constant, which also means that the intrinsic viscosity is consistent across a peak (Figure 1[c]). However, because the product of intrinsic viscosity and molar mass must be decreasing (the universal calibration curve has a negative slope), then molecular weight must decrease with elution time. In other words, the inescapable mathematical framework of column calibration is a cause of error in the measurement. Figure 2 overlays calibration and MALS measurements for a narrow 30 kDa polystyrene standard and shows that the molar mass measured by MALS is consistent across the peak. In contrast, the molar mass result from calibration slopes sharply downwards and results in significant error, particularly on the right side of the peak.
• Copolymers have a different elution time than any of the corresponding pure polymers.3 Copolymer standards are usually not available, and the copolymer composition will vary across a peak so that no standard would be adequate for comparison.


With so many possible ways to go wrong in column or universal calibration, why is the technique still widely used in so many laboratories? Firstly, it has been the accepted analytical technique for a long time and many laboratories are hesitant to change. Historical data may have been collected with single-detector calibration methods, so modern data must be compared to historical results. Secondly, standard operating procedures (SOPs) and protocols may have been written with this method, and they are difficult to change, especially if errors in molecular weight results are not easily detectable by the analytical equipment already installed in a laboratory. Lastly, it may be assumed that the technique works fine if the chosen standards are very similar or identical to the analyte of interest. However, the results above clearly indicate that an absolute measurement of molecular weight is needed to overcome the uncertainty of a previously established curve.
Fractionation by AF4
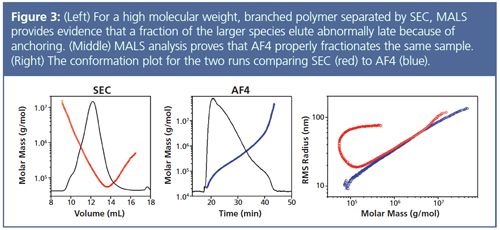
One common source of error in GPC/SEC not yet mentioned is interaction with the column packing material. In some cases, it is not possible to find a suitable column either because of the specific chemistry of the sample or because the molecular weight range is challenging. Another situation that arises frequently is that polymer chains “anchor” or entangle in the pores of the column packing material causing high-molecular-weight large species to elute at an unexpectedly late time in the chromatogram. This effect may mean large and small species will co-elute, causing the researcher to assign an incorrect molecular weight to a significant percentage of the sample if depending on calibration curves. Equally concerning, entanglement will make proper polymer branching analysis impossible. These issues can be particularly pronounced for high molecular weight, highly branched polymers and show up most obviously in the conformation plot of rms radius vs. molecular weight as a characteristic upswing. The common, emblematic shape in the far right graph in Figure 3 is evidence of a branched sample and is an artifact from the poor SEC separation.4

Asymmetric flow field-flow fractionation (AF4) is a technique that, similar to GPC/SEC, fractionates samples according to hydrodynamic diameter; however it does not have a stationary phase. Instead, the sample is introduced into a flow channel consisting of two parallel plates, where one facet comprises a porous membrane without any packed stationary phase. The sample is forced against the membrane by a cross-flow but then allowed to diffuse away from the membrane to a different height within the channel. The flow profile along the channel’s length is parabolic, meaning that particles higher up in the channel will be influenced more by the faster flow. Smaller species diffuse more quickly than large particles and so end up farther from the membrane where the flow velocity is greater; in AF4, small particles elute first followed by large particles. Because there is no stationary phase, the possibility of polymer anchoring is eliminated. Thus, the conformation plot for AF4 (Figure 3, right) shows a straight line, which not only indicates good separation, but will also allow proper branching analysis.
Conclusions
In conclusion, while single-detector calibration experiments have proven useful, there are significant errors associated with the analysis whether column calibration or universal calibration is used An absolute measurement with MALS is a more accurate and data-rich analysis, and it allows flexibility to change run conditions without having to re-generate a calibration curve. MALS detection also increases experimental throughput by eliminating the calibration steps. Adding MALS detection to an existing GPC setup is straightforward and helps eliminate the fear of uncertainty and doubt in experimental results. Even greater benefits may be achieved for certain problematic polymers by replacing the GPC column with AF4.
References
- Edouard S.P. Bouvier and Stephan M. Koza, TrAC Trends in Analytical Chemistry63, 85â94 (2014).
- M. NetopilÃk and P. KratochvÃl, Polymer44, 3431â36 (2003).
- B. Trathnigg, Size Exclusion Chromatography of Polymers. Encyclopedia of Analytical Chemistry, R.A. Meyers, Ed. (Wiley, Chichester, UK, 2006).
- S. Podzimek, T. Vlcek, and C. Johann. J. Appl. Polym. Sci.81, 1588â94 (2001).
Mark W. Spears Jr graduated with a Bachelor of Science in pre-medicine from Bob Jones University in 2008 and completed his PhD work in analytical chemistry at Georgia Tech in December 2014. Mark’s graduate work centred on the synthesis and applications of acrylamide-based polymer nanoparticles known as microgels. He also earned a Management of Technology Certificate from the Scheller College of Business in 2014. Mark joined Wyatt Technology in 2015 where he is Regional Manager and Application Scientist for the Southeastern United States. Mark is dedicated to providing the best ownership experience possible for Wyatt instrumentation, and he enjoys helping to advance research in many areas of study.

Evaluating Body Odor Sampling Phases Prior to Analysis
April 23rd 2025Researchers leveraged the advantages of thermodesorption, followed by comprehensive two-dimensional gas chromatography coupled to time-of-flight mass spectrometry (GC×GC/TOF-MS), to compare and assess a variety of sampling phases for body odor.

.png&w=3840&q=75)

.png&w=3840&q=75)


.png&w=3840&q=75)


.png&w=3840&q=75)


