Nontargeted Screening for the Verification of Allergenic Ingredients and Perfume Authenticity by GC-ecTOF-MS
Fraudulent products are ubiquitous in all markets. Besides the financial aspect, a major issue regarding products adulteration for society and the environment is the missing regulation and control of these goods. Therefore, harmful and toxic compounds in fraudulent products may become a risk for human health and the environment. Even small amounts of toxic substances can still have damaging effects. Thus, a sensitive and reliable identification of compounds is needed. Novel technologies are necessary to use identifying and preventing fraud and related risks. Goods from the food, flavor, and fragrance markets often contain volatile organic compounds (VOCs), which include most allergenic fragrances. For the detection and identification of these substances, gas chromatographic separation hyphenated with high resolution mass spectrometry (GC–HRMS) is an ideal instrumental technique. GC–simultaneous electron and chemical ionization (ec) time-of-flight (TOF)-MS generates various types of information via simultaneous ec–HRMS. Advantages are given for target, known unknown, and unknown unknown data analysis by generating various types of ions within one single experimental GC–MS run. In this study, the experimental nontargeted screening approach and corresponding data analysis workflows—simultaneously using molecular ion information and structural information—are presented for the molecular identification and authenticity verification process from a brand perfume using GC–ecTOF-MS.
For detecting and identifying volatile organic compounds (VOCs), gas chromatography (GC)–high resolution mass spectrometry (HRMS) depicts an ideal instrumental technique. Electron ionization (EI) at 70 eV is the ionization technique of choice for targeted analysis using GC–MS because of its sensitivity and reproducibility, along with the availability of large spectral libraries. EI relies mostly on the in-source generation of specific fragment ion patterns using high energetic electrons. The received mass spectra are further used for the compound identification via a direct comparison with stored library spectra from reference compounds, as for example in the National Institute of Standards and Technology (NIST), Environmental Protection Agency (EPA), and the National Institute of Health (NIH) Mass Spectral Library (1). EI-generated data is suited well for targeted analysis and, with limitations, for suspect screening approaches. Nontargeted screening (NTS) strategies using EI–MS data is sometimes possible, but even then can be challenging.
NTS is the analytical strategy to determine compounds utilizing MS (mainly via their molecular ion mass) without prior knowledge about these compounds. This strategy is constantly gaining interest because of the capability of characterizing complex samples and identifying unknown or unexpected compounds (2). Unfortunately, typical 70 eV EI alone is often insufficient to generate enough information for NTS approaches because of three reasons: 1) a compound library search is only sufficient if the generated mass spectrum and the occurring fragments are characteristic enough for high reliable identification of a compound; 2) the use of library searches does require the compounds of interest to be available in the spectral library; and 3) the usage of 70 eV electrons leads to excessive fragmentation and often the information on the molecular ion of the compound as high impact evidence for identification is lost.
The first two reasons can be overcome by using additional tools to perform an EI-mass spectra-based library search—such as compound library searches (3), hybrid searches (4) and simulation or prediction tools (5). It should be noted that for all of these tools the molecular ion information is essential. Thus, the generation of such molecular ion information by a softer ionization technique is required. Various soft ionization techniques are available for the GC–MS coupling—for example, atmospheric pressure photon ionization (APPI) (6), cold EI (7), and atmospheric pressure chemical ionization (APCI) (8). Furthermore, new generation chemical ionization (CI) sources enable soft and controlled analyte ionization via ion–molecule reactions. The latter offers multiple advantages that encompasses a broad range of selectivity and high sensitivity (9).
Common GC–MS setups usually require two sequential GC runs to generate molecular ion information via soft ionization in addition to structural information via GC-EI-MS. Running two GC–MS experiments is time consuming, and the subsequent data alignment between EI and CI data is highly complex and error prone. To overcome this, the simultaneous electron and chemical ionization (ec) time-of-flight (TOF) (referred to as ecTOF) MS instrument was launched in 2021. This instrument operates an EI and a CI source within one GC run using the same single mass analyzer for monitoring simultaneously. In addition, the TOF instrument offers the advantage of accurate mass measurements used for the precise sum formula calculations, which are not possible with common quadrupole setups.
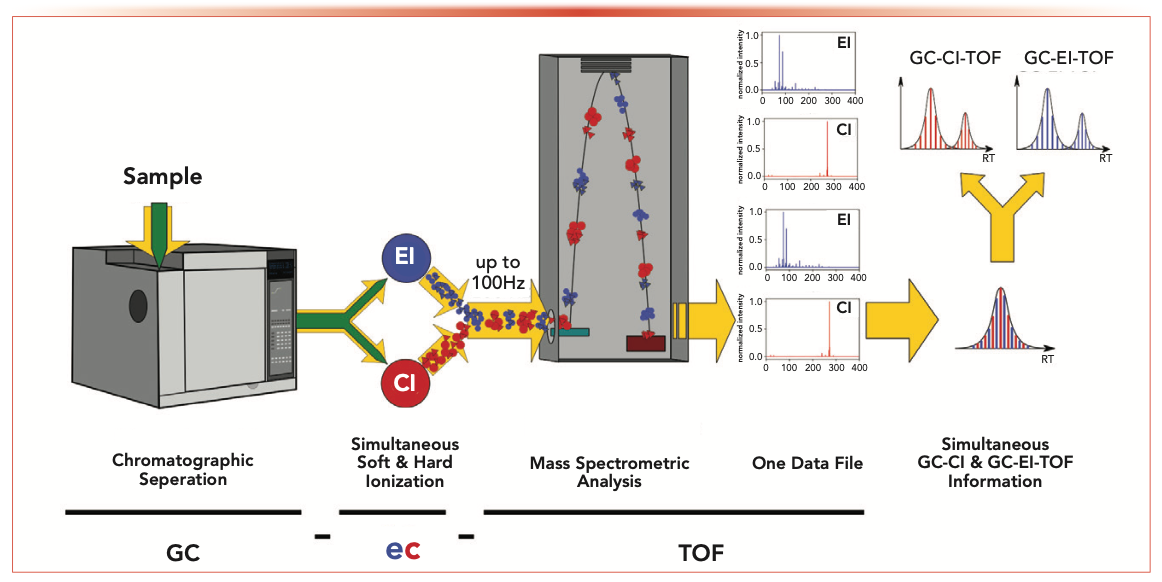
Figure 1 depicts the GC-ecTOF instrument and its principle of operation. After the chromatographic separation of volatiles by GC, the analyte-containing effluent is split 1:1; subsequently, each half is guided to one of the two ionization sources. This way, both ionization sources are fed the same GC effluent simultaneously. Both ionization sources are operated continuously and both types of ions (red and blue in Figure 1) are guided on their specific ion pathways towards the TOF mass analyzer. By using fast switching ion optics (up to 100 Hz), the type of ions that are led into the analyzer for detection is alternated. Therefore, EI and CI information is acquired quasi-simultaneously (10). Because of the use of a TOF mass analyzer, complete mass spectra are continuously generated that do not require preselection of target analytes.
FIGURE 1: A schematic showing the principle of operation of a GC–ecTOF-MS system.
The present study describes the benefits of this new combined dual ionization approach for analyzing an original perfume and two “scent-twins.” This application shows how EI- and CI-generated mass spectrometric nontargeted screening data is perfectly aligned and used to identify known and expected compounds in samples. Furthermore, the approach allows for the screening of unexpected or even unknown components using statistical approaches such as principal component analysis (PCA).
Materials and Methods
Analytical System, Chromatographic Method, and Data Analysis
The chromatographic separation was executed using an Agilent 7890A GC (Agilent Technologies) instrument and an implemented RXI-5 MS semi-polar GC column (30 m, 0.25 mm, 25 μm; Restek). The separation was performed according to following program: the carrier gas flow was set to 1.2 mL/min of helium (99.49% helium, Carbagas). After 1 μL splitless liquid injection (injector temperature: 250 °C), the oven temperature was initially held for 4 min at 40 °C, followed by a temperature ramping of 10 °C/min to 250 °C. The temperature was further increased to 320 °C with 20 °C/min. The final temperature was then held for 2 min. The column outlet was connected via a heated transfer line setup (280 °C) and the GC effluent was led towards a 70 eV EI (TEI 280 °C) and a helical resonator plasma (HRP) medium pressure chemical ionization source. The HRP source was operated as described by Bräkling and others (9). Both ionization sources were operated in parallel on an ecTOF R instrument (Tofwerk). For the VOC analysis, a mass range of 1–450 Th was chosen. In this study, H3O+ and NH4+ were used as reactant ions for the chemical ionization. If the reactant used for the specific experiment varies from H3O+, it is stated in the “Results” section. The TOF analyzer used for these experiments is providing a mass resolution of about 4500 and mass accuracy of <5 ppm mass error for the mass spectral detection. During the acquisition, the EI and CI data is stored within one data file but can be handled separately or in combination for post-processing, respectively.
The AnalyzerPro XD (SpectralWorks) and the NIST20 library were used for data post-processing. Chromatographic deconvolution was applied for peak identification in post-processing via the AnalyzerPro XD. The AnalyzerPro XD can handle and display both EI and CI data within one processing step. Within the processing method, it was chosen to directly report components (binned and aligned features) in the summary report. These components were then used in further data analysis steps. Target libraries were generated via target component analysis from AnalyzerPro XD using the retention time (tR) as well as EI and CI mass spectral information for various allergens within standard mixtures. It was predefined that a confidence of 70% is reached using a 0.1 min tR window and 650 as mass spectral forward and reverse match factors. Based on experience a minimum level of confidence >80% had to be reached in the AnalyzerPro XD target library search for each compound identification in EI and CI, respectively. For the retention index (RI) calculation (11), An- alyzerPro XD offers a specific Retention Indices tool that interpolates RI values based on the standard analytes (that was an alkane mixture in this study) with defined RIs. The Sequence Results viewer in the AnalyzerPro XD was used for statistical analysis of the data via principal component analysis (PCA) or volcano plots. Blank measurements were carried out and reviewed via AnalyzerPro XD. Overall, only a small number of peaks with very low intensities were detected in the blank measurements. Because it was not in high relevance for the presented study, the blank measurements and corresponding components were not further discussed here.
Materials
The original brand perfume was purchased in an official perfumery shop. Two “scent-twins” of the original were ordered at different online shops. These scent-twins are sold having different names to the original but officially imitate its fragrance profile. All perfume samples were diluted (1:100) in hexane (>99.9%). Each of the three purchased perfumes was analyzed in triplicate using the method described above. Three commercial fragrance allergen standard mixtures (Restek), including 32 allergens, were analyzed and used for the generation of the target library. A C7-C40 alkane standard mix (Merck & Cie) was used for the RI estimation.
Results
Perfume Analysis Overview
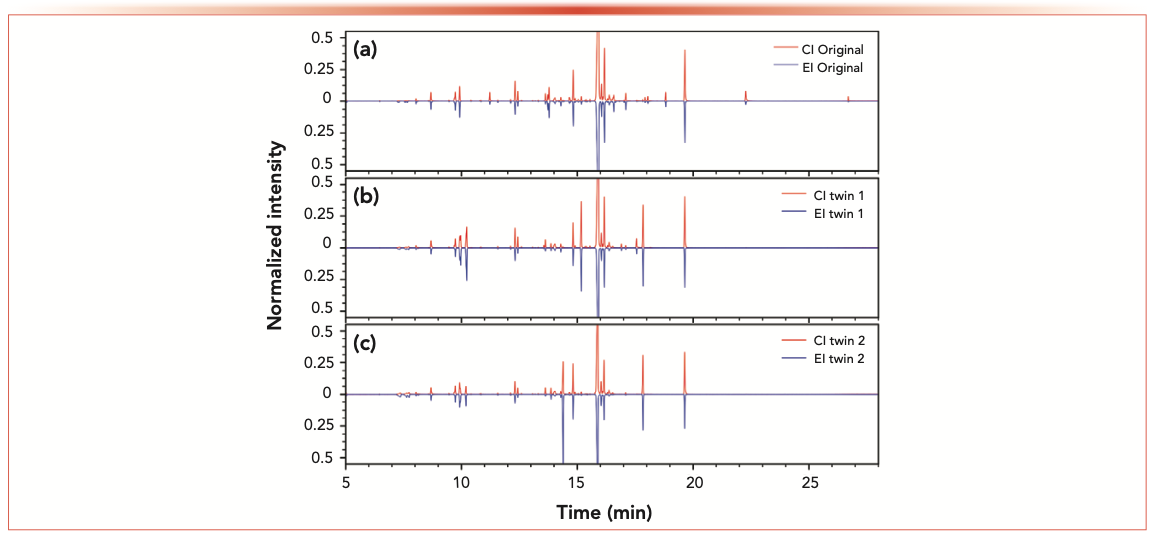
Figure 2 presents three head-to-tail plots of ion chromatograms for the simultaneously generated EI and CI HRMS data of each of the perfume samples, respectively. Because scents of the original and the two twin perfumes were claimed to be highly comparable, the molecular composition of all samples was similar. However, significant differences are detected in the EI and CI traces. These were measured using an ecTOF-MS instrument in positive ion mode. The instrument was operated specifically to create a nontargeted screening type of measurement. Consequently, the data can be post-processed using the following three strategies: the targeted analysis, known unknown analysis, and unknown unknown analysis. These data analysis approaches (for identification and/or statistical use) are discussed in the following sections using the complementary CI and EI data.
FIGURE 2: Head-to-tail display of CI (red) and EI (blue) generated ion chromatograms for (a) the original brand perfume, (b) scent twin 1, and (c) scent twin 2.
Targeted Analysis of Indicated Allergens
The lists of ingredients of all samples included European Union (EU)-wide regulated contact allergens. Preferably, these should directly be identified using targeted analysis if included in both the sample and the allergen standards. Thus, conducting a comparison of several detected components with the relevant entries in the target library is required. The target library for this study was generated using retention times and the EI and CI mass spectra of the compounds from all allergen reference standards (see the “Materials & Methods” sections). The indicated allergens for the original and the scent-twin samples can be found in Table I.
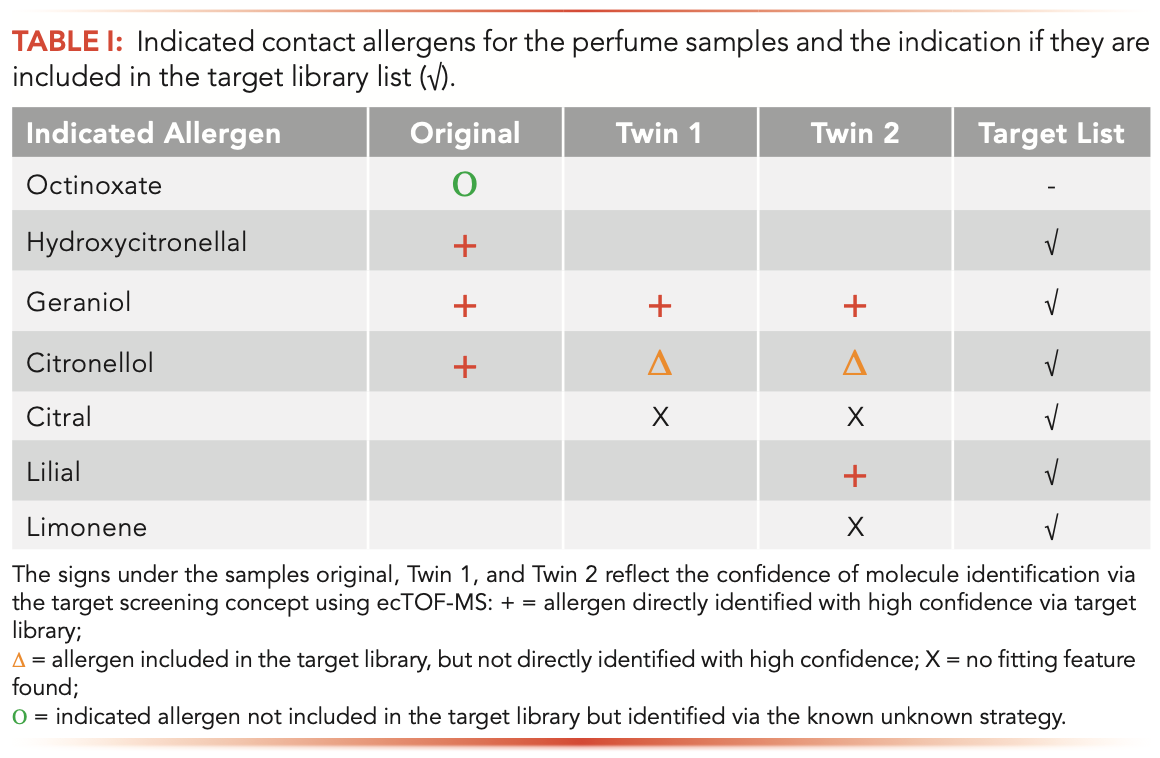
Three of the ingredients indicated allergens (hydroxycitronellal, geraniol, and citronellol) that were available as reference standards could directly be identified in the original perfume. The highest level of confidence was reached using both ionization methods. CI- and EI-generated mass spectra as well as retention time were highly comparable with the reference standard (see the “+” in Table I). One allergen out of three (geraniol) was identified for twin 1 as well, and two out of five (geraniol and lilial) were identified for twin 2. The allergens identified in the original perfume are highlighted in the CI and EI chromatograms of the original perfume in Figure 3 as red traces. The grey traces in Figure 3 depict all ion chromatograms found in the CI mass spectra. The highlighted trace in blue can be seen in the EI chromatogram and reflects the total ion chromatogram.
FIGURE 3: Head-to-tail display of EI (tail) and CI (head) chromatogram of the original perfume analysis. Gray traces indicate CI chromatograms, and the blue trace indicates a summed EI chromatogram observed. Allergens identified via target libraries are depicted as red traces and analyte names are validated. Compound names at green traces are suggested and data evaluation was done regarding the known unknown section of this article.
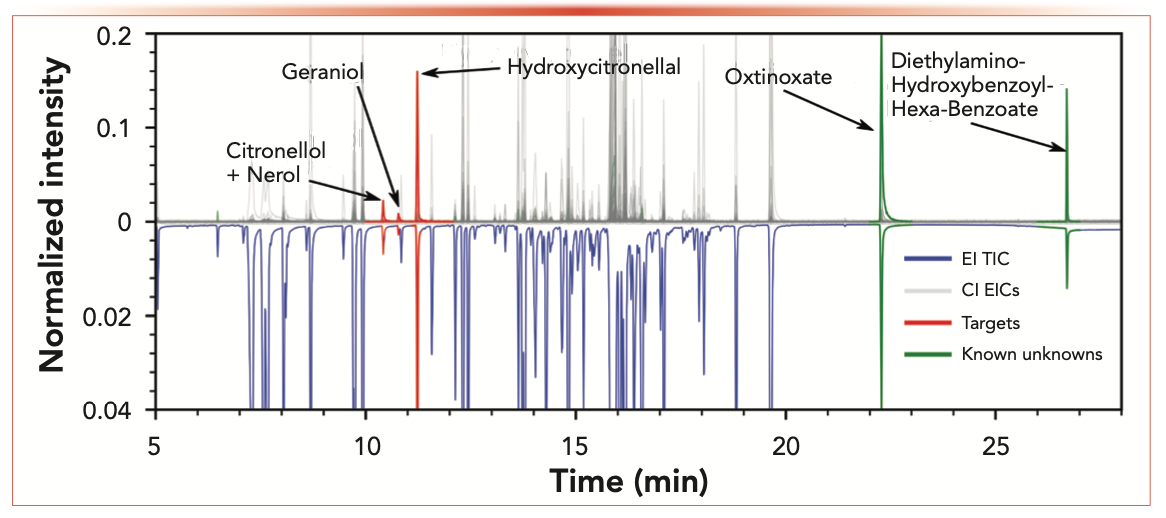
Using the target library, hydroxycitronellal and geraniol could be identified in the original sample with both types of ionization, with the AnalyzerPro XD given levels of confidence of 98% (CI) and 98% (EI), and 88% (CI), and 98% (EI), respectively. Lilial was identified in the same way, which was only indicated for twin 2 and found with levels of confidence of 97% (EI) and 95 % (CI).
Previous studies have shown that citronellol and nerol are coeluted, they are not separable on a non- or semi-polar GC column (12). Because of this coelution, the levels of confidence for identification via a target library comparison drop to 88% for the EI and <80% for the CI in the original perfume. Both scent twins had the same coelution and neither via EI nor CI an identification certainty >80% could be reached. Furthermore, the NIST library search results did not show citronellol within the first 10 hit suggestions. In the given samples, nerol was found to be the more dominant compound. Because of the large difference in peak intensity levels, citronellol does not significantly contribute to the mass spectrum. Therefore, nerol dominates reasonable fragment pattern library hits. However, molecular masses of citronellol and nerol differ by two mass units. Both molecular ions were found in relatively low abundance in the H3O+ generated CI mass spectra. Therefore, the [M+H]+ sum formula for both could be calculated with a mass error <3 ppm. Additionally, for a better level of confidence, molecular ion signals can be increased using NH4+-cluster-CI. Such additional accurate mass analysis experiment using the NH4+-molecular cluster ion signals strengthened the identification confidence of both citronellol and nerol, which clearly reflects the availability of different CI reactants that can greatly improve the compound identification process.
These results show the limitation of a common targeted EI-only identification process used in most standard protocols, such as Deutsches Institut für Normung (DIN) and International Organization for Standardization (ISO) norms (as for example ISO 16000 or ISO 12219). Thus, the additional information by CI-formed ions is shown to be essential and needs to be included in forthcoming standard protocols if nontargeted screening is required.
Another example of the ion sources complementarity is shown with citral and limonene. Here, the absence of compounds can clearly be proven using this type of analysis. Citral and limonene—stated as ingredients of both scent-twins (see Table I)—were not detected in twin 1 or in twin 2, respectively. In detail, no feature could be detected at a corresponding RI via CI or EI mass spectra. Using this analytical approach, the LODs of the studied allergens are estimated to low pg on the column ranges. These LODs correspond to sample concentrations in the range of μg/g. This concentration range is multiple orders of magnitude lower than the concentration described in the EU cosmetics directive (13) for which the presence of allergens must be indicated in the list of ingredients.
Reasons for this finding could be that these allergens were wrongly indicated for the twin perfumes or their concentrations varied strongly between different charges of the samples, which illustrates that certainties of molecular absences can also be increased using the ecTOF instrument.
Known Unknown Analysis of Indicated Substances
In a further process of interpreting the simultaneously generated EI and CI data—the so-called known unknown data analysis process—was applied (14). In this strategy, nontargeted data was used for external analytical and compound database searches to find expected and suggested compounds based on observed features as no reference standard was available at this point.
Octinoxate (C18H26O3) was indicated on the list of ingredients as an allergen for the original perfume but was not present in the applied reference standard mixtures. The automated NIST library searching in the AnalyzerPro XD of the observed component at 22.3 min was identified by NIST as the cis-isomer of octinoxate. A match factor of 909, a reverse match of 913, and a probability of 75% was achieved. Corresponding EI and CI mass spectra of the mentioned component are shown in Figure 4a as a head-to-tail display. The accurate CI mass analysis of the [M+H]+ corresponding feature indicated a mass error of <2 ppm for octinoxate (C18H27O3+). Additionally, the visual comparison of measured (red peaks) and calculated (green lines) [M+H]+ isotopic pattern distribution as depicted in Figure 4b was used to increase confidence in the molecular ion information. Octinoxate itself was listed as the second entry in the NIST fragment spectra library hit list with a match factor of 889, a reverse match factor of 898, and a probability of 22%. However, the RI that was generated via the alkane standard analysis of the observed component (2326) favors octinoxate (RI 2339) compared to the cis-isomer (RI 2152) (favored by the NIST library search). In the case of octinoxate, EI, CI, and chromatographic information together lead to high class identification certainty of the suspected compound.
FIGURE 4: Head-to-tail display of EI (blue) and CI (red) mass spectra from original perfume sample for (a) the chromatographic peak at 22.3 min, and (b) the overlay of the measured and calculated [M+H]+ isotopic pattern distribution for C18H27O3+ (suggested as octinoxate). Head-to-tail display of EI (blue) and CI (red) mass spectra from original perfume sample for (c) the chromatographic peak at 26.7 min, and (d) the overlay of the measured and calculated [M+H]+ isotopic pattern distribution for C24H32NO4+ (suggested as diethylamino-hydroxybenzoyl-hexyl-benzoate).
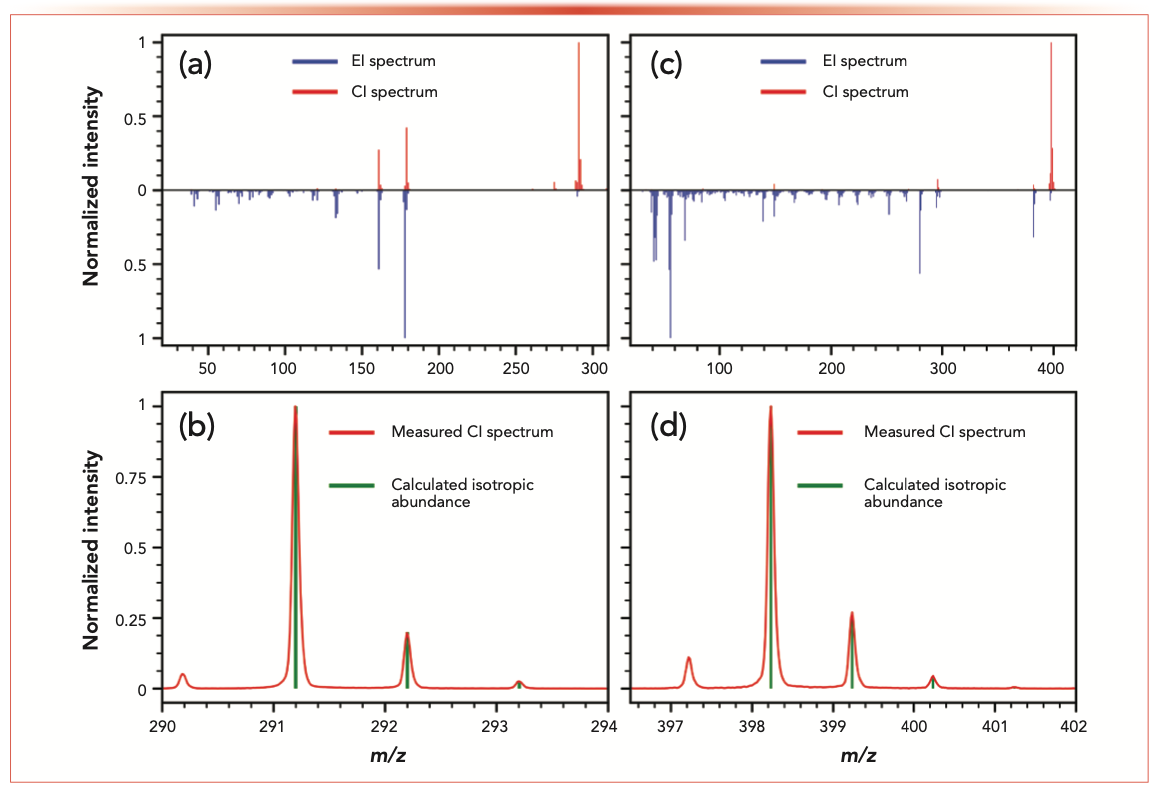
Diethylamino-hydroxybenzoyl-hexyl-benzoate (C24H31NO4) was also indicated as an ingredient in the original perfume. Because no reference standard was available in the laboratory at that time, this compound was also treated as a known unknown. Because no direct evidence on diethylamino-hydroxybenzoyl-hexyl-benzoate was found via the automated NIST library search, this compound was used as an example of how a known unknown can be handled via a “NTS approach” or a “suspects screening approach.”
Coming from an NTS approach of simultaneously generated CI and EI GC–MS data, a component is detected at a tR of 26.7 min (see Figure 3 green trace). This component is only found in the original perfume and not in the twin samples, pointing out an interesting compound for product fraud identification. Diethylamino-hydroxybenzoyl-hexyl-benzoate is a highly stable and antiallergenic UV-filter; therefore, it is very common in high quality cosmetics and fragrances.
The CI mass spectrum of this component shows a very intense signal at m/z 398.2315. The accurate mass analysis of this signal indicates a sum formula of C24H32NO4+ with <3 ppm accuracy. Through knowledge of the CI processes, a protonated molecule is expected. The isotopic pattern shows to be a great fit for this calculated sum formula (see Figure 4d). At this point, additional evidence could be collected via the usage of the calculated sum formula in compound databases on chemical platforms, such as the EPA Chemical Dashboard (15), Forident (3), or others.
The NIST library search of the corresponding EI data provided low match and reverse match factors (<700) along with a maximal probability of <20%, indicating the absence of this compound in the library. However, accurate mass EI fragment information can still provide structural information for additional prediction tools, such as Alpinac (5) and NIST hybrid search (4).
Coming from a suspects screening approach, diethylamino-hydroxy-hexyl-benzoate can be easily found targeting the [M+H]+ within the CI chromatogram because it is also indicated as an ingredient. As mentioned earlier, only one feature was fitting to the [M+H]+ ion of diethyl-amino-hydroxybenzoyl-hexyl-benzoate at the tR of 26.7 min (see Figure 3 green trace). It should be noted that this first step in a compound search (via molecular ion information) is only possible if the data generation is based on a full nontargeted screening approach with a soft ionization source. In case a component is found and has a perfect alignment of EI and CI data, it directly reveals the corresponding EI mass spectrum of the CI peak that is focused on (see Figure 4b). In the following steps, the data analysis would follow the previously described scheme: CI accurate mass analysis for sum formula calculation, isotopic pattern comparison, library searches of the corresponding EI mass spectrum, usage of prediction tools, and databases on chemical media for further collection of evidence (a perfect example showing how only the molecular mass information generated via CI can guide the identification of an expected compound in the absence of NIST library data).
Nontargeted Screening Data Used for Statistical Unknown Analysis
All signals within the chromatogram in Figure 3 (grey, blue, red, and green traces) can be used within further evaluation workflows because targeted and known unknown data analysis are also based on the nontargeted screening generated analytical data. Because of the larger number of total features that can occur in a sample, three strategies are mainly followed during the NTS data processing and analysis: 1) identify unknown unknown substances in a specific single sample (additionally to targets and known unknowns); 2) characterize relevant features or components found as similarity or difference between samples; and 3) differentiate features of samples via statistical approaches that describe further molecular reflecting questions.
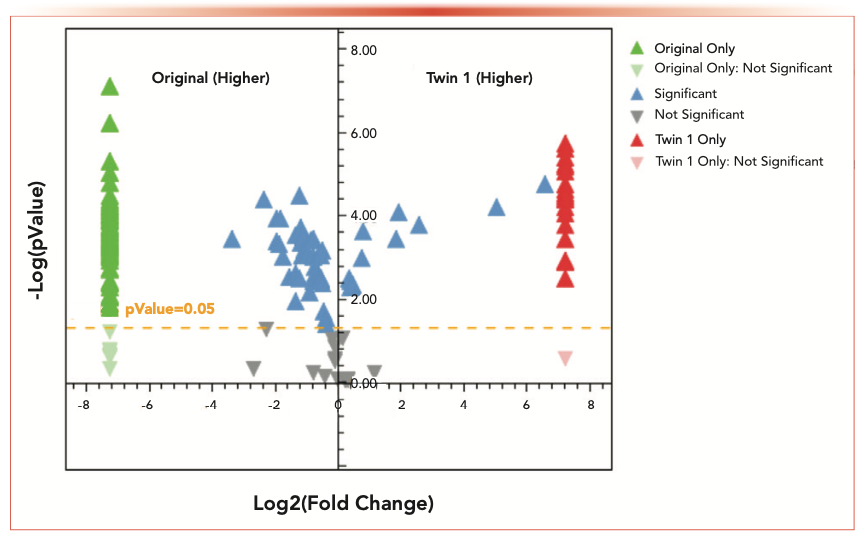
For instance, within this study, the authenticity of perfumes and their molecular differences are of high interest. Differences between single samples can easily be visualized using statistical approaches, such as volcano plots. The volcano plot in Figure 5 visualizes the relative intensity of each component measured in the original and the twin 1 perfume. In addition to the components found in both samples (blue triangles), the components that were found in just one of each sample are highlighted red or green, respectively. Components with potential interest for authenticity characterization can subsequently be transferred into the chapter described above into known unknowns (without reference) and into target analysis (with reference); it can also remain in the authenticity interpretation as a significant unidentified component.
FIGURE 5: Volcano plot for the direct comparison of the original perfume and the Twin 1 sample.
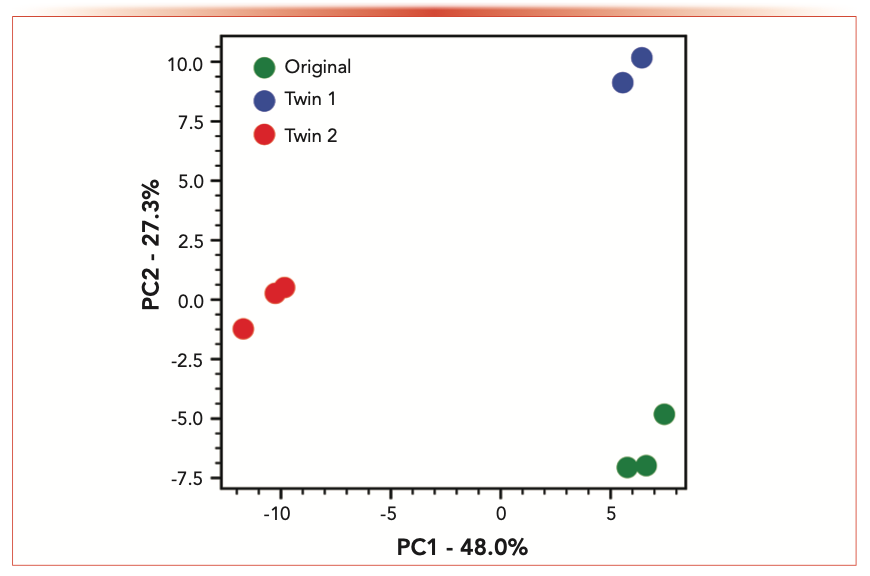
PCA is a useful tool in providing a first indication of differences between samples using NTS data. The three samples are clearly separated along PC1 and PC2 with the replicate runs for each sample clustering together (Figure 6). Further NTS measurements of other perfumes mimicking the original perfume can easily be compared to the original sample in the future as NTS analysis allows a retrospective handling of data.
FIGURE 6: Principal component analysis (PCA) for the different samples using the combined data measured via EI and CI.
Conclusion and Outlook
The combination of EI- and CI-generated MS data used in nontargeted screening analysis is highly effective for targeted, known unknown, and statistical feature data evaluation. Special benefit of CI data in addition to EI spectral information (here monitoring the adulteration of perfumes) was provided for the identification process of compounds not available in libraries and in coeluting compounds.
Future development will focus on how to better implement prediction tools and databases on chemical media for the NTS analysis by exploiting the simultaneously generated accurate mass EI and CI information. The advantages gained using additional tools and databases for both ionization methods in terms of compound identification have already been shown. Additional chromatographic method variation using the ecTOF instrument provides further advantages (for example, higher chromatographic resolving power) and is highly complementary with this dual type of ionization. The dual ionization HR-TOF-MS instrument also provides benefits for statistical approaches within NTS workflows. The combined use of CI- and EI-generated information can bring the statistical usage to a new level of depth and details about synergetic information, which will be a major advantage in GC–MS-based NTS analysis going forward.
References
(1) NIST, NIST Standard Reference Database 1A. https://www.nist.gov/srd/nist-standard-reference-database-1a-v17. (accessed March 11 2021).
(2) T. Letzel and S. Bieber, LCGC N. Am. supplement: Hot Topics in Gas Chromatography 39(s6b), 22–24 (2021).
(3) S. Grosse and T. Letzel, User Manual for FOR-IDENT Database 3, 1–35 (2017).
(4) A.S. Moorthy, W.E. Wallace, A.J. Kearsley, C.V. Tchekhovskoi, and S.E. Stein, Anal. Chem. 89, 13261–13268 (2017).
(5) M. Guillevic, A. Guillevic, M.K. Vollmer, P. Schlauri, M. Hill, L. Emmenegger, and S. Reimann, J. Cheminform. 13, 78 (2021).
(6) H. Kersten, K. Kroll, K. Haberer, K. J. Brockmann, T. Benter, A. Peterson, and A. Makarov, J. Am. Soc. Mass Spectrom. 27, 607– 614 (2016).
(7) A. Amirav, A.B. Fialkow, A. Gordin, O. Elkabets, and J. K. Margolin Eren, J. Am. Soc. Mass Spectrom. 32, 2631–2635 (2021).
(8) E.C. Horning, M.G. Horning, D.I. Carroll, I. Dzidic, and R.N. Stillwell, Anal. Chem. 45, 936–943 (1973).
(9) S. Bräkling, K. Kroll, S. Klee, T. Benter, H. Kersten, J. Am. Soc. Mass Spectrom. 33, 499–509 (2022).
(10) TOFWerk, Principle of Operation – Simultaneous Electron Ionization & Chemical Ionization with the EC-TOF for GC–MS. https://www.tofwerk.com/principle-of-operation-ec-tof-white-paper/ (accessed April 2022).
(11) M.V. Budahegyi, E.R. Lombosi, T.S. Lombosi, S.Y. Mészáros, S. Nyiredy, G. Tarján, et al, J. Chromatogr. A 271, 213–307 (1983).
(12) K.E. Rusanov, N.M. Kovacheva, and I.I. Atanassov, Biotechnol. & Biotechnol. Eq. 25, 2210–2216 (2011).
(13) The European Parliament, Regulation (EC) No. 1223/2009. Official Journal of European Union, L342/59 (2009). https://ec.europa.eu/health/system/files/2016-11/cosmetic_1223_2009_regulation_en_0.pdf.
(14) J.L. Little, et al, LCGC Europe 26(3), 163–168 (2013).
(15) U.S. Environmental Protection Agency, Comptox Chemical Dashboard. https://comptox.epa.gov/dashboard/chemical-lists. (accessed April 2022).
Sonja Klee, Steffen Bräkling, and Marleen Vetter are with TOFWerk AG in Thun, Switzerland. Steffen Bräkling is also with the Physical & Theoretical Chemistry Department, at the University of Wuppertal, in Wuppertal, Germany. Stefan Bieber and Thomas Letzel are with Analytisches Forschungsinstitut für Non-Target Screening GmbH (AFIN-TS), in Augsburg, Germany. Direct correspondence to: sonja.klee@tofwerk.com
Common Challenges in Nitrosamine Analysis: An LCGC International Peer Exchange
April 15th 2025A recent roundtable discussion featuring Aloka Srinivasan of Raaha, Mayank Bhanti of the United States Pharmacopeia (USP), and Amber Burch of Purisys discussed the challenges surrounding nitrosamine analysis in pharmaceuticals.
Silvia Radenkovic on Building Connections in the Scientific Community
April 11th 2025In the second part of our conversation with Silvia Radenkovic, she shares insights into her involvement in scientific organizations and offers advice for young scientists looking to engage more in scientific organizations.


