The Nomenclature of Comprehensive Two-Dimensional Gas Chromatography: Defining the Modulation Ratio (MR)
LCGC Europe
The interpretation of comprehensive two-dimensional gas chromatography (GCÃ-GC) based on the modulation ratio (MR) concept encompasses method implementation, ideas on quantitative measurement and how modulation phase affects GCÃ-GC.
LCGC Europe published a paper in 2003 that sought to establish a nomenclature for comprehensive two-dimensional gas chromatography (GC×GC).1 Recently a term called modulation ratio (MR) was added to the lexicon of GC×GC. This defines the way a peak is sampled from a first dimension column into a second column. It is a rather simple definition in practice, which helps the analyst to understand the relative dimensions required of the two columns (in particular, those of the second column) to ensure that sampled solutes elute within the modulation period chosen. Using the modulation ratio, we can decide how many modulated peaks need to be measured to provide a suitable quantitative estimation of the peak area of a solute.
The MR value requires an understanding of the concept of modulation phase because this affects how modulated peaks vary in size according to the manner in which the first dimension is sampled. This article will put into context the different interpretations that can be elucidated through ideas of the modulation ratio.
The Modulation Ratio Concept, MR
The modulation ratio is defined by Equation (1):2

We have chosen this definition to quantify the relationship between the width of a peak at baseline that elutes from a first dimension column (1wb), to the selected modulation period, PM, that we use to generate the modulation process in comprehensive two-dimensional gas chromatography (GC×GC). Seeley used a term called the dimensionless sampling period, τ, to relate first and second dimension peak properties.3 Beens et al.4 employed a term called modulation criterion, where the ratio of maximum second dimension retention time to first dimension peak standard deviation (SD) is required to be ≤ 1.5.
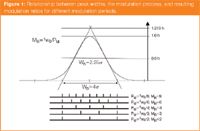
Figure 1
The modulation ratio essentially means that if the modulation period PM is set the same as the peak standard deviation (SD), then we will have a MR value of 4σ/σ (i.e., MR = 4). It was proposed by Murphy et al.5 that ~ 4 modulated peaks should be generated if the first dimension resolution is to be preserved in the comprehensive experiment. The concept of MR is an improved interpretation of this idea. Since the peak width is defined as 4σ, then in this instance we get "about" 4 modulations per peak. Let us put that into context. If a peak is about 10 s wide, then using a PM of 2.5 s will give an MR of 4. Refer to Figure 1 for a further definition of the MR concept with respect to the sampling of the first dimension peak. Table 1 reports the interrelation between PM and MR for various peak widths at base.
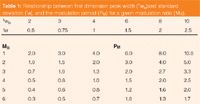
Table 1: Relationship between first dimension peak width (1wb)and standard deviation (1Ï), and the modulation period (PM) for a given modulation ratio (MR).
Furthermore, if we choose a MR value of 1, which means that the PM is able to span the full width at baseline for a peak, then we get the result represented in Figure 2. Here, we show two cases for both a symmetrical peak and an asymmetrical peak. The two cases describe two limiting modulation processes; A is termed an in-phase modulation process, whereas B is 180° out-of-phase modulation. For a symmetrical peak, both of these define symmetrical modulation results, however, for A there is a single major peak, but B generates two major peaks: one on either side of the first dimension peak mean. All of the sampled peak modulations in Figure 1 describe the out-of-phase case.
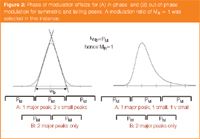
Figure 2
Figures 3 and 4 demonstrate simulated peaks for both in-phase and out-of-phase cases. These are based on the Gaussian distribution for the input peak and, in general, we have found that for the real case, they reasonably faithfully describe the modulated results that are produced by the modulation process. For example, Figure 5 is a series of real modulated peaks that arise for an injected compound that is essentially Gaussian on the first column and is stepped sequentially through different phase distributions. This experiment follows that of Ong et al.,6 which focused on experiments explaining modulation phase and frequency. We step through different phases of modulation quite simply by making repeated injections into the GC×GC system, but vary the start time for the modulator to commence its movement [our modulation method is based on the longitudinal modulation cryogenic system (LMCS) which is a cryotrap device that moves back-and-forth along the column]. In the first injection, the modulator commences modulation at 3.00 min; the PM is 6 s, and the 1wb is ~ 18.5 s (the analysis was conducted isothermally in this instance and so intentionally gave a broad peak with a retention time of approximately 17 min).
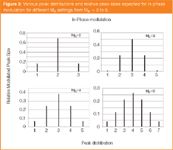
Figure 3
A noteworthy point here is that there is excellent control of experimental factors provided by the GC and modulation system. Because each step (A–F) differs by only 1.2 s, then this experiment will not be possible unless there is very good control of carrier flows, temperature and modulation timing and we estimate this to be better than 0.2 s for the total process. In the second injection, modulation commences at 3.02 min (i.e., offset by 1.2 s compared with the first case). By the time the offset is set to 3.10 min (6 s), the modulator is now back in-phase with that at 3.00 min and so A and F should represent the same phase of modulation. And indeed, simple visual comparison of A and F confirms that they look almost indistinguishable.
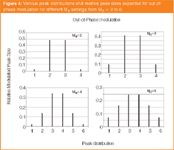
Figure 4
Two further points can be noted. With reference to the peaks marked 1, as the particular modulation event samples more of the incoming band of material (i.e., at the leading edge of the band) then peak 1 will gradually increase in response from A through F. This can also be seen for the second peak. By contrast, on the trailing edge of the peak, the modulation event progressively samples less of the chromatographic band and we now see that the peak marked 4 gradually decreases in relative amounts from A to F.

Figure 5
The Role of MR in Optimization
So how does the concept of MR help with optimization? The task of optimizing a GC×GC experiment may seem rather complicated. The total experiment must take the following factors into account:
The first dimension column length, inner diameter, phase film thickness, carrier flow-rate/velocity, temperature programme rate, then the same parameters for the second column. Then, the two columns should be thought of as a coupled set, with either the full carrier flow transferred from one column to the other, or with a split flow,7 and the second column either at the same temperature as the first, or at a temperature differential to the primary oven. Harynuk presents these considerations in a manner that might be off-putting to a less experienced user,8 but rather this should be thought of in the totality of how the system is set up. Ideally, once a few key criteria are established, then the rest of the method falls into place.
We also note a few basic tenets. First, if the temperature programme rate is increased, the components are delivered to the 2D column at higher 1Te (elution temperature for the 1D column) and so they will have a smaller 2k (retention factor on the second column). Second, if carrier flow is increased, the 1Te is reduced, which might be thought to increase retention (or 2k), however, the higher flow will cause 2k to be reduced; the nett effect is that 2k will not be altered very greatly.
If we wish to have a modulation ratio of, say, 3, then we can reduce this to a series of logical steps. The logic may progress as follows:
The 1wb value will determine the modulation period, PM, if we require MR = 3. Knowing the 2tM value, this will then control the magnitude of the maximum 2k value. If we do not want to experience wrap-around, then 2k and 2tM will establish column length 2L. Of course, 2k will be also determined by 2df, the phase film thickness. Clearly, knowledge of the most retained compound, the general aims of the study (for example, the regions of interest that are to be analysed), and the best way to achieve the study goals, will all be critical.
Because GC peaks can vary in their peak widths over the duration of an analysis and because PM is usually held at a constant value, then the value of MR can vary over the duration of the chromatographic analysis. We normally use a constant temperature programme rate, rT, with possibly a short constant temperature period at the start and end of an analyses, for good reasons. However, it is not unusual to observe narrower peaks at the start of the analysis and broader peaks towards the end of the analysis. In a high temperature application for sterols, an isothermal upper temperature was held for over 25 min at 320 °C and 1D peak broadening caused many modulated peaks to be observed for the later sterol peaks.9
We have conducted studies where we alter PM such that early in the analysis, faster modulation (smaller PM) is used, then in the later regions of the analysis two progressively slower modulations are employed, for example, PM = 3 s, then 4 s and finally 5 s. This is purely on the grounds of the 1D peak widths to achieve best (or constant) MR, but ignores the other considerations such as the extent of wrap-around that individual components in different regions may be subject to. For instance, if narrow peaks in 1D imply that PM should be set to a small value to get the best MR result, then this may cause significant wrap-around (where compound elution time on the 2D column exceeds the PM setting, so the peak is located in a subsequent modulation event).
Whilst we might propose that we could vary temperature programme rates to maintain constant 1wb, and keep MR constant over the analysis, this is probably not going to be either easy to accomplish, nor practical given that we are accustomed to relationships and peak positions that derive from constant programme rates, such as orderly elution of homologous series of compounds.
Modulation Ratio and Quantification
The most common and perhaps most chromatographically sound approach to quantification in GC×GC is to add up all the peaks arising from the modulation of a single compound. From Figure 3 and 4, we can decide how many peaks we need to add up to obtain "most" of the total peak area. In Figure 4, the MR = 2 data shows that almost all the peak area is in peaks 2 and 3 (95%), with peaks 1 and 4 almost negligible (2.4% each). However, for in-phase modulation (Figure 3), we'd want to measure the three largest peaks, because peaks 1 and 3 each now comprise 16% of the total area. The more modulated pulsed peaks (higher MR value) the more peaks that need to be incorporated into the summation, before the additional peaks at the extremities of the distribution become insignificant. Figure 6 shows the case of a polyaromatic hydrocarbon (PAH) compound, which has been modulated into a series of peaks, whose relative peak areas are presented in panel B. By adding up different sets of these peaks, we can gauge how much of the total peak area resides in these combinations of modulated peaks. For example, the centre peak comprises 35% of the total, whereas peaks 1 + 2 have 55% of the total area. By measuring the three central peaks, we get 86%.
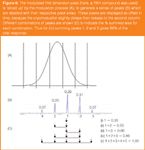
Figure 6
If compounds become less abundant then the peaks at the extremities become diminishingly smaller, and it is quite likely that only the central peak(s) is(are) observed and measured. In this instance, we cannot do anything but accept that some peak area must be "lost" in the quantitative process. Harynuk et al.10 have estimated the error associated with this process.
In the case of a MR value of 1 (Figure 2) it is apparent that at the two limiting phase conditions for a symmetrical peak (in-phase; 180° out-of-phase) then in the first case a single peak will capture almost all the area, but for the latter case, two equally large peaks will be generated and so must be measured. For a tailing peak, it is necessary to consider how many minor peaks can be derived on the tail of the peak.
In terms of the number of peaks to add up in each case, we can contrast out-of-phase modulation MR = 2 and 4. Figure 7 is a plot of number of the measured peaks, against total summed area.2 If we require at least 95% of the area to be measured, then we have to measure 2, or 4 peaks respectively for MR = 2 and 4. This number of peaks will vary if we consider in-phase, out-of-phase and some intermediate modulation phase.2,10
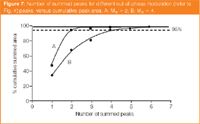
Figure 7
Amador-Muñoz and Marriott applied concepts of MR with measurement of a just a few major modulated peaks for each solute for a PAH sample.11 including deuterium-labelled internal standards (ISs) for quantitative purposes and validated the observations against the measurement of the total peak distribution. Here, both two- and three-summed modulated peaks were tested for their respective performance to provide quantitative data for measured area vs the internal standard area. This in Figure 6 would be represented by taking the two or three largest peaks and ratioing this against the two or three largest peaks in the internal standard. In general, it appeared that by measuring a consistent subset of peaks, the result was not significantly different from measuring the total peak set and is similar to the original 1D analysis result. This study was conducted for both GC×GC with flame ionisation detection (GC×GC-FID)11 and GC×GC with time-of-flight mass spectrometry (GC×GC-TOF-MS)12 analysis.
Conclusions
In conclusion, the MR concept has proved to be a useful adjunct to understanding various ideas in comprehensive two-dimensional gas chromatography, it has helped to explain the impact of modulation period on quantitative measurements in GC×GC and can be used to assist in optimizing the experiment. We are certain that the utility of MR does not end at the situations described and look forward to extending these studies further.
Philip Marriott is professor of separation science, at RMIT University. His major research interests are in high resolution GC, GC×GC and multidimensional GC. These are often demonstrated by a wide range of applications methods. Spectroscopic detection plays an increasing role in technologies developed in his laboratory and includes a number of mass spectrometry procedures and, recently, nuclear magnetic resonance.
Dr Weeraya Khummueng was a PhD candidate at RMIT University working with Professor Marriott. She has now returned to Prince of Songkhla University (Pattani campus) where she is a member of the academic staff of the Department of Chemistry. She investigated GC×GC of pesticides and related compounds for her PhD research, studying various detector technologies and the application of the modulation ratio.
References
1. P.J. Schoenmakers, P.J. Marriott and J. Beens, LCGC Eur., 16(6) 335–339 (2003).
2. W. Khummueng, J. Harynuk and P.J. Marriott, Anal. Chem., 78, 4578 (2006).
3. J.V. Seeley, J. Chromatogr. A, 962, 21 (2002).
4. J. Beens et al., J. Chromatogr. A, 1086, 141 (2005).
5. R.E. Murphy, M.R. Schure and J.P. Foley, Anal. Chem., 70, 1585 (1998).
6. R.C.Y. Ong and P.J. Marriott, J. Chromatogr. Sci., 40. 276 (2002).
7. P.Q. Tranchida et al., Anal. Chem., 79, 2266 (2007).
8. J. Harynuk and T. Gorecki, Amer. Lab., 39, 36 (2007).
9. T. Truong et al., J. Chromatogr. A, 1019, 197, (2003).
10. J.J. Harynuk, A.H. Kwong and P.J. Marriott, J. Chromatogr. A, 1200, 17 (2008).
11. O. Amador-Muñoz and P.J. Marriott, J. Chromatogr. A, 1184, 323 (2008).
12. O. Amador-Muñoz et al., J. Chromatogr. A, 1201, 161 (2008).

Analysis of Pesticides in Foods Using GC–MS/MS: An Interview with José Fernando Huertas-Pérez
December 16th 2024In this LCGC International interview with José Fernando Huertas-Pérez who is a specialist in chemical contaminants analytics and mitigation at the Nestlé Institute for Food Safety and Analytical Sciences at Nestlé Research in Switzerland, In this interview we discuss his recent research work published in Food Chemistry on the subject of a method for quantifying multi-residue pesticides in food matrices using gas chromatography–tandem mass spectrometry (GC–MS/MS) (1).
The Use of SPME and GC×GC in Food Analysis: An Interview with Giorgia Purcaro
December 16th 2024LCGC International sat down with Giorgia Purcaro of the University of Liege to discuss the impact that solid-phase microextraction (SPME) and comprehensive multidimensional gas chromatography (GC×GC) is having on food analysis.


