A New Path to High-Resolution HPLC–TOF-MS — Survey, Targeted, and Trace Analysis Applications of TOF-MS in the Analysis of Complex Biochemical Matrices
Special Issues
The impact of speed of analysis and selectivity to the depth of coverage and accuracy of the analyses are discussed.
High performance time-of-flight mass spectrometry (TOF-MS) is applied to the analysis and characterization of complex biological samples. High mass accuracy, high resolution, and accurate relative isotope abundance are all applied to the determination of analytes covering a range of concentrations in complex matrices including plasma and urine. Qualitative and quantitative evaluations are provided and include demonstrations of the impact of high-performance MS on sensitivity and selectivity. The ability to leverage high-performance MS in conjunction with a broad dynamic range in rapid ultrahigh-pressure liquid chromatography (UHPLC) analyses to identify unknowns and to propose putative metabolic biomarkers is demonstrated. The impact of speed of analysis and selectivity to the depth of coverage and accuracy of the analyses are discussed.
Demands on modern analytical chemistry are driven by enhanced information content, faster analyses, faster data processing, and higher throughput. Tools in separation science continue to increase the speed and information content of traditional analyses as demonstrated by the growing popularity of ultrahigh-pressure liquid chromatography (UHPLC) (1), fast gas chromatography (GC) (2), and GC×GC (3). This creates demands for faster data acquisition and higher fidelity data, which in mass spectrometry (MS) translate to mass accuracy and resolution. To address these demands, the mass resolution, mass accuracy, and data acquisition speeds of mass spectrometry have been pushed to improve instrument capabilities. A historical overview of mass analyzers is provided in Table I with the representative performance attributes provided.

Table I: Overview of high-performance mass spectrometers
The utility and value of high-resolution, high mass accuracy MS has been emphasized in numerous recently reported applications of the technology (4–9). High-resolution MS has been the domain of Fourier-transform (FT) MS and magnetic-sector instruments for decades. The paradigm is shifting away from just high-resolution MS to high-performance MS that includes mass resolving power, mass accuracy, isotope abundance, and acquisition speed in its considerations. New developments in high-performance mass spectrometers have shown significant impact. Time-of-flight (TOF) instruments with higher resolution and enhanced performance are a significant portion of the efforts. Recent advances in TOF mass spectrometers have enabled these instruments to provide high resolution and mass accuracy with speed, simplicity, and convenience. The measurement of mass-to-charge ratio (m/z) in a TOF analyzer is described by the following equation:
t = D(m/2z)1/2
in which t is time, D is the flight distance, m is the mass, and z is the charge on the ion. This provides the fundamental relationship that t is proportional to D, and in turn, resolution (defined as [m/δm] or [t/2*δt]) is also a function of D and t. This has been one of the challenges to TOF — to achieve long flight paths in reasonable physical space and provide high performance. A number of key advances have occurred over the past two decades that have improved the performance of TOF mass analyzers and have included orthogonal acceleration (10), high-speed electronics, delayed extraction (10), and pulsed ionization (11), which permit the most effective utilization of the flight path available. In spite of these advances, TOF mass analyzers are highly sensitive to the initial conditions of the ions as they enter the mass analyzer. This includes distributions in velocity, time, and space during ion generation and at entry to the mass analyzer. To provide an extended flight path and address initial ion dispersion, electrostatic time-focusing elements such as reflectrons (12) have been implemented, improving resolution significantly.
However, these approaches are limited by dispersions and higher order aberrations, as well as flight lengths on the order of a few meters. Other efforts have attempted to extend the flight path using cyclotron and torroidal analyzers (13). Duty cycle and effective mass range are typical compromises to high levels of mass measurement performance. With these advances, TOF has achieved a position in the realm of mass analyzers in which it provides sensitivity, mass accuracy and resolution that surpass some magnetic sector systems and encroach on the analyses historically reserved for FTMS systems. The principle advantage of a TOF system is the absence of scanning. This provides a mass measurement system well suited to analyte surveys rich in information content and high in duty cycle. These advances have opened the world of high resolution accurate mass analysis, historically the domain of FTMS and magnetic sectors, to TOF mass analyzers with the added benefit of simplicity and speed. The significant advances of TOF mass analyzers toward high-performance mass spectrometers continue in the approach discussed below.
The New Technology
In one of the most recent advances in TOF-MS, Verentchikov and colleagues (14,15) have introduced the multireflecting time-of-flight analyzer that uses a Folded Flight Path (FFP). This is depicted in Figure 1, which shows how the ions effectively pass between each of two planar ion mirrors and through an Einzel lens array. A major challenge in the multireflecting systems is poor transmission because of defocusing of ion trajectories. In the FFP configuration, transmission is improved by using nonlinear electrostatic fields in the gridless mirrors. The ions are constantly refocused as they traverse the flight path and create the extended flight path needed to enhance the resolution. The gridless design minimizes ion loss during the flight. The mass analyzer offers three effective flight paths of approximately 2-, 20-, and 40- m lengths with operations in the same planar flight "tube." These operational options are depicted in Figure 2. The number of passes or reflections determines the effective pathlength, and by inference, the available resolving power. The performance capabilities of this system are provided in Table I.
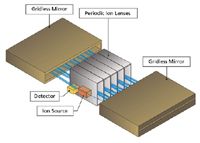
Figure 1: Depiction of multireflecting TOF or folded flight path design.
This design is applied to the analysis of analytes in complex matrices in the form of UHPLC coupled to atmospheric pressure ionization with TOF-MS. The matrices include plasma and urine, and the analytes include compounds of pharmaceutical interest and naturally occurring biological analytes associated with disease states. The applications discussed include the identification and relative quantitation of metabolites in plasma from three strains of Zucker rats, an example of the study of animal models of disease (16), and the analysis for metabolites of common cold medications in human urine.
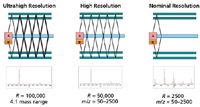
Figure 2: The three modes of operation of the MRT/HRT system. The FFP design facilitates multiple flight distances for ions, and as such, the potential for multiple levels of resolving power. Ions pass between electrostatic mirrors and are refocused by central lenses for the length of the analyzer. Two full passes across the analyzer provide a 40-m flight path (ultrahigh resolution) and 100,00 resolving power, one pass through the entire analyzer provides a 20-m flight path (high resolution) and 50,000 resolving power, and a partial pass through the analyzer provides a 2-m path (nominal resolution) and 2500 resolving power. (Note: A = accelerator and D = detector.)
Experimental
The following represent the basic conditions used in the analyses described in the results and discussion which follow. Chromatographic separation was achieved using an Agilent Technologies (Santa Clara, California) 1290 UHPLC system with mobile phases consisting of water with 0.1% (v/v) formic acid (A) and acetonitrile with 0.1% (v/v) formic acid (B). Mobile phase was delivered at 0.1–0.2 mL/min and with gradients covering 0–80% B between 3 and 30 min. Injection volumes varied between 1 and 5 μL. The column used was a 50 mm × 1 mm Hypersil Gold C18 AQ (Thermo Fisher Scientific, West Palm Beach, Florida). MS was achieved on a LECO Citius LC-HRT system equipped with a LECO electrospray ionization (ESI) source (LECO Corporation, St. Joseph, Michigan) and operated in high resolution mode (R = 50,000 [FWHM]). Data were processed using ChromaTOF-HRT software (LECO). Acquisition rates of 2–40 spectra/s were used both with and without in-source collision-induced dissociation. Calibration was achieved using external calibration with Agilent Tune Mix.
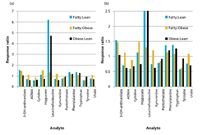
Figure 3: Relative response ratios for select analytes in plasma from Zucker lean, fatty, and obese rats. (a) Full-scale plot; (b) zoomed plot.
Rat plasma samples were obtained from Bioreclamation (Hicksville, New York) and were from lean, fatty, and obese Zucker animals. The plasma was from terminal bleeds with the rats being 7–9 weeks of age. The plasma samples were deproteinated using Microcon (Billerica, Massachusetts) centrifugal devices with a 5K cutoff. After protein removal, samples were diluted 5× into aqueous 0.2% heptafluorobutyric acid before UHPLC analysis.
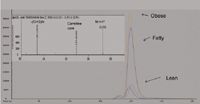
Figure 4: Extracted ion chromatogram of 232.1554 ± 0.01 from selected rat samples.
Urine was obtained from a healthy male volunteer before and after a single dose of cold medicine containing 6.5 mg doxylamine, 15 mg dextromethorphan, and unspecified amounts of polyethyleneglycol (PEG) and other excipients. To remove salt and protein from each sample, a 0.15-mL aliquot was diluted with 1.05 mL methanol and centrifuged. A 1.0-mL aliquot of the clear supernatant was evaporated, reconstituted with 0.025 mL methanol and 0.10 mL water with 0.1% formic acid, and analyzed by UHPLC–TOF-MS under high resolution conditions. All other chemicals used were obtained from Fisher Scientific (Fairlawn, New Jersey) or Sigma-Aldrich (St. Louis, Missouri).

Table II: Mass accuracy in the assignment of identities to doxylamine metabolites
Results and Discussion
Rat Plasma Metabolomics: Plasma samples from lean (n = 10), fatty (n = 9) and obese (n = 10) Zucker rats were analyzed by LC–MS using high-performance TOF-MS. The analysis of the data was achieved by means of two mechanisms. In one, a list of established analytes was used to search the data for these analytes using an accurate mass targeted approach. In these instances, the exact m/z value was searched against the existing data to within 0.001 m/z unit. In the other, the accurate m/z values obtained from the analyses were used to determine molecular formulas, and the formulas or the accurate m/z values were searched in ChemSpider (17) or KEGG (18) or other similar metabolite databases to facilitate the identification of the analyte in question. In both of these instances, the ratio of area responses in the samples from the different phenotypes were then averaged and compared to each other for differences as three ratios. Specifically, the Lean:Fatty, Lean:Obese, and Fatty:Obese response ratios were generated, and the averages for each phenotype are provided graphically in Figure 3 for representative analytes. The plot shows several selected or readily identified analytes that show positive changes in the Lean:Fatty and Lean:Obese ratios relative to the Fatty:Obese ratio. These include leucine/isoleucine, hippurate, dimethylarginine, kynurenine, and urate. The nearly sixfold change in leucine/isoleucine is the most striking and largest proportional positive change for the "fatty" phenotype, while the change in kynurenine is the highest magnitude change negatively correlated with the "fatty" state. Both kynurenine and leucine/isoleucine have been previously associated with diabetes and obesity (19–23).
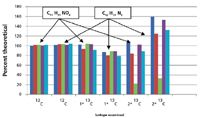
Figure 5: Comparison of relative isotope abundance measurements for the analyte at m/z 232.1554. The percent of the theoretical abundance is provided versus the expected values for each option and is shown as Option 1/Option 2. The options are the two highest hits in the formula match. Isotope abundance was calculated using the ChromaTOF-HRT tool. Signals were considered from each of five samples, which covered a range of response intensities, and all three phenotypes.
At the beginning of this study, standards were not available for confirmation of identity. As such, experiments including the fragmentation of "precursor" ions before the mass analyzer (so-called in source CID) with accurate mass measurement of fragment ions and the use of relative isotope abundance were used to clarify or support identification. One analyte identified in these studies was butyryl carnitine. In this case, an ion at m/z = 232.1554 was observed to change in intensity between lean and fatty/obese states. The formula search for this m/z provided two formulas within 5 ppm of the target m/z: C11H21N1O4 (0.77 ppm error) and C12H17N5 (1.3 ppm error). To provide additional information on the structures of the analyte, the fragment ions were extracted into a separate data channel and evaluated. Figure 4 shows an extracted ion chromatogram for both low (lean) and high (obese/fatty) samples along with the fragment ion spectrum from a lean sample. The two prominent fragment ions at m/z 173.082 and 85.03 match the loss of trimethylamine from 232 and the loss of butyric acid group and a trimethylamino group from 232, respectively. These are consistent with the identification of 232.1554 as butyryl carnitine. To provide yet another piece of supporting evidence, the relative isotope abundance was generated for the two formula above and these were compared to what was observed in high (fatty/obese) and low (lean) intensity samples. These findings are provided in Table II. For the monoisotopic peak and first isotope the agreement with the theoretical distribution is better than ±5% (relative) in all cases versus Option 1 (butyryl carnitine). For the second isotope (2 13C), the agreement is still better than ±17% (relative) for four of the five samples, with the fifth being of very low signal intensity. In all cases, the relative isotope abundance defines which of the two formula options best fits the data. This is most clearly seen in the first isotope data shown in Figure 5. This combination of accurate mass precursor analysis, accurate mass fragment ion analysis, and high integrity relative isotope evaluation is a clear demonstration of the impact that high-performance MS can have in metabolomic analysis and the characterization of analytes.
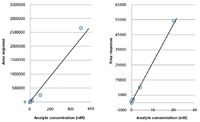
Figure 6: Standard curve of butyryl carnitine from single injections: (a) 0.16â500 nM, (b) zoomed region of 0.16â20 nM.
Of additional importance in metabolomic analysis is the dynamic range of the instrument. To effectively interrogate both abundant and trace level analytes simultaneously, the linearity of response across several orders of magnitude is necessary. To explore this and the limit of detection of the accurate mass system, a standard curve of butyryl carnitine was created that covered the range of 0.16 through >500 nM. The plots of response versus concentration are shown in Figure 6 (Figure 6a: 0.16–500 nM; Figure 6b: 0.16–20 nM) and demonstrate that the dynamic range achievable here is clearly in excess of the 500 nM point shown (2500 nM not shown). This is equivalent to a linear dynamic range greater than 3000-fold (15,000-fold at 2500 nM). The experiment has its lowest detectable level at 0.16 nM or approximately 200 fg of butyrylcarnitine on-column. This translates to the ability to examine either dramatic differences in concentrations of a single analyte or a range of analytes at substantially different concentrations in the same analysis.
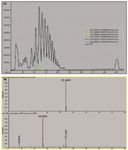
Figure 7: (a) Base peak signal and extracted ion chromatograms of active ingredients and potential metabolites in urine. The signal for PEGs is clear between 50â100 s. (b) Precursor (low energy) and product (high energy) spectra from m/z 271 showing key fragment ions. The extraction window is at ±2 ppm for each analyte.
Analysis and Characterization of Drug Metabolites in Urine: One of the most complex, but also most readily available, biological fluids is urine. It is difficult to standardize and is affected by diet, physiological state, disease, and other hard-to-control factors (24). With all of this said, urine is still able to indicate the health of individuals and to provide insights into what the body has been exposed to, as it does give up its metabolites easily through renal clearance mechanisms. Here, urine from a healthy donor was analyzed by UHPLC with high-performance detection. A minimal level of cleanup was performed with the objective of providing a global survey for metabolites of doxylamine and dextromethorphan. Figure 7 shows a representative set of chromatograms for actives and metabolites detected in urine. The extraction window of ±2 ppm shows the necessary stability of the mass accuracy across the entire peak. This facilitates accurate integration of signal with high resolution and accuracy relative to other peaks. Although there are known compounds which should be present from the dosing, urine is a complex matrix, and as such, the identity of the analytes was confirmed by accurate mass analysis (Table II), which showed less than 0.5 ppm mass errors for the proposed doxylamine-related peaks. Similar to what was achieved with the butyryl carnitine peak, relative isotope abundance for the doxylamine provided highly accurate agreement with the theoretical isotope abundance. This is shown in the top of Table III. In addition, the application of "in-source CID" to generate fragment ions provided both accurate mass fragment identification and accurate relative isotope abundance of the fragment ions. These findings are shown in the bottom of Table III. All but the lowest of signals provide better than 5% relative difference versus the theoretical isotope abundance. Furthermore, the measured resolving power was in excess of 40,000 at m/z 271, and even at m/z 90, the resolving power was a robust 35,000.

Table III: Mass accuracy and relative isotope abundance for doxylamine using "in source CID." Parent ion data are provided at the top of the table and product ion data at the bottom.
Conclusions
The above applications of high-performance MS to the analysis of physiological analytes and metabolites in complex biological matrices provide a representative overview of the impact that this type of experimentation can have on analyte identification and quantitation. High mass accuracy, mass resolving power, and relative isotope abundance prove to be invaluable tools for analyte identification in the experiments discussed and facilitated the identification of analytes as potential biomarkers for obesity and as metabolic byproducts of pharmaceutical agents. Having high mass accuracy, resolving power, and isotope measures available in both precursor and fragment ions make the confidence an analyst might have in the identification of analytes extremely high. As this can be achieved on femtogram amounts of material using high acquisition rates with analysis times of a few minutes and provide high performance under all acquisition conditions, high-performance MS is both fast and of high information content. These findings clearly define the ability of high-performance MS to provide a positive impact in the advancement of metabolomic and metabanomic analyses.
Acknowledgments
The authors wish to thank Celine Aguer and Mary-Ellen Harper from the University of Ottawa (Ottawa, Canada), Oliver Fiehn from UC Davis (Davis, California), and Sean Adams from the Western Human Nutrition Research Center (WHNRC) at UC Davis for butyryl carnitine standards through work funded by the National Institute of Health (DK 078328, Bethesda, Maryland).
References
(1) M. Schwarz, LCGC North America 28(5), 376–385 (2010); N. Wu, A. Clausen, L. Wright, K. Vogel, and F. Bernardoni, Amer. Pharm. Review March/April 2008.
(2) F.L. Dorman, J.J. Whiting, J.W. Cochran, J. Gardea-Torresdey, Anal. Chem. 82(12), 4775–4785 (2010); L. Mondello, P.Q. Tranchida, A. Casilli, P. Dugo and G. Dugo, THE APPLICATIONS BOOK September 2004, 39–40 (2004); P. Magni, R. Facchetti, A. Cadoppi, F. Pigozzo, and C. Brunelli, THE APPLICATIONS BOOK September 2004, 59 (2004); R. Murray, Anal. Chem. 77(1), 5 A (2005).
(3) J. Harynuk and P.J. Marriott, Anal. Chem. 78(6), 2028–2034 (2006); M. Junge, S. Bieri, H. Huegel, and P.J. Marriott, Anal. Chem. 79(12), 4448–4454 (2007).
(4) T. Kind and O. Fiehn, BMC Bioinformatics 8, 105–124 (2007).
(5) T. Kind and O. Fiehn, BMC Bioinformatics 7, 234–243 (2006).
(6) M. Kellman, H. Muenster, P. Zomer, and H. Mol, J. Am. Soc. Mass Spectrom. 20, 1464–1476 (2009).
(7) J.M. Herniman, G.J. Langley, T.W.T. Bristow, and G. O'Connor, J. Am. Soc. Mass Spectrom. 16, 1100–1108 (2005).
(8) R. Ketterlinus and I. Sanders, G.I.T. Laboratory Journal, 7–8(12), 26–27 (2008).
(9) K. Yu, M. Xin, J. Castro-Perez, X. Fu, Y. Chen, H. Guo, J. Shockor, and B. Murphy, Current Trends in Mass Spectrom. Oct. 2009, 36–43 (2009).
(10) M.L. Vestal, P. Juhasz, and S.A. Martin Rapid Commun. Mass Spectrom. 9, 1044–1050 (1995).
(11) R.J. Cotter, "Time of Flight Mass Spectrometry: Instrumentation and Applications in Biological Research", Chapter 7, 137–168, American Chemical Society (1997).
(12) M. Toyoda, D. Okumura, M. Ishihara, and I. Katakuse, J. Mass Spectrom. 3, 1125–1142 (2003).
(13) A.N. Verentchikov, M.I. Yavor, Yu. I. Hasin, and M.A. Gavrik, Technical Physics 50(1), 73–81 (2005).
(14) A.N. Verentchikov, M.I. Yavor, Yu. I. Hasin, and M.A. Gavrik, Technical Physics 50(1), 82–86 (2005).
(15) R.S. Plumb, K.A. Johnson, P. Rainville, J.P. Shockcor, R. Williams, J.H. Granger, and I.D. Wilson, Rapid Commun. Mass Spectrom. 20, 2800–2806 (2006).
(16) ChemSpider, http://www.chemspider.com/FullSearch.aspx.
(17) Kyoto Encyclopedia of Genes and Genomes, http://www.genome.jp/kegg/pathway.html.
(18) D.K. Layman and D.A. Walker, J. Nutrition 136, 319S–326S (2006).
(19) P. She, C. Van Horn, T. Reid, S.M. Hutson, R.N. Cooney, and C.J. Lynch, Am. J. Physiol. Endocrin. Metab. 293, E1552–E1563 (2007).
(20) X. Zhao, J. Fritsche, J. Wang, J. Chen, K. Rittig, P. Schmitt-Kopplin, A. Fritsche, H-U. Haring, E.D. Schleicher, G. Xu, and R. Lehmann, Metabolomics 6(3), 362–374 (2010).
(21) R. Brauer, A.B. Leichtle, G.M. Fielder, J. Thiery, U. Ceglarek, Metabolomics First Online, doi.10.1007/s11306-010-0256-1, March (2011).
(22) L. Akesson, J. Trygg, J.M. Fuller, R. Madsen, J. Gabrielsson, S. Bruce, H. Stenlund, T. Tupling, R. Pefley, T. Lundstedt, A. Lernmark, and T. Moritz, Metabolomics First Online, doi.10.1007/s11306-010-0278-3, March (2011).
(23) L.G. Rasmussen, F. Savorani, T.M. Larsen, L.O. Dragsted, A. Astrip, and S.B. Engelsen, Metabolomics 7, 71–83 (2011).
Jeffrey S. Patrick, Kevin Siek, Joe Binkley, Viatcheslav Artaev, and Michael Mason are with LECO Corporation, Separation Science Division, St. Joseph, Michigan.
Understanding FDA Recommendations for N-Nitrosamine Impurity Levels
April 17th 2025We spoke with Josh Hoerner, general manager of Purisys, which specializes in a small volume custom synthesis and specialized controlled substance manufacturing, to gain his perspective on FDA’s recommendations for acceptable intake limits for N-nitrosamine impurities.
University of Rouen-Normandy Scientists Explore Eco-Friendly Sampling Approach for GC-HRMS
April 17th 2025Root exudates—substances secreted by living plant roots—are challenging to sample, as they are typically extracted using artificial devices and can vary widely in both quantity and composition across plant species.
Determining the Serum Proteomic Profile in Migraine Patients with LC–MS
April 17th 2025Researchers used liquid chromatography–mass spectrometry (LC–MS) in their proteomic analysis to compare the serum proteome of migraine patients with healthy controls and to identify differentially expressed proteins as potential migraine biomarkers.


