Multivariate Optimization Procedure for Dynamic Headspace Extractions Coupled to GC(×GC)
Volatile organic compounds (VOCs) are ubiquitous chemicals of great interest in the study of aromas and flavours of foods. Many recent studies present optimized headspace (HS) and dynamic headspace (DHS) methods for specific sample types; however, the literature does not present (to the best of our knowledge) a generalized procedure for the thorough optimization of a DHS extraction. This article presents an approach using design of experiments (DoE) for the optimization of DHS extraction parameters. The approach is demonstrated for two different food sample types with diverse populations of VOCs: active sourdough colony as an example with a high moisture content, and sourdough bread as an example with a lower moisture content. Optimized methods are assessed for VOC extraction reproducibility and exhaustiveness; guidelines for DHS optimization are presented.
Mixtures of volatile organic compounds (VOCs) emanate from foods and beverages during human consumption, and these compounds blend together to create flavours and aromas. While many VOCs are present endogenously in food, others can be added intentionally as flavour enhancers, or unintentionally through contact with other materials or packaging during handling, preparation, and storage. Additionally, VOC profiles can evolve and change due to storage and handling. These VOCs then contribute to both pleasant and unpleasant or “off” flavours in foods and beverages (1). Headspace sampling techniques have been shown to be the most effective approach for the extraction of VOCs from a variety of food and beverage matrices, including wine, bread, and milk (2–4). Aroma profiles can be obtained with little disturbance to the bulk sample during headspace sampling. The most commonly employed technique for these applications is headspace solid-phase microextraction (HS-SPME) (5–7). Though widely applied for its simplicity and relatively low cost, the fibre coatings introduce selectivity into the extraction process, as the coating will preferentially sorb certain compounds over others, depending on the chemistry of the fibre and analyte. Generally, SPME also favours analytes with moderate volatilities and is highly susceptible to matrix effects.These two features of SPME can make quantification and comparison of relative abundances of different compounds between sample types challenging. Dynamic headspace (DHS) has been suggested as a powerful alternative to HS-SPME because it provides better sensitivity and has fewer concerns related to selectivity of the extraction to matrix effects (8–10).
DHS was developed to overcome some limitations of static headspace sampling (11). It involves flowing a constant stream of inert gas through the headspace of a sample vial, purging volatiles that partition into the headspace onto a sorbent trap. DHS offers enhanced recoveries of analytes over other headspace techniques; however, it has multiple additional parameters that need to be optimized. DHS experimental conditions include sorbent type, sample incubation temperature, purge flow rate and volume, and sorbent trap temperature (12). To achieve optimal DHS conditions, the one‑factor-at-a-time method of optimization has been popular. This classical approach is a single-factor experiment wherein each variable to be optimized is studied individually until an optimal value has been reached. Although this univariate approach has been commonly used in DHS studies, there are many disadvantages to this method. It is costly in terms of sample volume, as well as instrument and analyst time, to investigate all the variables involved in DHS individually (13). More importantly, this method is not capable of evaluating interactions among the variables and their combined effects on the process. Consequently, the optimal conditions found through a series of single-factor experiments may not be globally optimal conditions and this univariate approach is not recommended for the optimization of multiple DHS parameters (14). To the best of the authors’ knowledge, there has yet to be a report in the literature that sets out general guidelines for the optimization of DHS extractions.
Prior studies have used a multivariate design for optimization of DHS parameters, which allows several variables and their interactions to be evaluated simultaneously (15−17). A statistical approach, referred to as Design of Experiments (DoE) (18), was employed to investigate multiple DHS parameters that may collectively impact the extraction of analytes. DoE is suitable for an experimental design with the goal of obtaining sufficient information through a reduced number of experiments, thus allowing several experimental parameters to be varied systematically and simultaneously (19). In the context of DoE, independent variables or experimental parameters are called factors, and different values for each factor in designed experiments are called levels. Although DoE is a suitable approach to explore the multiple DHS experimental parameters and their interactions, the appropriate choice of factors and levels is absolutely crucial in building a DoE model, as there are sample-dependent considerations to be made (20).
The aim of this study was to develop a generalized analytical procedure to guide DHS system optimization using DoE. While previous studies have reported optimized methods for one sample type (12,14–17,19,20), the literature does not, to the best of our searching, provide an easily accessible strategy that can be applied to any sample type. Given the increasing popularity of DHS, such a strategy would benefit the community. The proposed optimization procedure involves the use of experimental designs for both liquid and solid samples. For both studies, the Box-Behnken design was selected to generate modelling of the response surface using a smaller number of required runs than other designs, such as full factorial or central composite (21). To this end, active sourdough colony and sourdough bread (made from the same colony) were chosen as representative liquid and solid samples, respectively, for developing a standardized optimization strategy for DHS extraction methods.
Sourdough is commonly added to a variety of breads to enhance its aroma and flavour (22). Due to the variety of VOCs present, sourdoughs produce an intense aroma: the influential chemical classes include alcohols, aldehydes, ketones, and esters (23). There are several factors that influence the volatile profile of sourdough colony and bread. Sourdough volatiles are affected by the type and amount of flour used, hydration, type of fermentation, how much sourdough is used, and any extra ingredients added (24). VOCs can be determined between strains of sourdough and bread through headspace extraction techniques. Here, automated DHS extraction followed by comprehensive two-dimensional gas chromatography coupled to time-of-flight mass spectrometry (GC×GC–TOF‑MS) was used to explore VOCs from sourdough colony and sourdough bread.
Materials and Methods
Sourdough Colony Preparation for DHS Extraction: Sourdough colony samples (100.0 mg ±1.5 mg) were weighed into 10 mL headspace vials (Chromatographic Specialties Inc.). Vials were capped tightly with magnetic screw caps (Canadian Life Sciences) with PTFE-faced silicone septa (see supplementary information; Figure S1). All sealed sample vials were placed on a heating mantle set to 70 °C for 5 min to deactivate the colonies and prevent further VOC production. After colony deactivation, samples were placed in a refrigerator at 4 °C until analysis. Details of sourdough colony preparation and maintenance are presented in the supplementary information.
Sourdough Bread Preparation for DHS Extraction: Sourdough bread samples were prepared by weighing 100.0 mg (±1.5 mg) of crumb or crust into 10 mL headspace vials and capping tightly (see supplementary information; Figure S1). Samples were placed in a refrigerator at 4 °C until analysis. Details of bread preparation are presented in the supplementary information.
Experimental Design and Optimization: A DoE model was produced in Minitab 17.0 statistical software (Minitab LLC) for both sample types. Both models were constructed using the Box-Behnken approach with a three-factor design. In total, 15 DHS experiments were performed with three replicates on the centre point. A summary of DoE factors and levels is provided in Table 1. Values for each level were determined based on initial range finding experiments (data not shown).
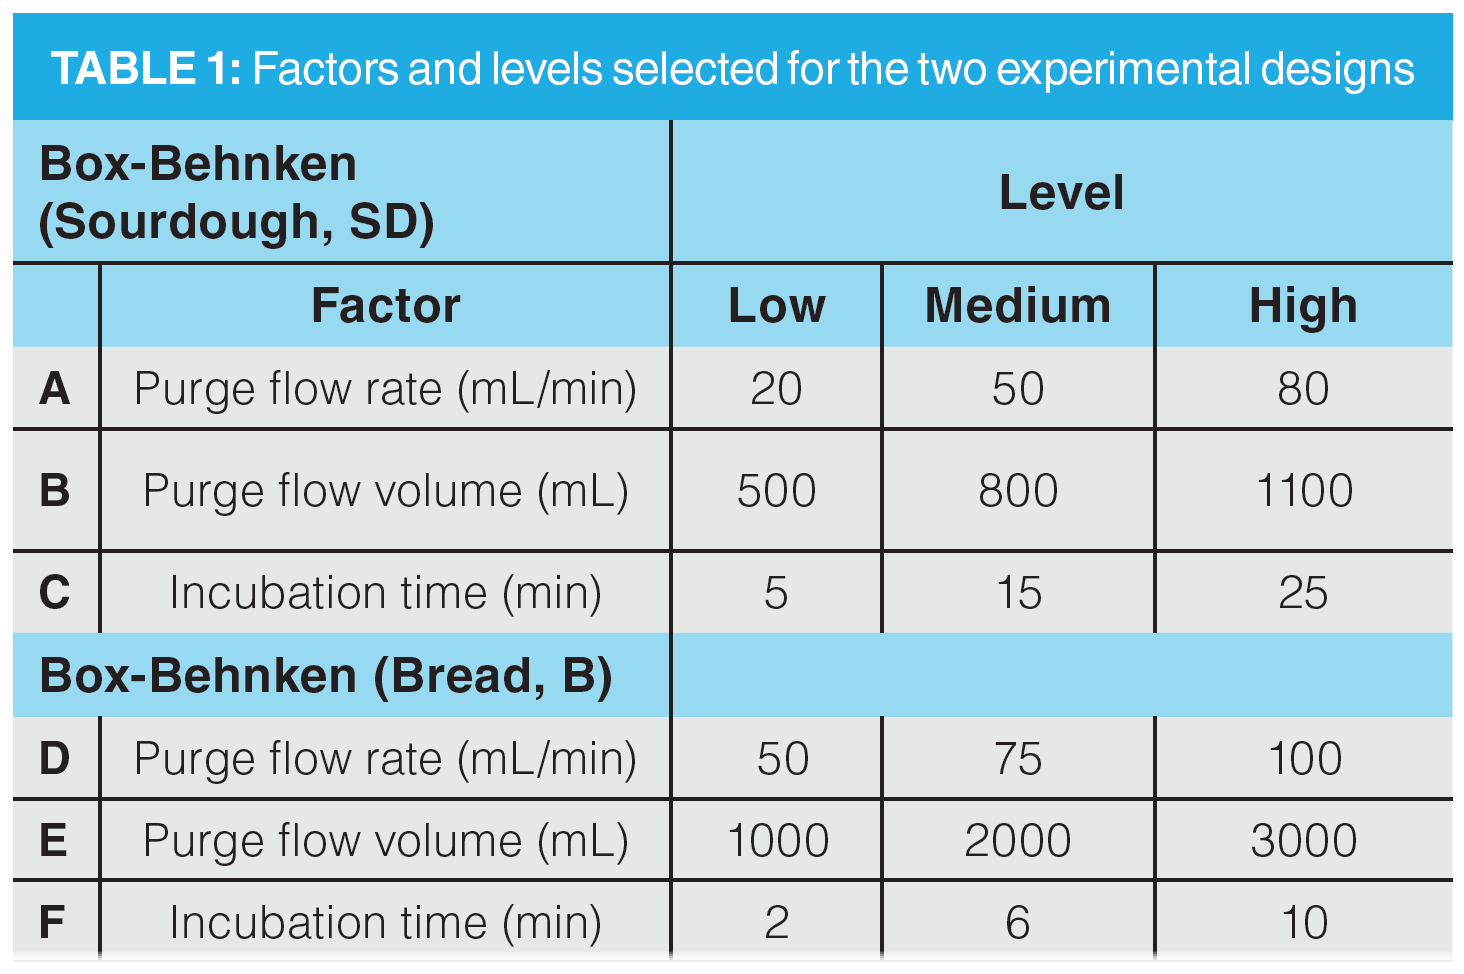
The three designated factors for DoE models were chosen based on their expected impact on the amount of volatiles extracted. Though classified as a pre-extraction parameter, incubation time is a crucial step in augmenting VOCs extraction. A minimum amount of time must pass while heating the sample to facilitate pre-equilibration of analytes with the headspace prior to purging and trapping. Though there are multiple extraction parameters, purge flow rate and purge flow volume were selected for the same rationale. An optimal volume of purge gas must be flowed at an optimal rate to maximize the amount of VOCs extracted. A more thorough discussion of the rationale for excluding other parameters from optimization is included in the supplementary information.
Modelled methods were optimized based on the total number of detected compounds and the total summed peak area of analyte signals for both sample types using response surface methodology (25,26). Briefly, this statistical method fits a predictive model to optimize a response (for example, total summed peak area) affected by different quantitative factors (purge flow rate and volume) and their interactions. The result is a response surface plot, with a local maximum calculated as the optimal level for each factor.
DHS and Sorbent Trap Desorption: Bread samples were incubated at 80 °C; sourdough colony samples were incubated at 40 °C. A trap temperature of 25 °C was selected to trap purged volatiles on Tenax TA adsorbent tubes (Gerstel). The purging gas was high-purity (4.8) nitrogen (Praxair).
DHS extraction was achieved using an Automated Dynamic Headspace Module (Gerstel). Trapped analytes were desorbed from sorbent tubes by a thermal desorption unit (TDU2, Gerstel) and cryogenically focused in a programmable‑temperature vaporization inlet (PTV; model CIS4, Gerstel) prior to GC×GC separation. Desorption of sourdough colony analytes was accomplished in solvent vent mode (at the TDU2) with the following parameters: solvent vent time 5 min, initial temperature 50 °C (hold 5 min) ramped to 250 °C at 720 °C/min and held for 10 min with a desorption flow of 75 mL/min (helium, high-purity 5.0, Praxair). Desorption of bread analytes was achieved in splitless mode (at the TDU2), and all other desorption parameters remained the same as the sourdough colony parameters. The water content of the sourdough colony samples yielded a wet headspace even when heated at 40 °C, so DHS water management steps (solvent venting) must be taken to avoid creating ice blockages between the TDU and the PTV inlet. Cryogenic focusing of analytes was maintained in the PTV, with an initial temperature of -100 °C ramped to 250 °C at 12 °C/s.
Details of other DHS parameters, GC×GC–TOF-MS analyses, and data processing are provided in the supplementary information.
Results and Discussion
The goal of this study was to develop a cost-effective, general procedure for the optimization of DHS extraction. Although previous investigations have used the DoE approach to optimize HS and DHS parameters, the factors that were selected for optimization varied significantly across the studies and were sample-specific (27−33). On average, each study used 3–5 factors with 2–3 levels per factor in order to keep the number of experiments reasonable. Out of several variables, an effective choice of factors is critical to maintain a practical number of experiments while covering a broad range of important variables. In some studies that discuss the optimization of HS/DHS parameters, the choice of factors included in DoE were not significant enough to affect the overall procedure. For example, one study included the sorbent amount as a factor to be investigated for macroalgae volatiles (27); another assessed the effect of sample weight on the extraction efficiency of melon volatiles (28). Overall, the larger adsorbent mass increased the number of compounds extracted and the overall chromatographic peak area for macroalgae. Similarly, the largest sample size of melons yielded the highest extraction efficiency. In another study, the purge flow was kept constant while other parameters of interest were varied (29). In general, the standardization of an optimization protocol would be beneficial to offer basic guidelines for new or regular users, to help fine-tune DHS parameters through DoE for any sample type.
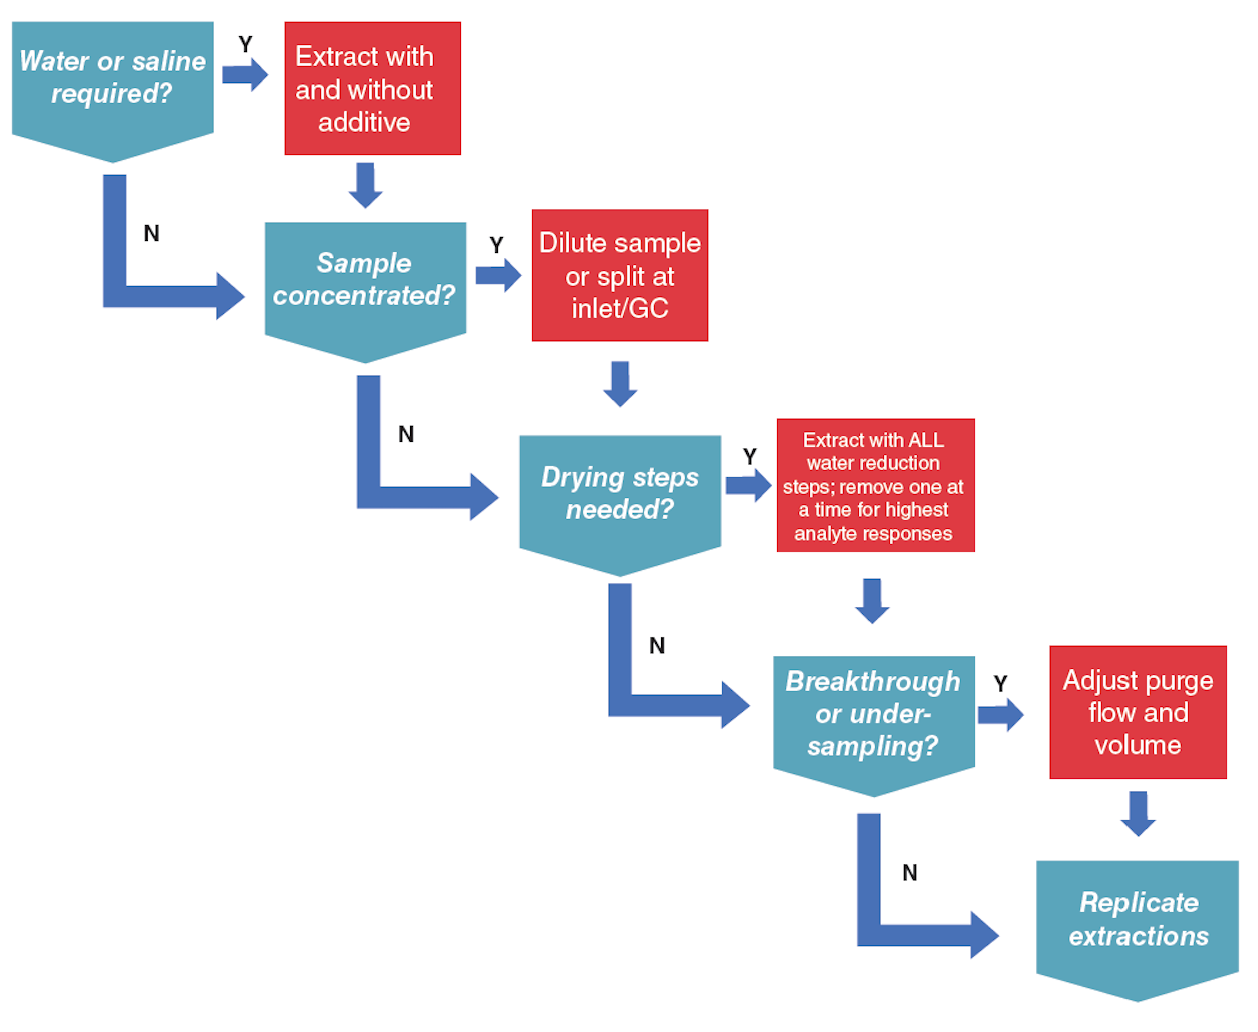
Prior to DoE, preliminary experiments must be performed for range finding, that is, appropriate ranges for factor levels must be determined before modelling. Some questions to consider prior to experimental design are provided in Figure 1.
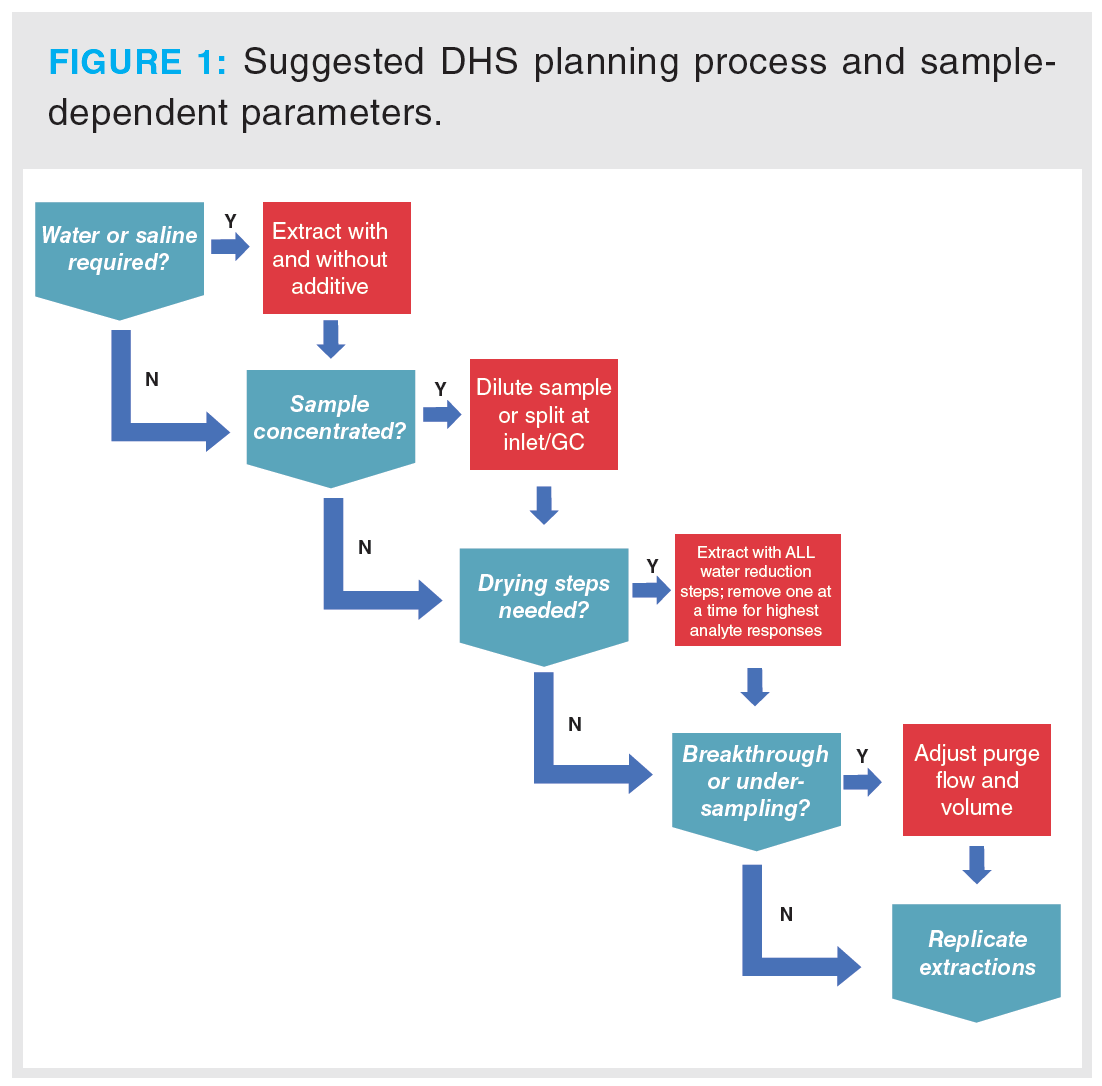
These questions (and their necessity) should be assessed on a per-study basis, since a priori knowledge of the sample and its behaviour during extraction will dictate how DHS experiments are designed. The number of experiments required will escalate rapidly as the number of factors or levels increases.
An entire DHS sampling procedure can be subdivided into three stages: equilibration, extraction, and injection. Table 2 summarizes the relevant parameters for each category.

Out of the three stages, the purge‑and-trap step (that is, extraction of volatiles) is the most crucial step for DHS optimization. The Box-Behnken design used herein focuses on optimizing the extraction parameters. After modelling, the optimal method was assessed for extraction reproducibility and the obtained VOC profile (that is, visual assessment of chromatographic patterns).
Design of Experiments Model: The entire DHS process was divided into three steps (Table 2), though a model was only constructed for the extraction step. A response surface plot was built; the sample regression equations output from the statistical software for sourdough bread (B) and colony (SD) are shown in equations 1−4. “TPA” refers to the total peak area or the total summed peak areas of analyte signals. Model coefficients for both sample types per optimizing metric are provided in the supplementary information.
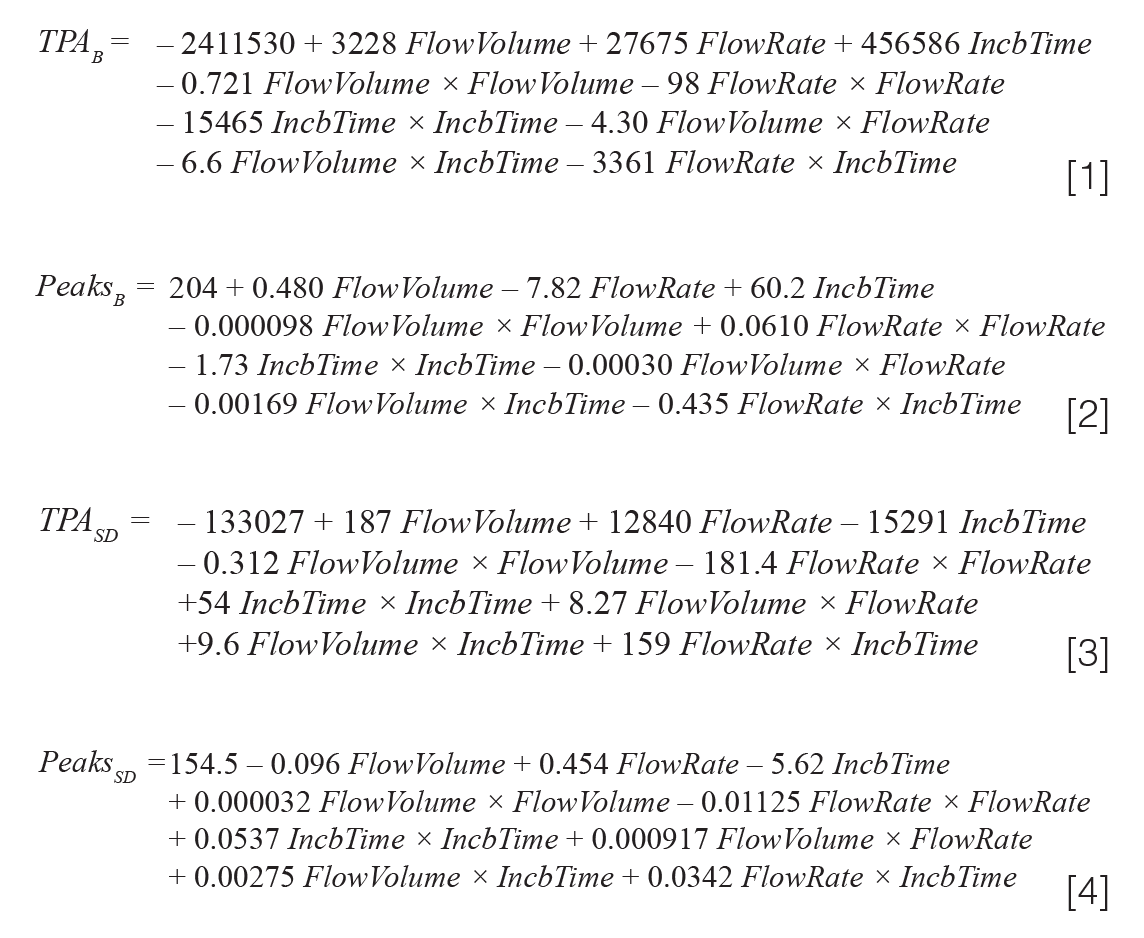
The DoE model was calculated using a system of linear equations to derive the model coefficients in equations 1–4, though these outputs offered no insight as to which factor was the most important in the modelled process. Similarly, the model coefficients and regression equations contain no specific information about optimal levels for each factor (for example, 344.3 mL DHS purge volume) (16). To visualize these relationships, Pareto charts and optimization surface plots were created in the statistical software. A Pareto chart considering the TPA of sourdough colony is provided in Figure 2. It displays not only the single factor with the most impact on the model but also the interaction(s) of two combined factors.
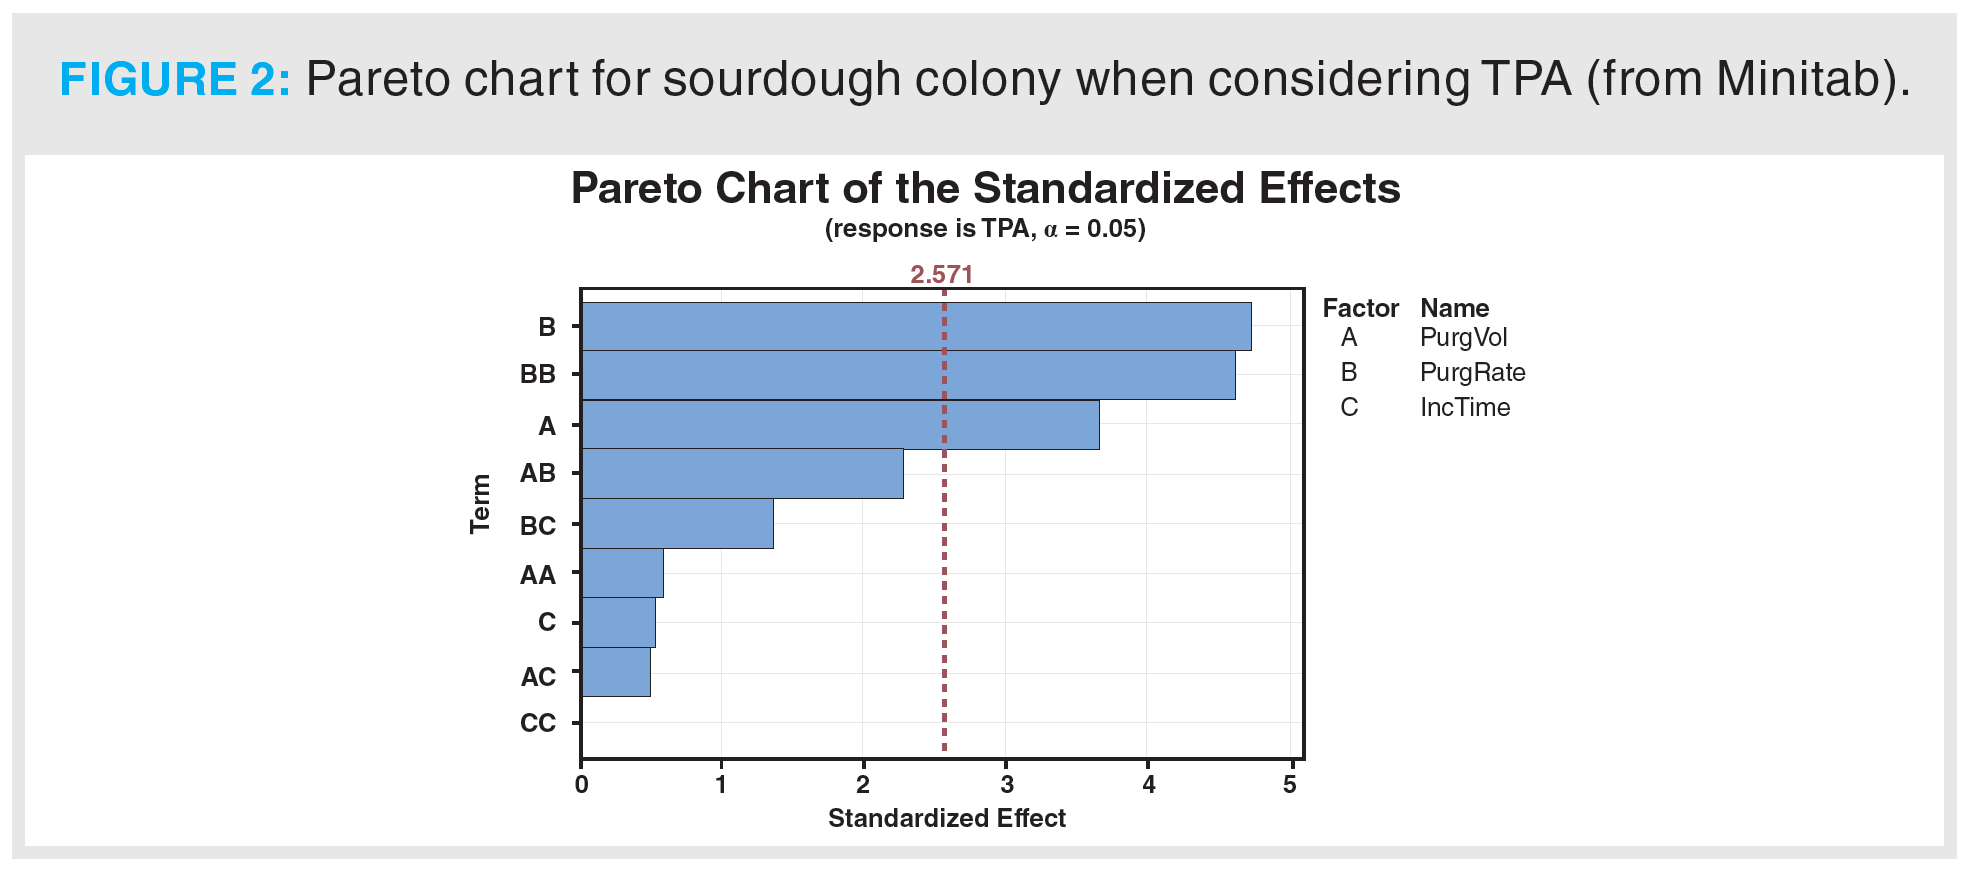
For this model, the two most important factors affecting the DHS extraction were purge flow rate and purge flow volume. The interaction between these two parameters was similarly important—the modulation of both may enhance the abundance of analytes extracted. In this case, the incubation time did not significantly influence the outcome of the extraction. More generally, the purge flow rate and purge flow volume are the two most critical factors to optimize for any DHS extraction. Pareto charts are informative, but they provide no optimized parameters: optimization surface plots are needed. A sample of these plots obtained for the sourdough bread model considering TPA is provided in Figure 3.
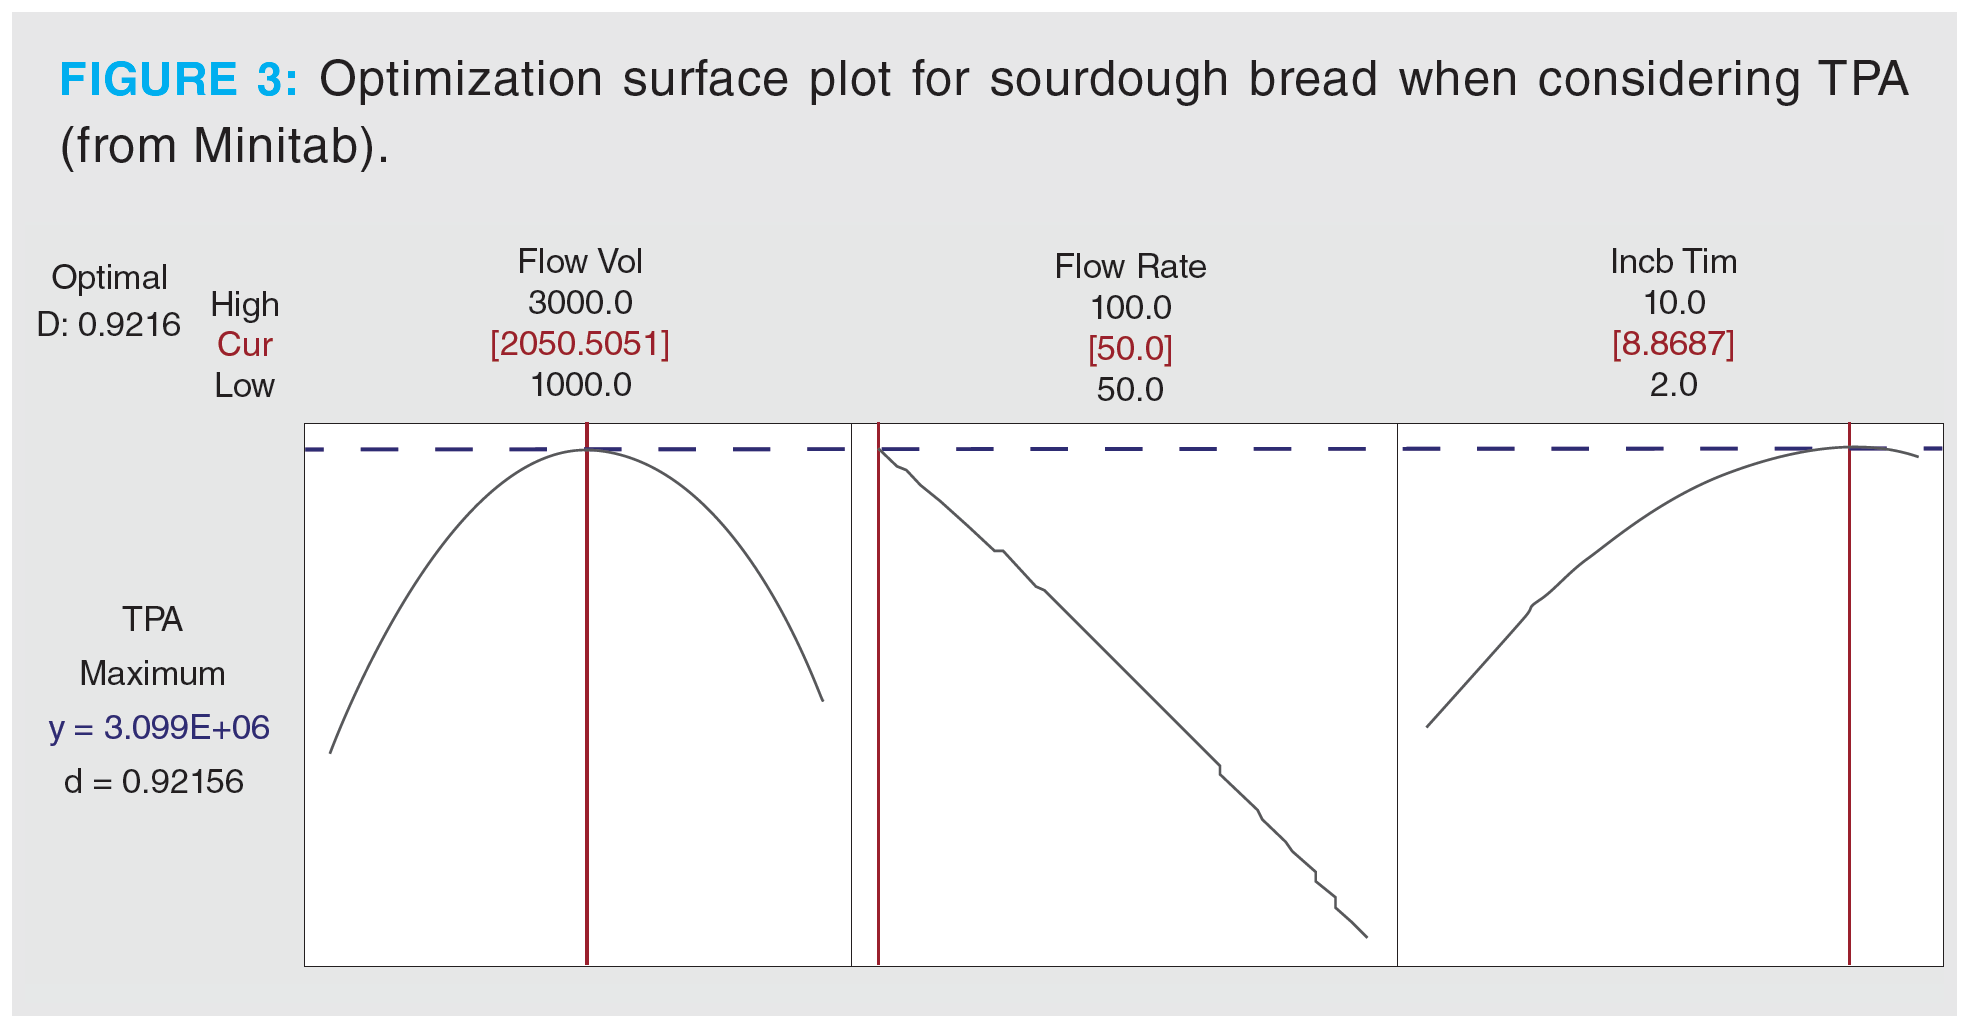
The optimized conditions for both sample types were chosen based on models considering the TPA and total number of peaks. These values from the response surface plot were rounded for convenience and to account for the autosampler control software only allowing whole numbers. The optimal regions on the plots considering both total peaks and TPA for all factors were broad enough to allow the slight adjustment. For sourdough bread samples, optimal parameters were 2100 mL purge volume, 50 mL/min purge flow rate, and 10 min incubation time. Optimal parameters for sourdough colony samples were 1100 mL purge volume, 80 mL/min purge flow rate, and 25 min incubation time. Both optimized methods were reproducible; %RSD was less than 20% for living sourdough colony and less than 9% for sourdough bread for replicate samples.
VOC Profiles of Sourdough Colony and Bread: VOC profiles of sourdough colony and bread were sampled by the optimized DHS methods. A typical chromatogram obtained from each sample type is shown in Figure 4. Automatic mass spectral filtering scripts for GC×GC–TOF‑MS omics data (34) were applied to rapidly characterize certain chemical classes present in all samples.
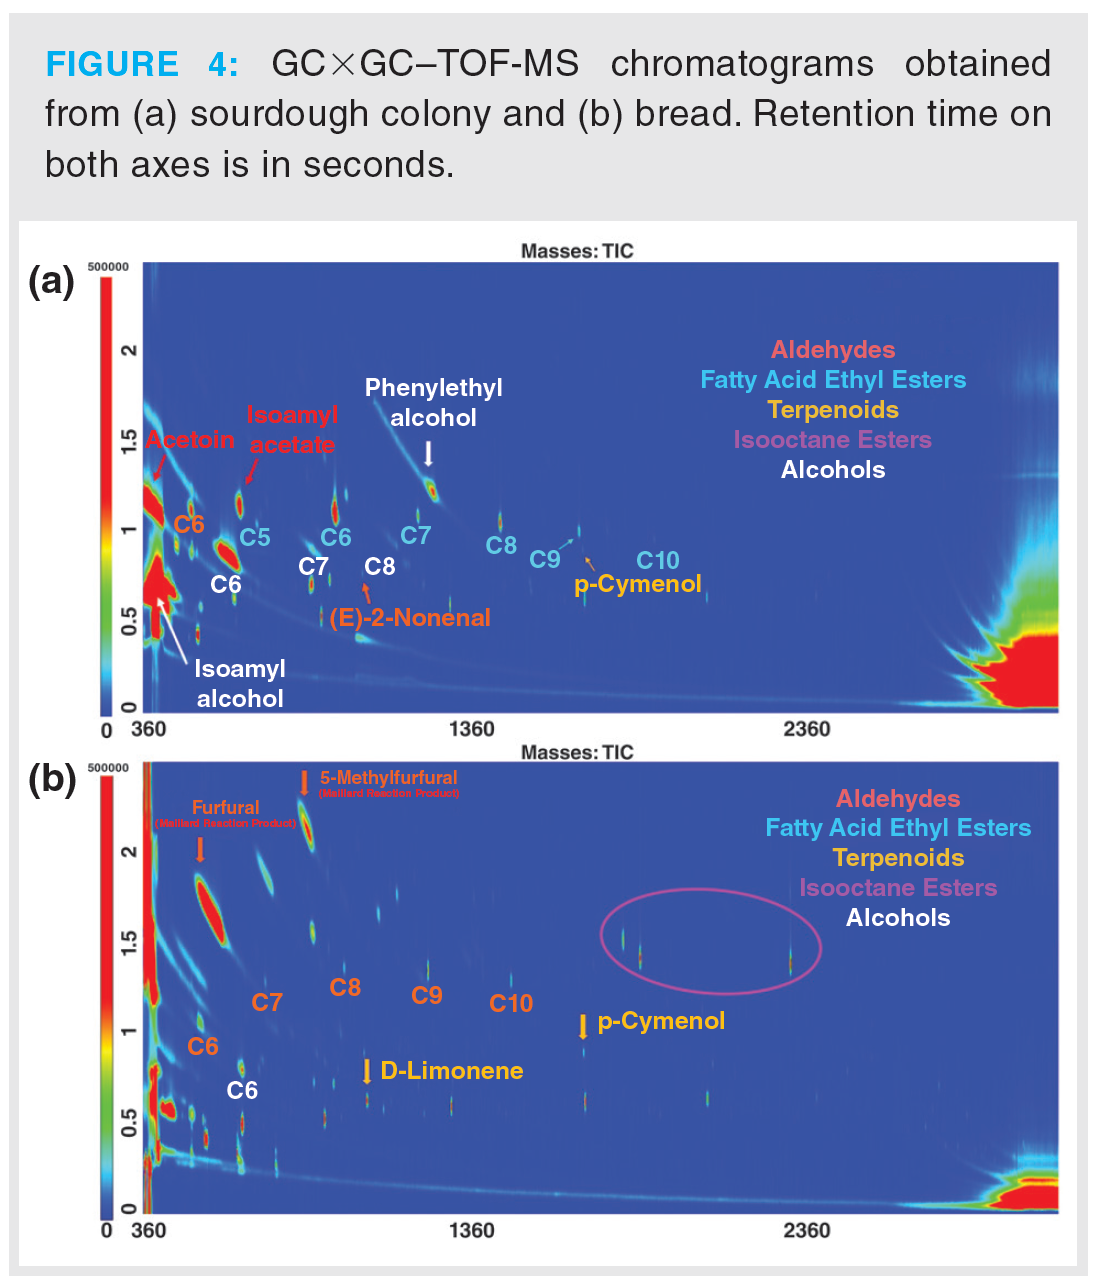
Optimized DHS methods recovered a variety of compound classes in both sample types. Chemical families such as alcohols, aldehydes, fatty acid ethyl esters, and terpenoids were the predominant classes identified by filtering scripts for GC×GC–TOF‑MS data. In colony samples, acetoin, isoamyl alcohol, and isoamyl acetate were identified; bacterial and fermentation by-products responsible for active sourdough odour were also found (35). The presence of isooctane esters (plasticizers) (36) solely in bread samples was most likely caused by the plastic bag used for sample storage. Interestingly, fatty acid ethyl esters were only detected in sourdough colony, while only their linear aldehyde equivalents were identified in sourdough bread. As expected, Maillard reaction products such as furfural and 5-methylfurfural were only detected in bread samples (37).
Overall, the general procedure laid out in this work can be summarized by a series of four steps for any sample type: plan, design, interpret, and apply. The first step is to plan the entirety of the DHS extraction process (factor selection), sample preparation, sample considerations, and range finding (Figure 1). Then, a DoE model must be constructed of factors and levels based on the range finding results, and the subsequent designed DHS experiments performed. The Box‑Behnken approach was selected by the authors to save analysis time, though other designs are equally valid. Next, results obtained from designed DHS experiments must be optimized using at least two metrics (for example, TPA and total number of peaks) to reliably interpret the optimization plots. Once an optimized method is obtained, it must be applied to replicate samples to assess extraction reproducibility and robustness.
Conclusions
In the present study, a protocol for the optimization of dynamic headspace sampling relying on multivariate experimental design was presented. Prior understanding of the entire DHS process was required for proper selection of the most significant factors in DoE models. Troubleshooting a DHS extraction was complicated; the exhaustive extraction process required many considerations based on sample type and qualities prior to analyses. Initial DHS experiments must be performed to determine suitable conditions such as sample mass, that is, concentration, addition of salt or saline solution, purge flows and volumes (breakthrough prevention), and water or humidity mitigation. Sample water content was a significant consideration that should be handled through one or a combination of the following parameters: lower extraction temperatures, lower trap temperatures, solvent venting, or DHS drying (extra gas purge). Optimized methods should be assessed for reproducibility after design. Future GC(×GC) studies that require DHS sampling should adopt a similar strategy to the one proposed here.
Supplementary Information
The link to the supplementary information can be found here: http://bit.ly/3OeXrY4
References
- M. McKay, F.F. Bauer, V. Panzeri, and A. Buica, Food Research International 128, 108878 (2020).
- K.C. Hernandes, É.A. Souza-Silva, C.F. Assumpção, C.A. Zini, and J.E. Welke, Food Additives & Contaminants: Part A 36(12), 1808–1821 (2019).
- J. Pico, M. Gómez, J. Bernal, and J.L. Bernal, Journal of Chromatography A 1428, 55–71 (2016).
- T. Dan, D. Wang, S. Wu, R. Jin, W. Ren, and T. Sun, Molecules 22(10), 1633 (2017).
- M. Lashgari, V. Singh, and J. Pawliszyn, TrAC Trends in Analytical Chemistry 119, 115618 (2019).
- K. Gorynski, TrAC Trends in Analytical Chemistry 112, 135–146 (2019).
- V. Jalili, A. Barkhordari, and A. Ghiasvand, Microchemical Journal 152, 104319 (2020).
- P.-H. Stefanuto, K.A. Perrault, L.M. Dubois, B. L’Homme, C. Allen, C. Loughnane, N. Ochiai, and J.-F. Focant, Journal of Chromatography A 1507, 45–52 (2017).
- F.A. Franchina, D. Zanella, L.M. Dubois, and J.F. Focant, Journal of Separation Science 44(1), 188–210 (2020).
- R. Demets, M. Roosen, L. Vandermeersch, K. Ragaert, C. Walgraeve, and S. De Meester, Resources, Conservation and Recycling 161, 104907 (2020).
- W. Wojnowski, T. Majchrzak, T. Dymerski, J. Gębicki, and J. Namieśnik, Journal of AOAC International 100(6), 1599–1606 (2017).
- C. Sales, T. Portolés, L.G. Johnsen, M. Danielsen, and J. Beltran, Food Chemistry 271, 488–496 (2019).
- M.A. Bezerra, R.E. Santelli, E.P. Oliveira, L.S. Villar, and L.A. Escaleira, Talanta 76(5), 965–977 (2008).
- B. Vallejo-Cordoba and S. Nakai, Journal of Agricultural and Food Chemistry 41(12), 2378–2384 (1993).
- W. Jia, R. Zhang, L. Shi, F. Zhang, J. Chang, and X. Chu, Journal of Chromatography A 1603, 67–82 (2019).
- O. Vyviurska, M. Hanobiková, A.A. Gomes, and I. Špánik, Food Chemistry 365, 130449 (2021).
- R. Rahimpoor, A. Firoozichahak, D. Nematollahi, S. Alizadeh, P.M. Alizadeh, and A.A. Langari, Microchemical Journal 166, 106229 (2021).
- A.L.H. Müller, J.A. de Oliveira, O.D. Prestes, M.B. Adaime, and R. Zanella, in Handbooks in Separation Science, Solid-Phase Extraction, C.F. Poole, Ed. (Elsevier, 2020), pp. 589–608.
- M. Cepeda-Vázquez, D. Blumenthal, V. Camel, and B. Rega, Talanta 164, 708–715 (2017).
- L. Sghaier, J. Vial, P. Sassiat, D. Thiebaut, M. Watiez, S. Breton, D.N. Rutledge, and C.B.Y. Cordella, European Journal of Lipid Science and Technology 118(6), 906–918 (2015).
- S.L.C. Ferreira, R.E. Bruns, H.S. Ferreira, G.D. Matos, J.M. David, G.C. Brandão, E.G.P. da Silva, L.A. Portugal, P.S. dos Reis, A.S. Souza, and W.N.L. dos Santos, Analytica Chimica Acta 597(2), 179–186 (2007).
- S. Plessas, A. Fisher, K. Koureta, C. Psarianos, P. Nigam, and A.A. Koutinas, Food Chemistry 106(3), 985–990 (2008).
- C. Pétel, B. Onno, and C. Prost, Trends in Food Science & Technology 59, 105–123 (2017).
- M. Gobbetti, M.S. Simonetti, A. Corsetti, F. Santinelli, J. Rossi, and P. Damiani, Food Microbiology 12, 497–507 (1995).
- A. Dean, D. Voss, and D. Draguljić. Design and Analysis of Experiments (Springer, Cham, Switzerland, 2017).
- A.I. Khuri and S. Mukhopadhyay, Wiley Interdisciplinary Reviews: Computational Statistics 2, 128–149 (2010).
- A. Maruti, E. Durán-Guerrero, C.G. Barroso, and R. Castro, Journal of Chromatography A 1551, 41–51 (2018).
- A. Fredes, C. Sales, M. Barreda, M. Valcárcel, S. Roselló, and J. Beltrán, Food Chemistry 190, 689–700 (2016).
- S. Manzini, C. Durante, C. Baschieri, M. Cocchi, S. Sighinolfi, S. Totaro, and A. Marchetti, Talanta 85(2), 863–869 (2011).
- P. Reboredo-Rodríguez, C. González-Barreiro, B. Cancho-Grande, and J. Simal-Gándara, Food Control 25(2), 684–695 (2012).
- J. Omar, M. Olivares, I. Alonso, A. Vallejo, O. Aizpurua-Olaizola, and N. Etxebarria, Journal of Food Science 81(4), C867–73 (2016).
- A.M. Vidal, S. Alcalá, A. De Torres, M. Moya, J.M. Espínola, and F. Espínola, Molecules 24(19), 3587 (2019).
- K. Dalvand and A. Ghiasvand, Analytica Chimica Acta 1083, 119–129 (2019).
- S.L. Nam, A.P. de la Mata, and J.J. Harynuk, Separations 8(6), 84 (2021).
- R.A. Peinado, J.A. Moreno, D. Muñoz, M.
Medina, and J. Moreno, Journal of Agricultural and Food Chemistry 52(21), 6389–6393 (2004). - L.E. Patton, U.S. Consumer Product Safety Commission, CPSC Staff Toxicity Review of Two Phthalates and One Phthalate Alternative for Consideration by the Chronic Hazard Advisory Panel (United States, 2011). Web Archive, Retrieved from https://www.cpsc.gov/s3fs-public/DMEP.pdf
- M. Plaza, E. Östman, and E. Tareke, European Journal of Nutrition & Food Safety 6(2), 65–74 (2016).
Ryan P. Dias is a Ph.D. candidate at the University of Alberta, currently conducting research in James J. Harynuk’s laboratory and The Metabolomics Innovation Centre (TMIC). His work involves plant metabolomics and terpene profiling by two-dimensional gas chromatography for a variety of applications. Ryan completed his B.Sc. in chemistry and forensic chemistry at Towson University in Towson, Maryland, USA.
Seo Lin Nam studied analytical chemistry at the University of Alberta under the supervision of James J. Harynuk and received her Ph.D. degree in January 2021. She is currently a postdoctoral fellow in the Harynuk laboratory. Her research focuses on metabolomics using GC×GC.
Sheri A. Schmidt is a Masters student in the Harynuk group at the University of Alberta. Her research focuses on environmental air and human breath analysis using thermal desorption and two-dimensional gas chromatography. Sheri completed her B.Sc. degree in chemistry at the University of Alberta.
A. Paulina de la Mata is an analytical chemist and the scientific coordinator for James Harynuk’s node of TMIC. Her research interests lie in chemometrics, machine learning, and developing methods for metabolomics research by GC and GC×GC.
James Harynuk is a professor of chemistry at the University of Alberta, and one of the principal investigators for TMIC. He completed his Ph.D. at the University of Waterloo in 2004, studying and developing tools in the then-emerging field of GC×GC. After completing postdoctoral research in Melbourne, Australia, he returned to Canada and joined the University of Alberta in 2007. Current research interests include the development of new software tools for handling GC×GC data.

In the present study, a gradient reversed-phase high-performance liquid chromatography (RP-HPLC) method has been designed and validated to quantify ornidazole (OZ) in the marketed formulation (oral gel) with the application of QbD.
A column with chemically modified column hardware showed improvements in analytical performance for siRNA compared to a conventional stainless-steel column.

