Is the Solution Dilution? Hidden Uncertainty in Gas Chromatography Methods
Used by chemists and nonchemists alike, gas chromatography (GC) is considered mature and among the most widely used instrumental techniques for chemical analysis. Because instruments have become both more sensitive and easier to use, columns have achieved higher resolution and stationary phases have greater selectivity. As a result, gas chromatographs have taken on a “black box” view. With greater sensitivity, resolution, and advanced data handling capabilities, a new set of experimental uncertainties emerge that may not be apparent to most users, especially those who were not formally trained as analytical chemists. In this instalment, we examine these uncertainties in typical GC methods, especially as they relate to quantitative analysis. We look at hidden experimental uncertainty, especially in the glassware used for sample preparation. We also comment on injection and detection with an eye towards understanding the sources of the errors. It is important to understand that experimental error and uncertainty are inherent in all analytical techniques; they can be reduced but cannot be eliminated.
An increasing portion of the chromatographic literature of today describes applications and quantitative analysis rather than fundamental advances in chromatographic techniques and principles. I am not offering an opinion about whether this is good or bad, but it is apparent. Articles describing chromatographic methods show quantitation at parts per billion (ppb) and lower levels are now commonplace. However, much of this literature shows common mistakes and problems with experimental uncertainty in quantitative analysis. Most commonly, uncertainties, usually in the form of standard deviations, are presented with too many significant digits. Uncertainty should be expressed in the least significant digit. The uncertainty then determines the number of significant digits in the result regardless of the number of digits provided by the data system. Often, I see both uncertainties and quantitative results presented with too many significant digits.
In addition to this first challenge, the basic reporting of results often confuses the presentation of both the experimental result and the uncertainty. Classically, results larger then 10 and smaller than 0.1 should be reported using scientific notation. This guideline is often stretched to 0.01–100, but it should not be stretched further. Strict adherence to this rule by itself reduces confusion in result reporting and significant figures.
An additional challenge relates to the common use of the standard deviation and relative standard deviation (RSD) as a figure of merit for the precision of chromatographic results. As we know from basic population statistics, one standard deviation from the mean indicates that approximately 68% of results should be expected to be in that range. The true experimental uncertainty is larger, typically around two standard deviations, which would include approximately 95% of the results, or three standard deviations, which would include about 99.7% of expected results. However, most quantitative analytical chemistry experiments do not generate enough results for population statistics, so these generalizations do not hold. Classically, as taught in quantitative and instrumental analysis texts for decades, a 95% confidence interval about the data is best used as the experimental uncertainty, which for small populations of data would be significantly wider than one standard deviation. In much of the chromatography literature, this additional step is not performed. In short, much of the literature underestimates experimental uncertainty and overestimates significant figures.
This observation is not to denigrate the work of the many scientists developing and optimizing gas chromatography (GC) methods. Because GC has become increasingly popular over the years, it has gone from a technique largely performed by formally trained analytical chemistry specialists to a much broader range of scientists, who may not have had formal training in quantitative analysis and analyzing experimental error and uncertainty. In the rest of this instalment, we examine some common cases where experimental uncertainty arises in GC methods.
Dilute-and-Shoot
Even simple “dilute-and-shoot” methods have hidden experimental uncertainties. We start with this case because nearly all other sample preparation techniques and methods involve dilution in the preparation of samples and standards. Many analysts make the incorrect assumption that volumetric glassware is perfect. Figure 1 shows a close-up look at a typical “Class A” 100 mL volumetric flask, with the class indication circled. For any volumetric glassware, it is best to use Class A glassware and avoid any glassware that does not indicate class or has the markings worn off. If you look closely, you can note the uncertainty value of ±0.08 mL provided in the printing on the flask. Although the uncertainty seems small, the rules for propagation of errors tell us that each additional dilution step will add to the experimental uncertainty of the result.
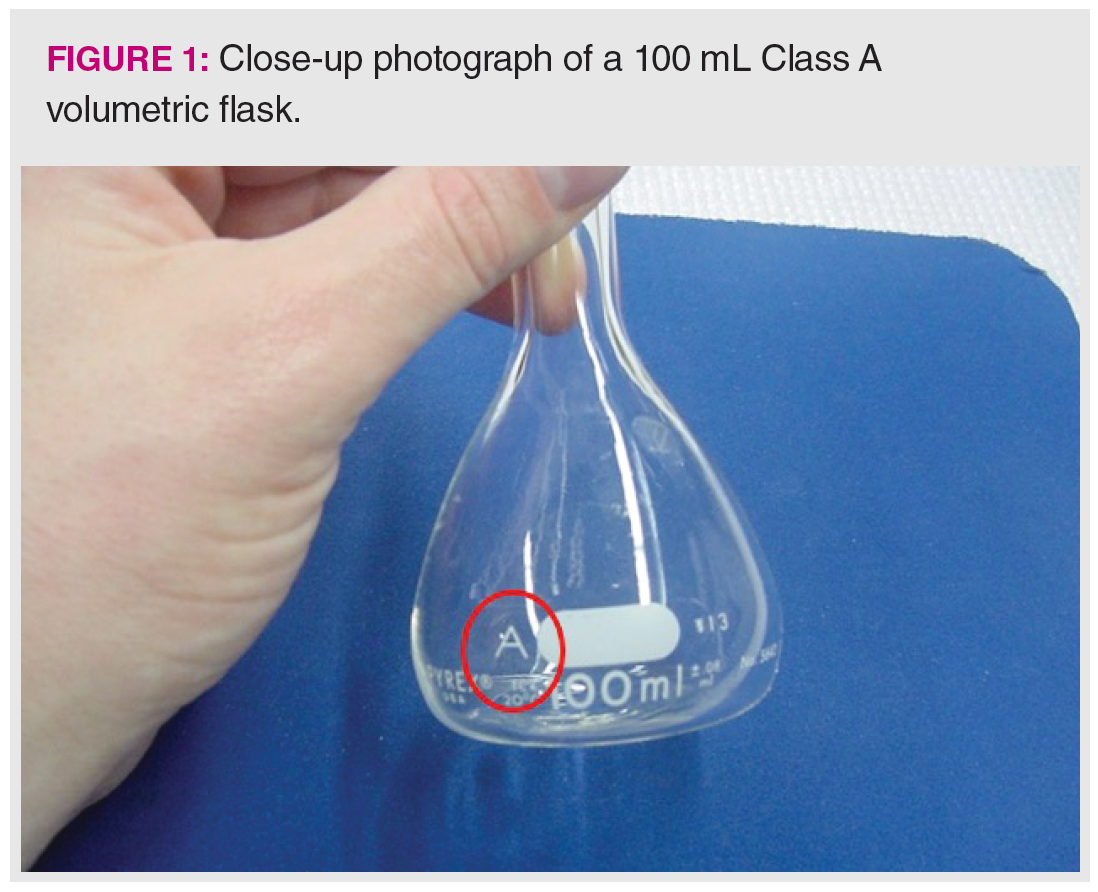
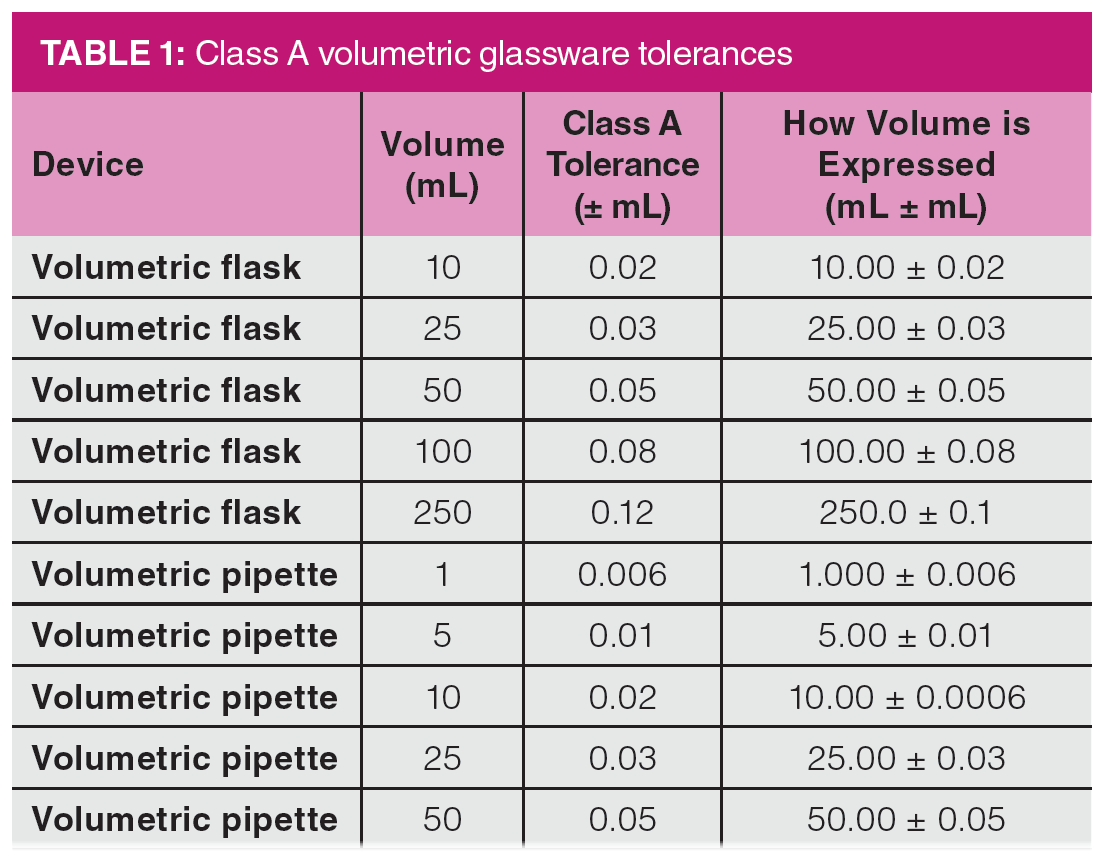
Table 1 shows the uncertainties involved with some Class A volumetric flasks and transfer pipettes. It illustrates one of the interesting problems in analytical method development. Because we are pressured to reduce the use of solvents, smaller volumes introduce higher relative experimental errors in each step. Table 1 shows that there is flask-to-flask and pipette-to-pipette experimental uncertainty involved with volumetric glassware that must be considered when developing methods. Drawing a sample to the mark in a pipette or filling to the mark in a flask may not deliver the exact volume stated on the device. To this end, experimental procedures for gravimetrically verifying the volume delivered by a pipette or contained in a flask have been published by the National Institute of Standards and Technology (NIST) (1).
Consider the experimental uncertainty involved in a 1:100 dilution of a pre-prepared stock standard solution by two different procedures. In the first procedure, a 1-mL class A transfer pipette is used to deliver 1 mL of the stock solution into a 100-mL class A volumetric flask and the flask is filled to the mark with the dilution solvent. In the second procedure, a 1-mL class A transfer pipette is used to deliver 1 mL of the stock solution into a 10-mL class A volumetric flask that is filled to the mark with the dilution solvent. Using a second 1-mL class A transfer pipette, 1 mL of the diluted solution is then transferred to a second 10-mL Class A volumetric flask, which is then filled to the mark with the dilution solvent. In procedure 1, a total of about 100 mL of dilution solvent is used; in procedure 2, the amount of dilution solvent is reduced by 80% to about 20 mL. Table 2 shows the propagation of errors comparison of procedures 1 and 2. Detailed equations and discussion of propagation of errors are not provided here but can be referenced in nearly any textbook on analytical chemistry or instrumental analysis (2). In the chapter in reference 2, I share a specific example of a propagation of error analysis applied to a pharmaceutical analysis method. Table 2 shows that the serial dilution procedure increases the uncertainty from 0.6% to 0.9% over the single dilution, which is an increase of 50% in the uncertainty.

As seen in Table 2, the serial dilution procedure, which most analysts would prefer today because it uses far less solvent, has significantly higher experimental uncertainty, and this experimental uncertainty would then be added to any uncertainty in the stock standard. Note that when making extremely low concentration standards, which is a common need with
the extremely sensitive methods and instruments of today, the experimental uncertainty involved in using even the most precise available glassware to prepare standards and samples in multiple dilution steps can lead to relatively large uncertainties that may reduce the number of significant figures in the experimental results. As a result, it is likely that any determinations at sample concentrations lower than parts per million (ppm) level should be reported with no more than one or two significant figures.
Uncertainty In Sample Injection
The inlet and injection process in GC is well-known to provide hidden uncertainty, as discussed in two recent “GC Connections” instalments and a classic book (3–5). As discussed above, as pipettes and sample delivery system volumes get smaller, relative experimental uncertainty in the delivered volume increases. Most microlitre-volume syringes are accurate to approximately 1% of their nominal maximum volume. A typical 10 μL syringe has graduations representing 0.1 μL. Interestingly, it is common to inject 1 μL of liquid using a 10 μL syringe, providing a nominal error of up to 10% in the accuracy of the delivery. Furthermore, the graduations on the syringe barrel do not account for the internal volume of the syringe needle, which is approximately 0.6 μL. Therefore, our 1 μL injection using a 10 μL syringe may be an injection of 1.5–1.7 μL, depending on the accuracy of the syringe.
With the use of an auto-injector and proper maintenance, a syringe can remain highly reproducible for hundreds or possibly thousands of injections. Syringe manufacturers provide quick guides on how to take care of and perform maintenance on syringes (6) that include suggestions for extending syringe lifetime. With the high precision of auto-injectors, users can typically expect injections with less than 1% RSD in the resulting peak areas from injection to injection. Difficulty can arise when the syringe is changed; you can expect peak areas to vary by several percentage points up or down from the original syringe. With effective calibration, and either internal or external standard, this change may not be noticed unless working at or near the limit of detection (LOD) or limit of quantitation (LOQ), where a few percent of reduced injected sample volume might move results lower than the LOD or LOQ.
Uncertainty in Detection and Quantitation
In a recent instalment, we discussed several hidden challenges in measuring the LOD for an instrument or as part of the method validation process (7). We saw that the classical International Union of Pure and Applied Chemistry (IUPAC) calculation for LOD includes terms only related to uncertainty in the measured signal, not in the calibration curve. We saw an alternate calculation, based on propagation of errors, for determining the LOD that includes terms for uncertainty in both the slope and y-intercept of the calibration curve. Earlier in this column, we discussed uncertainty in simple “dilute-and-shoot” procedures, which are often similar to the procedures used to generate calibration curves.
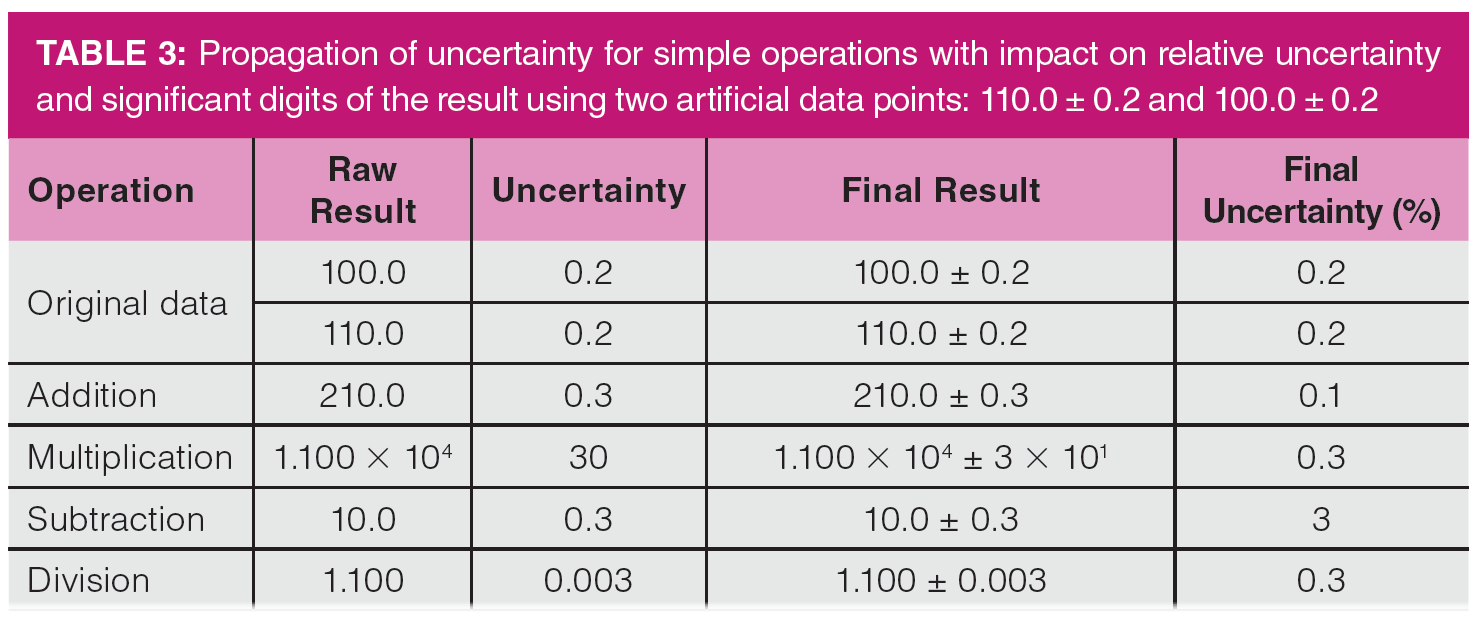
In general, greater increases in experimental uncertainty from calculations occur when subtraction and division are used in equations and formulas. In both cases, the calculation result becomes smaller while the uncertainty becomes larger. Table 3 illustrates this principle with some simple calculations, in which the values 1.100 × 10² ± 0.2 and 1.000 × 10² ± 0.2 are combined by addition, subtraction, multiplication, and division. Note that both initial values would be seen as highly precise. As seen in Table 3, the original data have a relative uncertainty of 0.2%. When the data points are multiplied or divided, the uncertainty is determined from the relative uncertainties, so the final uncertainty is the seam on a relative basis for both. Since experimental uncertainties are additive for addition and subtraction, adding the two data points results in a decreased relative uncertainty as the result increases faster than the uncertainty. However, subtracting them results in a much greater relative uncertainty, since the result is now smaller and the uncertainty larger. In this case, the four significant figure original data are reduced to three in the result. The relative experimental uncertainty increases from a fraction of a percent to nearly 3% in the subtraction case. When I examine GC methods with unsatisfactory reproducibility, the first places to look for the source of the problem are calculations and glassware choices, followed by injection and detection.
Error analysis and the consideration of experimental uncertainty may seem like a chore. However, it is one of the most important aspects of method development, optimization, and validation. GC instruments and data systems are highly precise, and they generate raw data that may have three, four, or more significant figures. In the past, we would look first at potential instrumental challenges when troubleshooting and optimizing problems with precision and accuracy. Today, I look first at the glassware and calculations, followed by the instrument. Chromatographers should be cautious and recognize that there are hidden uncertainties in almost all quantitative chromatographic methods that may increase experimental uncertainty, reduce the number of significant figures, and make the data coming from the data system look more precise and accurate than it really is.
References
- G.L. Harris and M.R. Miller, NISTIR 7383: Selected Procedures for Volumetric Calibrations (2019 Edition) (National Institute of Standards and Technology, Gaithersburg, Maryland, USA, 2019).
- G.D. Christian, P.K. Dasgupta, and K.A. Schug, Analytical Chemistry 7th Edition (John Wiley and Sons, Hoboken, New Jersey, USA, 2013), pp. 81.
- N.H. Snow, LCGC Europe 35(3), 98–102 (2022).
- N.H. Snow, LCGC Europe 33(7), 347–351 (2020).
- K. Grob, Split and Splitless Injection for Quantitative Gas Chromatography: Concepts, Processes, Practical Guidelines, Sources of Error, 4th, Completely Revised Edition (John Wiley and Sons, Hoboken, New Jersey, USA, 2008).
- Hamilton Company, Guide, Syringe Care and Use, https://www.hamiltoncompany.com/laboratory-products/support/documents/care-and-use-guide. (Accessed April 2022).
- N.H. Snow, LCGC Europe 34(5), 189–196 (2021).
About the Author
Nicholas H. Snow is Founding Endowed Professor in the Department of Chemistry and Biochemistry at Seton Hall University, USA, and Adjunct Professor of Medical Science. Direct correspondence to: amatheson@mjhlifesciences.com



Determining the Effects of ‘Quantitative Marinating’ on Crayfish Meat with HS-GC-IMS
April 30th 2025A novel method called quantitative marinating (QM) was developed to reduce industrial waste during the processing of crayfish meat, with the taste, flavor, and aroma of crayfish meat processed by various techniques investigated. Headspace-gas chromatography-ion mobility spectrometry (HS-GC-IMS) was used to determine volatile compounds of meat examined.
2 Commerce Drive
Cranbury, NJ 08512

.png&w=3840&q=75)

.png&w=3840&q=75)


.png&w=3840&q=75)


.png&w=3840&q=75)