Multi-Attribute Monitoring of Therapeutic mRNA by Liquid Chromatography–Mass Spectrometry
Therapeutic mRNA is receiving growing interest in various therapeutic applications such as genome editing, cancer immunotherapy and prophylactic vaccines. As with other drugs, it is essential to guarantee product quality. Among the critical quality attributes of therapeutic mRNA, characterization of the capping and poly(A) tail are of the greatest importance because of their involvement in mRNA stability and in the efficiency of protein synthesis. This article presents a method for the simultaneous characterization of both attributes in a single sample preparation workflow. The method involves lipid extraction, various RNAse enzymes, purification steps and LC–MS to analyze the capping and poly(A) tailing.
Therapeutic messenger RNA (mRNA) have emerged as a game-changer in medical science (1), offering transformative approaches in the creation of prophylactic vaccines and gene therapies. Unlike traditional vaccines, which use attenuated viruses or antigenic proteins to elicit immune responses, mRNA-based vaccines deploy sequences encoding specific antigens to induce robust immunological defence against targeted pathogens. This approach not only streamlines vaccine development but also enables rapid adaptation to emerging epidemics and mutated virus variants (2). Beyond vaccines, the utility of therapeutic mRNA extends to gene therapy (3), providing a strategy to correct or replace defective genes associated with genetic disorders, and in innovative approaches to treat certain cancers. Therapeutic mRNAs are commonly encapsulated in lipid nanoparticles to facilitate their delivery to cellular ribosomes, where they are translated into polypeptide sequences. Structurally, a mRNA molecule consists of a central open reading frame (ORF) flanked by 5’ and 3’ untranslated regions (UTRs). Critical to mRNA functionality are two terminal features: the 5’-cap and the 3’-poly(A) tail.
The 5’-cap serves multiple roles, including the protection of mRNA from exonuclease-mediated degradation and facilitation of ribosomal binding during translation initiation. This cap is primarily composed of 7-methylguanosine (m7G) connected via a 5’ to 5’ triphosphate linkage to the mRNA’s first nucleotide. Depending on the methylation status of this first nucleotide, two distinct structures—Cap0 (unmethylated) and Cap1 (methylated)—may form. Cap1 mRNA, which is the expected structure, can be produced through either post-transcriptional enzymatic capping, in which the cap is added through several enzymatic reactions after the transcription reaction, or co-transcriptional incorporation of a cap analog (4).
The 3’ poly(A) tail, a series of adenine nucleotides, protects mRNA from degradation by exonucleases and improves its translation efficacy by interacting with key proteins in the translation machinery (5). This tail can be either directly encoded in the DNA template for in vitro transcription or enzymatically added post-transcription using poly(A) polymerase (6).
Given their importance for obtaining a fully functional therapeutic mRNA, capping efficiency, that is, the percentage of Cap1 structure obtained after in vitro transcription and poly(A) tail length distribution are two critical quality attributes (CQAs) for mRNA drug substance purity (7). Sequencing approaches could be used to obtain poly(A) tail length information using methods such as TAIL-seq, PAL-seq, or RT-PCR but they are not recommended for this purpose by USP (8,9). While liquid chromatography methods to analyze these CQAs exist, they often require specific primers for hybridization and rely on RNAse H (10,11), requiring adjustments for each cap and poly(A) tail to be analyzed and lacking a universal platform for assessment. Recently, Gilar et al. released a method based on RNAse T1 digestion and SEC or RP separation of the digests obtained (12). Traditional quality assessment often demands substantial sample volumes and extensive use of instruments. The development of rapid, innovative techniques requiring limited sample amounts is crucial. Such advancements not only preserve material but also free up mass spectrometer time, yielding significant operational benefits and cost reductions. By providing results on multiple quality attributes swiftly, these methods hold the promise to markedly enhance the quality assessment process, meeting the growing demands of various industries and regulatory standards.
In this study, we introduce optimised methodologies for the comprehensive characterisation of poly(A) tail length and capping structures. By refining sample preparation protocols, a single workflow has been developed that allows simultaneous assessment of both CQAs, thereby minimizing sample usage and reducing experimental time. This approach leverages a combination of multiple RNases, a purification step, and liquid chromatography–mass spectrometry (LC–MS) for detailed analysis. Additionally, an optimized extraction step has been incorporated to facilitate the characterization of lipid formulations in drug products.
Materials and Methods
Chemicals and Reagents:
Isopropanol, ammonium acetate, ADP, ATP, GDP, GTP, dibutylamine, dibutylammonium acetate, and formic acid were purchased from Sigma Aldrich. Acetonitrile, methanol, and hexafluoroisopropanol were purchased from Biosolve. RNA purification kit (61006), RNAse T1 (1000 U/μL) and RNAse free water were purchased from Thermo Scientific. Nuclease P1 (100 U/μL) and several cap (GG, GA, m7GG, m7GA, ARCA) were obtained from New England Biolabs. CleanCap Reagent AG (N-7113) as well as Cas9 mRNA (used for both method development and as drug substance – L7206) were purchased from TriLink BioTechnologies. LNP-encapsulated mRNA was provided by collaborators (undisclosed composition).
Extraction of mRNA from Drug Product:
mRNA is extracted using isopropanol precipitation. 20 μg mRNA equivalent of LNP-encapsulated mRNA are diluted in 900 μL 60 mM ammonium acetate in isopropanol, vortexed thoroughly and centrifuged 15 min at 14,000 g. Supernatant is collected for lipid analysis. The pellet is mixed with 1 mL of isopropanol (IPA), vortexed thoroughly and centrifuged 15 min at 14,000 g. The pellet is resuspended in RNAse-free water for further preparation steps.
Immobilization of mRNA on Poly-(dT) Beads:
4 μg of extracted drug product (DP) mRNA or 2 μg of Cas9 mRNA is hybridized with 200 μL of poly-d(T) immobilized on magnetic beads (RNA purification kit) during 10 min at room temperature. The flowthrough of this step is used for the analysis of the residual triphosphate nucleotides in the samples from the mRNA synthesis (using the LC– MS analysis method of 5’-cap)—as much volume as possible is injected to increase the probability to quantify residuals.
On-Bead mRNA Digestion:
First digestion is performed using 1 μL of RNAse T1 and 19 μL of water during 2 h at 37 °C under agitation. Flowthrough is collected and further digested using 1 μL of Nuclease P1 and 1 μL of Nuclease P1 reaction buffer during 30 min at 37 °C under agitation (700 rpm). This digest is analyzed using LC–MS analysis of 5’-cap. Poly(A) tails are eluted by heating the beads at 70 °C in 22 μL of water during 8 min and the flowthrough is analyzed.
In-Solution Digestion of mRNA for 5’-Cap Analysis:
10 μg of Cas9 mRNA are digested using 1 μL of Nuclease P1 and 1 μL of Nuclease P1 reaction buffer, during 30 min at 37 °C under agitation (700 rpm). Enzyme is inhibited by heat inactivation at 70 °C during 10 min under agitation (700 rpm).
In-Solution Digestion of mRNA for 3’-Poly(A) Tail Analysis:
10 μg of Cas9 mRNA are digested using 1 μL of RNAse T1, during 30 min at 37 °C under agitation (700 rpm).
Preparation of 5’-Cap Standard Solutions:
5 μL of CleanCap AG were digested with 5 μL of Nuclease P1 and 5 μL of Nuclease P1 reaction buffer, during 30 min at 37 °C under agitation (700 rpm). All caps were prepared at 1 mM in water and mixed at equimolar concentration together (10 nM). Further dilutions were performed to inject between 1 fmol and 10 nmol of each cap.
LC–MS Analysis of 5’-Cap:
Samples (10 μg for method development, 4 μg for DS and 2 μg for DP) are loaded on a Waters Premier BEH Oligonucleotides C18 (100 × 2.1 mm, 1.7-μm particles) and eluted using a 20 min gradient from 5% to 33.6% of solvent B (Solvent A: 5 mM dibutylammonium acetate – Solvent B: acetonitrile) at 0.2 mL/min, 30°C, on a Waters Acquity H-Class bio. Waters Xevo G2-XS QTof is coupled online with the UPLC system and is operated in multiple reaction monitoring (MRM) negative mode. Source parameters were set as follows: capillary voltage: 1.5 kV; cone voltage: 30 V; cone gas flow: 100L/h; desolvation gas flow: 500L/h; source temperature: 100 °C; desolvation gas temperature: 350 °C. Mass range was set to 50-4000 Th, scan time to 0.5 s and fragmentation energy (high energy ramp) from 20.00 to 40.00 eV.
LC–MS Analysis of 3’-Poly(A) tail:
Samples (10 μg for method development, 4 μg for DS and 2 μg for DP) are loaded on an Agilent PLRP-S 1000Å (50 × 2.1 mm, 5-μm particles) and eluted using a 10 min gradient from 15% to 45% of solvent B (Solvent A: 15 mM dibutylamine, 25 mM hexafluoroisopropanol in water – Solvent B: 15 mM dibutylamine, 25 mM hexafluoroisopropanol in methanol) at 0.4 mL/min, 80°C, on a Waters Acquity H-Class bio. Waters Xevo G2-XS QTof is coupled online with the UPLC system and is operated in negative MSE mode. Source parameters were set as follows: capillary voltage: 2.5 kV; cone voltage: 150 V; cone gas flow: 200L/h; desolvation gas flow: 500L/h; source temperature: 100°C; desolvation gas temperature: 350 °C. Mass range was set to 400–4000 Th, scan time to 1 s and fragmentation energy (high energy ramp) from 20.00 to 45.00 eV.
LC–MS Analysis of Lipids:
Samples are loaded on a Waters Premier CSH Phenyl- Hexyl (50 × 2.1 mm, 1.7-μm particles) and eluted using a 6 min gradient from 60% to 90% of solvent B (Solvent A: 0.1% formic acid in water – Solvent B: 0.1% formic acid in ACN) at 0.4 mL/min, 50 °C, on a Waters BioAccord system (13). The system was operated in positive mode using an acquisition range of 50–2000 Th. Capillary voltage was set to 1.5 kV, cone voltage to 30 V with a fragmentation cone voltage of 100–150 V, a desolvation temperature of 350 °C, and a scan rate of 1 Hz.
Data Processing:
Data processing is performed using UNIFI integrated identification and quantification modules. Poly(A) tailing deconvoluted spectra are further processed using homemade python script. Capping analysis was performed by extracting signal for each cap in both samples and calibration standard solutions. Generation of calibration curves was performed automatically within UNIFI and were used to correct and determine concentrations of cap.
Results
Development of Methods:
Analytical methods were developed and refined using a commercially available Cas9 mRNA as the test subject. The manufacturer specifies that this mRNA is co-transcriptionally capped, resulting in the presence of Cap1 (m7GpppAm2) structures. However, no information was provided concerning the length of the poly(A) tail.
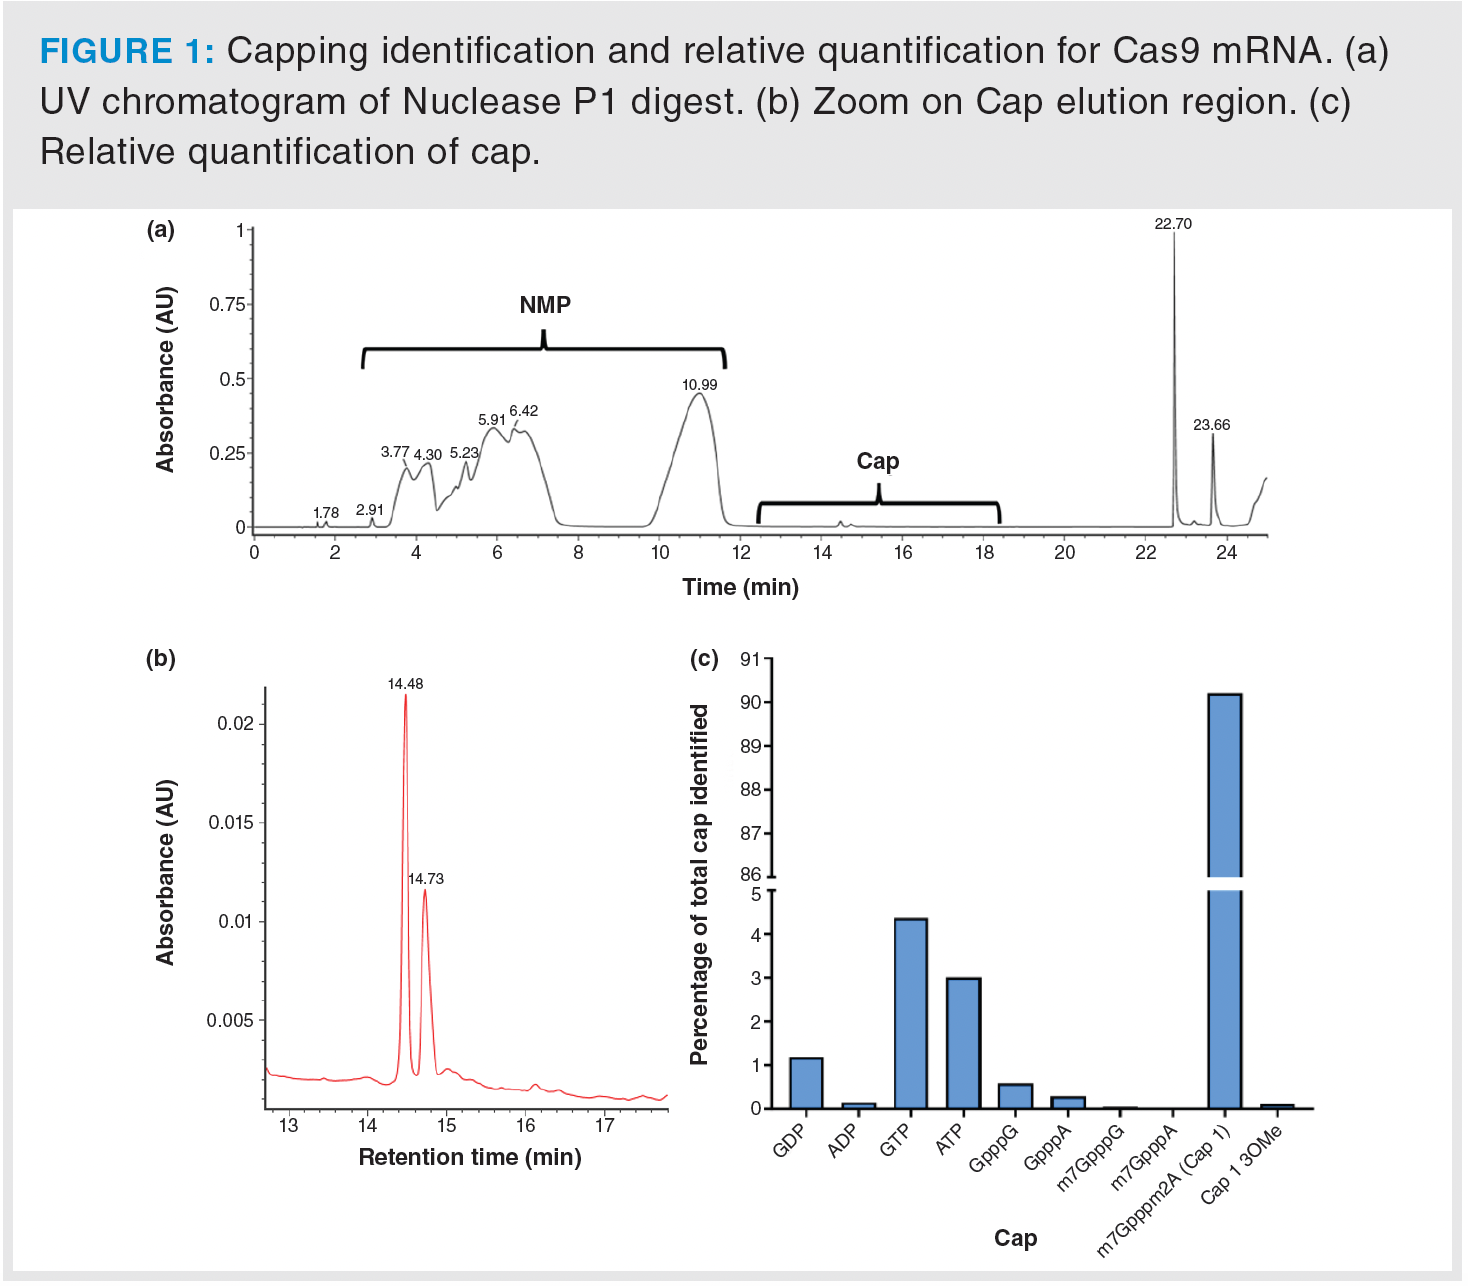
For capping analysis, Nuclease P1 was used in the sample preparation stage because it cleaves all phosphodiester bonds involving only one phosphate group, leaving the triphosphate of the cap intact. To achieve effective separation of various cap species from nucleotide monophosphates (NMPs)—the most abundant molecules produced post-digestion—a di-butylaminoacetic acid (DBuAA) gradient was used. As depicted in Figure 1a and 1b, this gradient successfully segregated all potential cap species from NMPs. Using cap standard curves and UNIFI’s automated process, mRNA sample cap abundancies were computed and capping percentages quantified. The analysis revealed that 90.2% of the Cas9 mRNA was capped with Cap1 (Figure 1c), a result consistent with expectations based on the co-transcriptional capping method employed by the manufacturer.
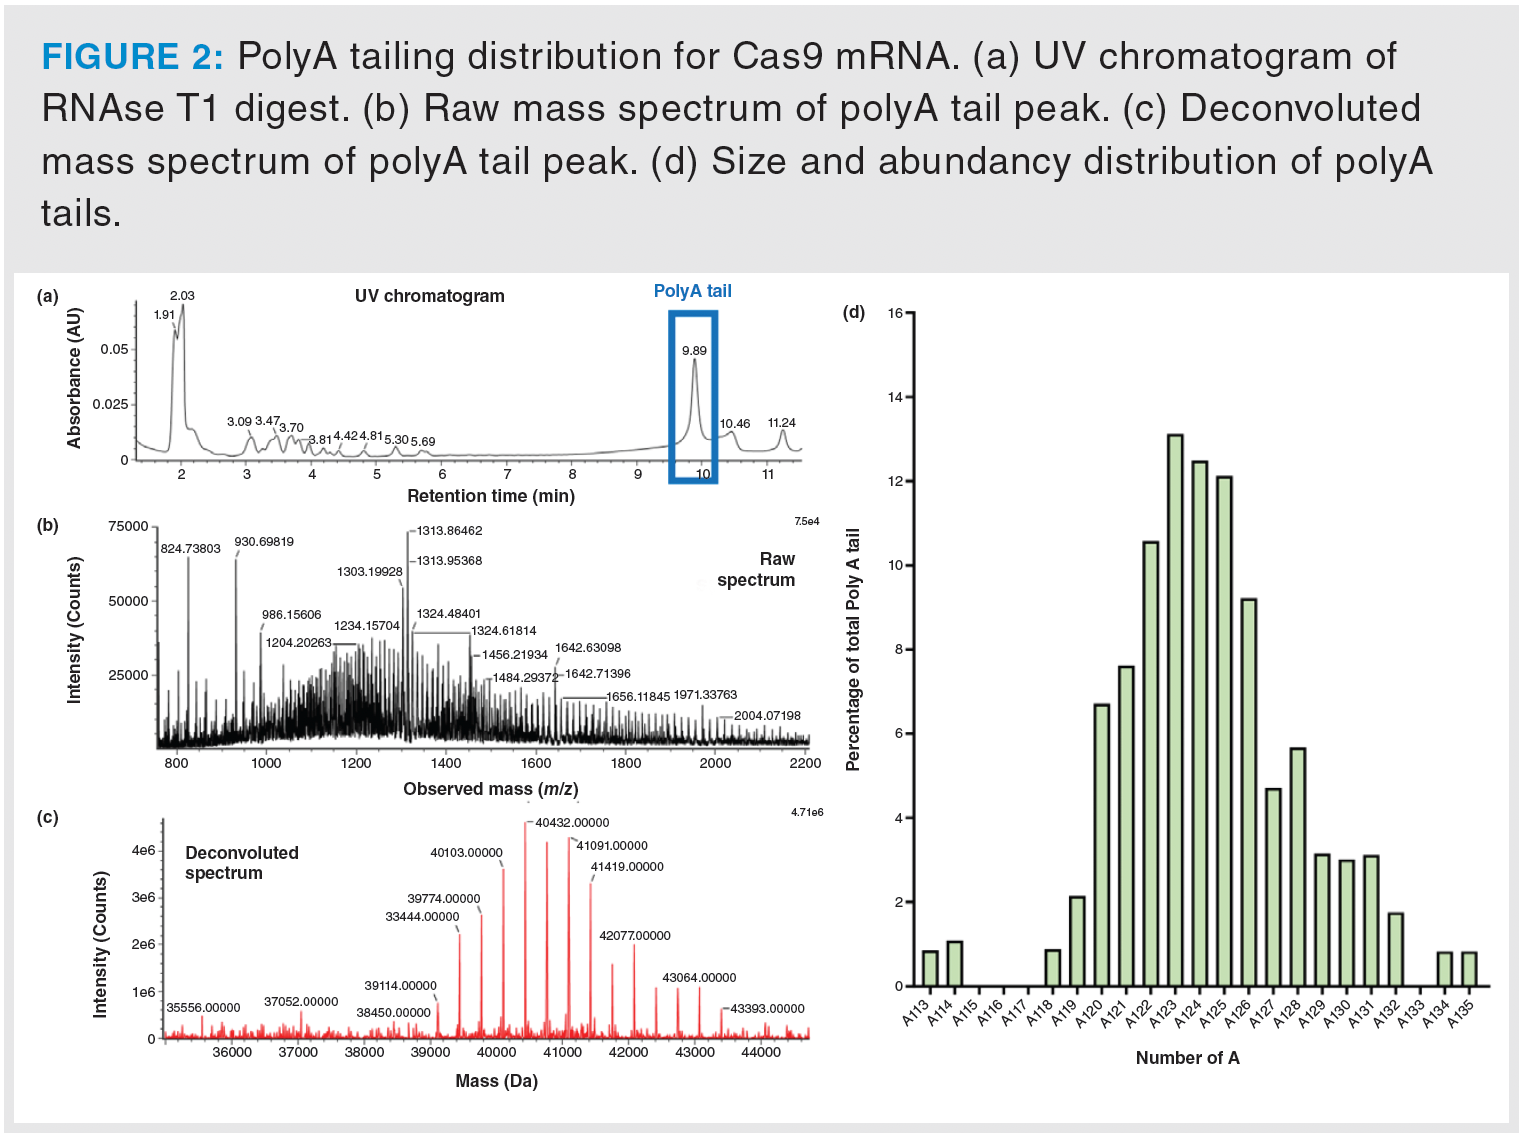
To assess the distribution of poly(A) tail lengths, the approach relied on the use of RNAse T1, which cleaves at the 3’ end of guanine (G) nucleotides. This enzymatic reaction generated short oligonucleotides and poly(A) tail, which were then subjected to LC–MS analysis. Due to limited chromatographic resolution for long oligonucleotides under these conditions, all poly(A) tails were visualized under a single chromatographic peak. This simplified the mass spectrometry data processing, because it required the analysis of only a single mass spectrum (Figure 2a). Deconvolution of the obtained mass spectrum (Figure 2b) allowed the determination of the molecular weights of the various poly(A) tails present (Figure 2c). An automated Python script was developed and utilised for peak identification and poly(A) tail length calculations. Data analysis revealed that the most abundant poly(A) tail was A123, which accounted for 13.1% of the total population, as shown in Figure 2d.
Analysis of a Drug Substance:
Recognizing that sample availability can often be a constraint, especially during early developmental stages, and given the high demand on mass spectrometers and technical personnel, the efficiency of sample preparation was sought to be improved and the time commitment required for experiments reduced. The optimized methodology minimizes both the sample volume and the overall time needed for the comprehensive analysis of the two critical quality attributes (CQAs) of interest compared to the independent experiments.
This enhanced strategy employs poly(dT) beads to capture mRNA through the hybridization of adenosine residues in the mRNA tail with thymidine residues on the beads (Figure 3a). The supernatant, which may contain residual nucleotides co-purified with the mRNA, can be examined using a technique similar to cap LC–MS analysis. During this stage, mRNA is anchored to the beads, allowing for digestion by RNase T1 into smaller fragments, including one carrying the cap, that are then released into the supernatant. Importantly, the poly(A) tails remain undigested and attached to the beads.
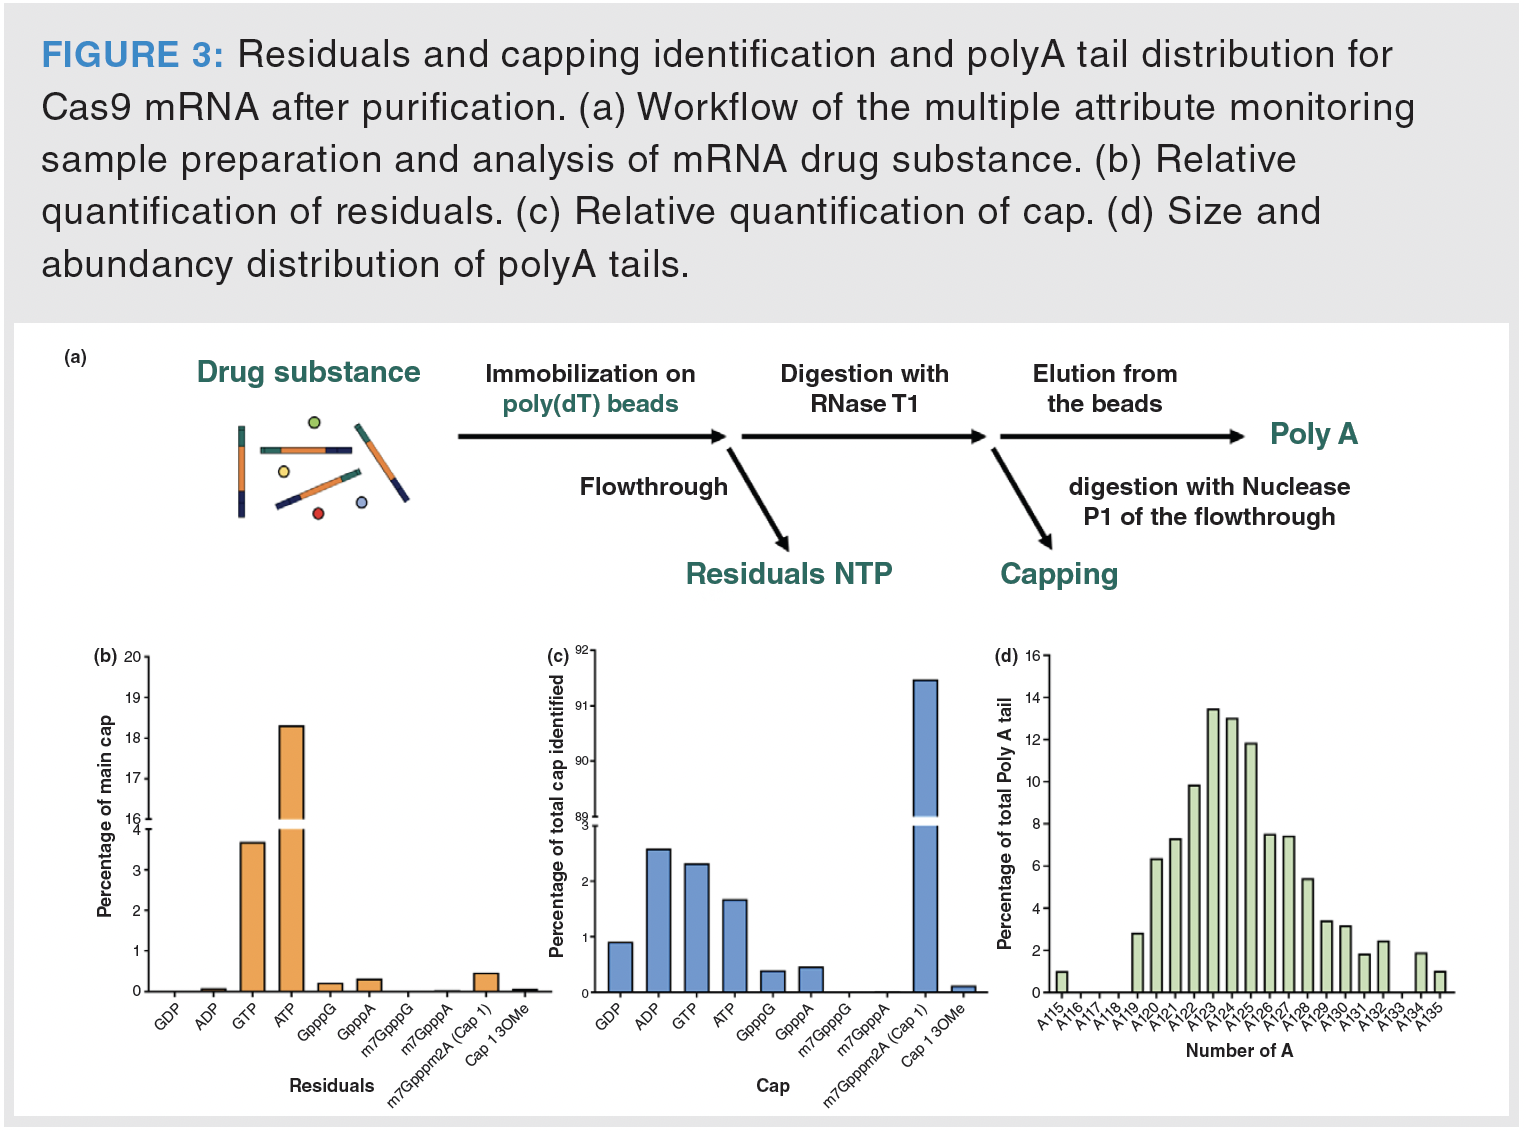
The uncaptured fraction was analyzed to identify any residual nucleotides that were not incorporated into the mRNA during synthesis or removed during purification. For the Cas9 mRNA, high levels of residual ATP were detected (18% of the main cap intensity) as well as 3.7% of residual GTP (Figure 3b). The capping analysis validated the initial findings, showing that 91.5% of the mRNA was capped with Cap1, a result closely aligned with the 90.2% observed in the preliminary experiments performed in the previous section (Figure 3b). However, an increase in ADP abundance was noted (from 0.2% to 2.6%), which can only be explained by a low abundance resulting in a wrong quantification, and a decrease in GTP (from 4.4% to 2.3%), which can be explained by the potential residuals that have been removed thanks to the mRNA immobilization on beads. The poly(A) tail analysis mirrored the initial results, identifying the most abundant poly(A) tail as A123, accounting for 13.5% of the population compared to 13.1% in the tests performed during method development (Figure 3d).
This refined approach significantly streamlines the characterization of mRNA CQAs by reducing sample size requirements and optimizing the use of mass spectrometers and personnel. Moreover, the time spent on mass spectrometry analysis can be further optimized since the mobile phases are compatible. However, this does necessitate the use of a quaternary pump coupled with a column manager and column selector to facilitate the simultaneous overnight analysis of both types of experiments.
Application of the Method to a Lipid-Nanoparticle Encapsulated mRNA:
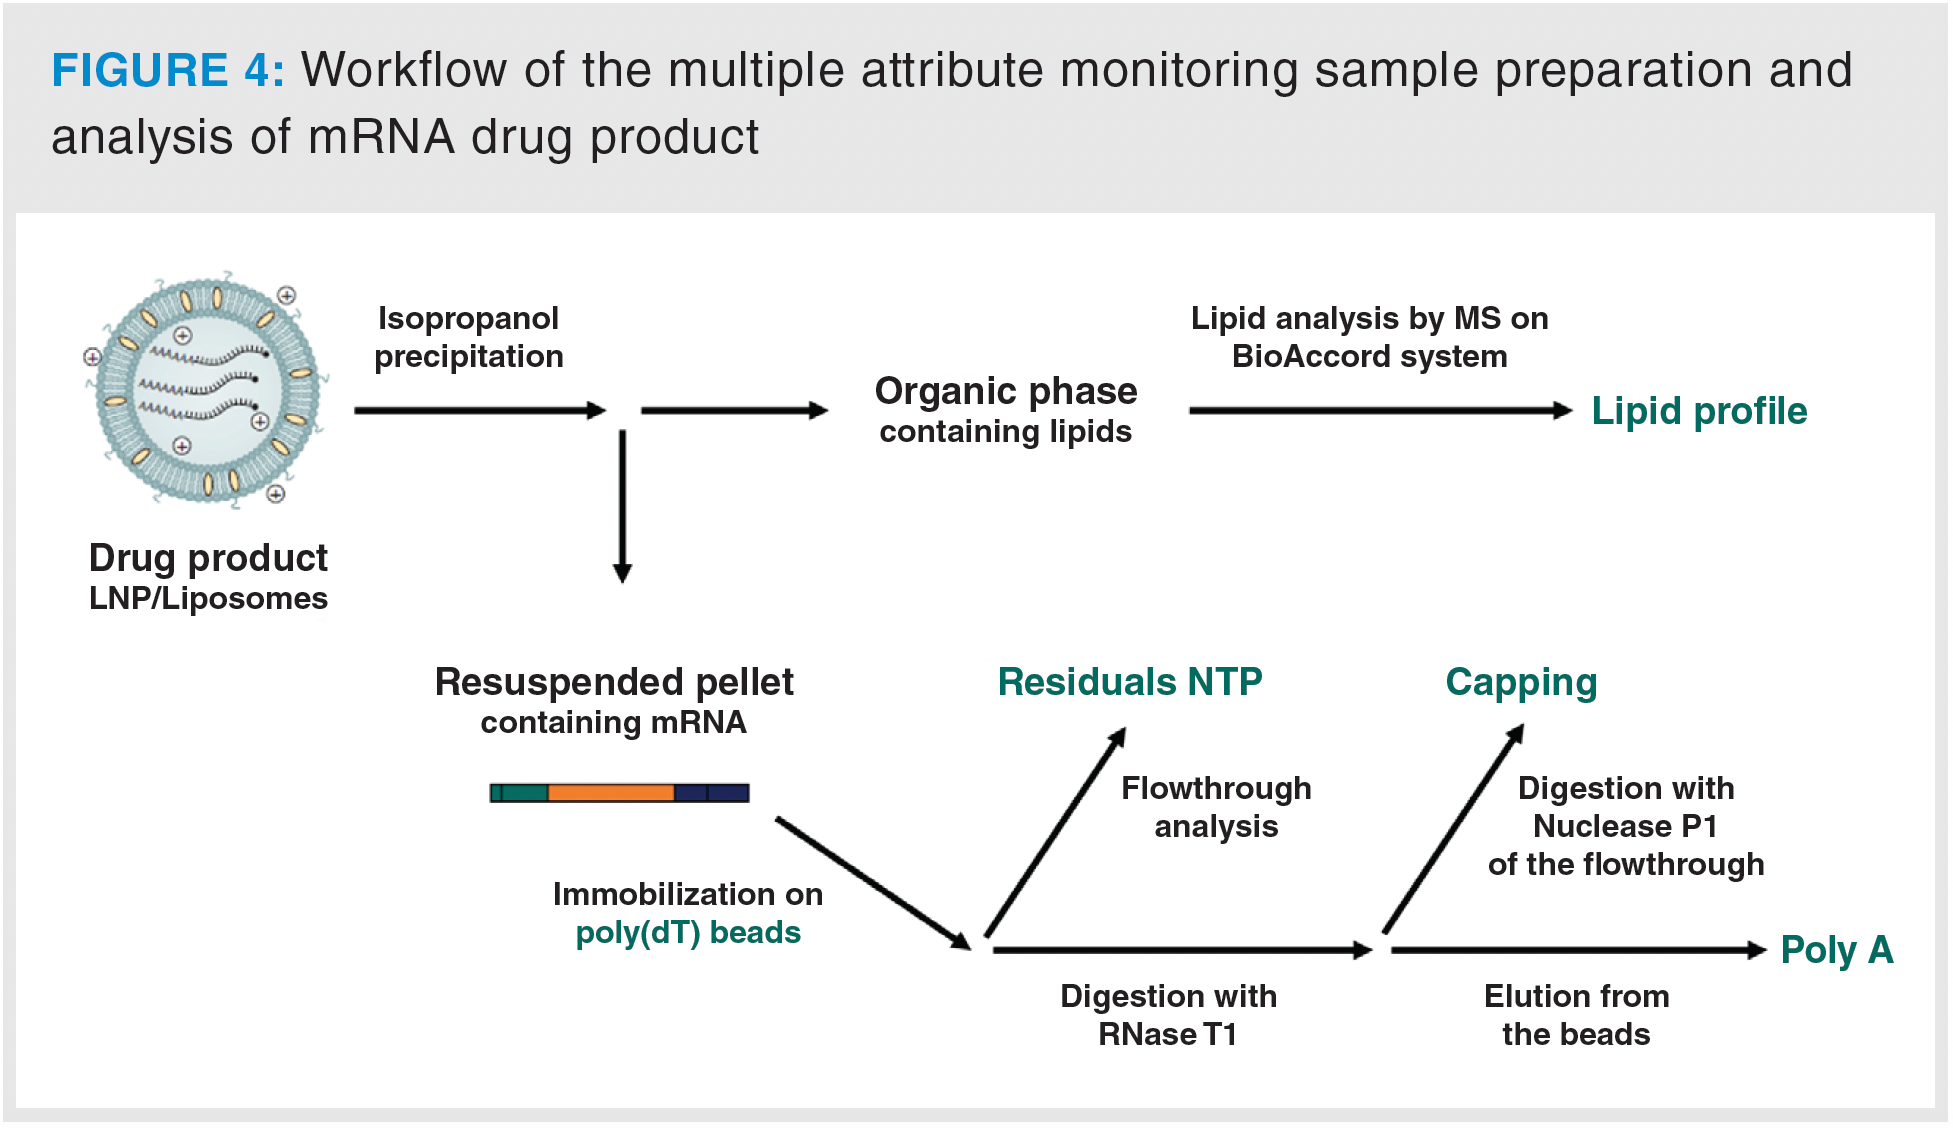
A distinguishing feature of mRNA-based drug products is their encapsulation within lipid nanoparticles. Due to this unique formulation, direct capture of mRNA on beads is infeasible, necessitating an additional extraction/precipitation step. Following extensive testing with various organic solvents, isopropanol precipitation was chosen as method of choice. This two-step procedure is both rapid and convenient, and avoids the use of hazardous solvents. After precipitation and solvent removal, the mRNA is reconstituted in water and immobilized on poly(dT) beads, following the same workflow used in drug substance analysis (Figure 4).
This optimized protocol was then applied to a lipid nanoparticle-encapsulated mRNA, thereby validating the methodology on an actual drug product. It is worth noting that the required sample amount is larger than what would typically be used for drug substance analysis, with at least twice the amount required prepared. This can be explained by an incomplete precipitation process, resulting in a reduced mass spectrometry signal. However, any additional prepared sample can be repurposed for other types of assays, such as purity analysis via capillary gel electrophoresis (cGE) or anion-exchange chromatography with UV detection (AEX-UV).
The sample preparation workflow yielded four distinct fractions: lipidic, residual, cap, and poly(A), each of which was analyzed using its respective method. The lipidic fraction revealed the presence of the four anticipated lipid types constituting the liposomal formulation: an ionizable lipid, cholesterol, a PEGylated lipid, and a helper lipid (Figure 5a). High concentrations of this lipidic fraction can also be injected to scrutinise potential impurities and degradation products.
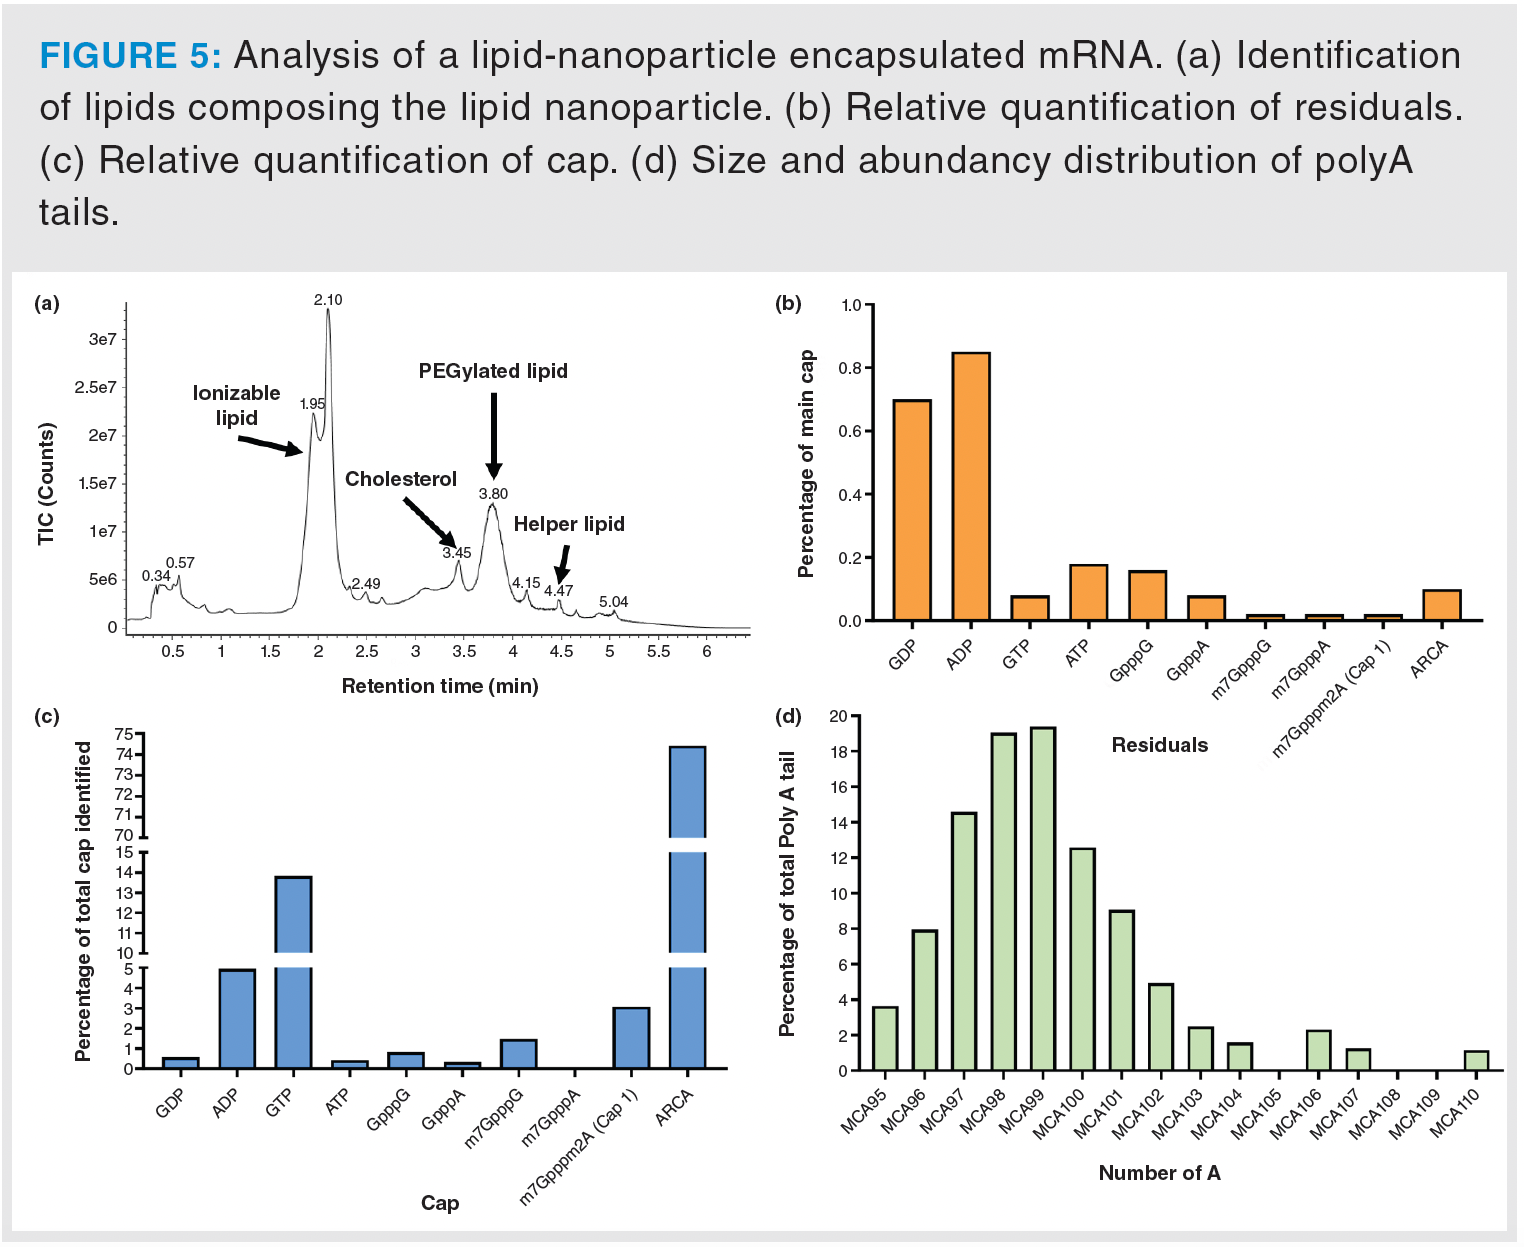
In the residual fraction analysis, low-abundance species were detected, suggesting that the mRNA was encapsulated using a highly purified drug substance (Figure 5b). Capping analysis identified ARCA (Anti-Reverse Cap Analog) as the dominant cap, accounting for 74.4% of the total population (Figure 5c). Elevated levels of GTP (13.8%) were also detected. This is likely attributable to the post-transcriptional capping process, which involves multiple enzymes and reaction intermediates, suggesting the reaction may be incomplete.
Finally, spectral data processing for poly(A) tail analysis revealed MCA99 as a predominant species, which contains 99 adenosine residues along with two additional residual nucleotides (i.e., N(1)-methylpseudouridine and cytosine). However, their sequential arrangement could not be determined (Figure 5d).
Conclusions
The methodologies developed offer comprehensive characterisation of two essential quality attributes of mRNA, demonstrating versatility because they can be applied to a wide range of mRNA types without any a priori conditions. The optimized workflow seamlessly integrates the analysis of both drug substances and drug products while minimizing sample requirements, sample preparation effort, and analysis time. This streamlining is of particular importance given the often-limited availability of sample quantities and the high demand for mass spectrometry resources. On-bead digestion does not appear to have any artefactual downsides, as the results obtained during method development and drug substance analysis are highly comparable with regard to Cap1 quantification. Only minor increases are observed for ADP and GDP, but these are correlated with a decrease in the amounts of ATP and GTP quantified. Poly(A) tail analyses are also consistent, with equivalent distributions observed in both experiments, which is not aligning with observations made by Strezscak et al. (14). However, unlike their experiment, the sample amounts used in our study are higher. This might explain the lack of observable effect of the beads on the poly(A) distribution.
Crucially, with a single sample preparation, these methods enable not only the assessment of poly(A) tail length and capping, but also the identification of residual nucleotides and the characterisation of the lipids constituting the lipid nanoparticles. This multi-faceted analysis, achievable with minimal sample input and preparation, further underscores the efficiency and comprehensive nature of the techniques developed in this study. In a context where there is a need for streamlined assessment of critical quality attributes, the multi-attribute approach offers great perspectives, by providing high quality results from a limited sample amount, using a single sample preparation and efficient LC–MS methods. This improves time-to-result while minimizing human resources and equipment resources.
This approach can be flexibly extended to integrate additional sample preparation steps or alternative analytical techniques. For instance, the proportion of polyadenylated mRNA could be accurately gauged by comparing bead-purified fractions against the flowthrough, thereby enabling the assessment of an even broader range of critical quality attributes for mRNA-based therapeutics. The methods outlined in this study not only offer robust solutions for current challenges but also provide a foundation for future advancements in the analytical characterization of complex mRNA-based therapeutic systems.
References
(1) Qin, S.; Tang, X.; Chen, Y.; et al. mRNA-Based Therapeutics: Powerful and Versatile Tools to Combat Diseases. Sig. Transduct. Target. Ther. 2022, 166 (7). DOI: 10.1038/s41392-022-01007-w
(2) Tang, Z.; Zhang, X.; Shu, Y.; Guo, M.; Zhang, H.; Tao, W. Insights from Nanotechnology in COVID-19 Treatment. Nano Today 2021, 36, 101019. DOI: 10.1016/j.nantod.2020.101019
(3) Weissman, D.; Karikó, K. mRNA: Fulfilling the Promise of Gene Therapy. Mol. Ther. 2015, 23 (9), 1416. DOI: 10.1038/mt.2015.138
(4) Muttach, F.; Muthmann, N.; Rentmeister, A. Synthetic mRNA Capping. Beilstein J. Org. Chem. 2017, 2819 (13). DOI: 10.3762/bjoc.13.274
(5) Passmore, L. A.; Coller, J. Roles of mRNA Poly(A) Tails in Regulation of Eukaryotic Gene Expression. Nat. Rev. Mol. Cell. Biol. 2022, 93 (23). DOI: 10.1038/s41580-021-00417-y
(6) Trepotec, Z.; Geiger, J.; Plank, C.; Aneja, M. K.; Rudolph, C. Segmented Poly(A) Tails Significantly Reduce Recombination of Plasmid DNA Without Affecting mRNA Translation Efficiency or Half-Life. RNA 2019, 25 (4), 507. DOI: 10.1261/rna.069286.118
(7) USP, USP Analytical Procedures for mRNA Vaccine Quality (Draft Guidelines) - 2nd Edition. https://go.usp.org/mRNAVaccineQuality (accessed 2023-10-31).
(8) Hyeshik, C.; Jaechul, L.; Minju, H. V.; Narry, K. TAIL-seq: Genome-Wide Determination of Poly(A) Tail Length and 3’ End Modifications. Mol. Cell. 2014, 53 (6), 1044–52. DOI: 10.1016/j.molcel.2014.02.007
(9) Subtelny, A.; Eichhorn, S.; Chen, G.; Sive, H.; Bartel, D. Poly(A)-Tail Profiling Reveals an Embryonic Switch in Translational Control. Nature 2014, 508 (7494), 66–71. DOI: 10.1038/nature13007
(10) Beverly, M.; Dell, A.; Parmar, P.; Houghton, L. Label-Free Analysis of mRNA Capping Efficiency Using RNase H Probes and LC–MS. Anal. Bioanal. Chem. 2016, 408 (18), 5021. DOI: 10.1007/s00216-016-9605-x
(11) Beverly, M.; Hagen, C.; Slack, O. Poly A Tail Length Analysis of In Vitro Transcribed mRNA by LC–MS. Anal. Bioanal. Chem. 2018, 410 (6), 1667–1677. DOI: 10.1007/s00216-017-0840-6
(12) Gilar, M.; Doneanu, C.; Gaye, M. Liquid Chromatography Methods for Analysis of mRNA Poly(A) Tail Length and Heterogeneity. Anal. Chem. 2023, 95 (38), 14308–14316. DOI: 10.1021/acs.analchem.3c02552
(13) DeLaney, K.; Han, D.; Birdsall, R.; Yu, Y. Q. Characterizing and Monitoring Impurities in Lipid Nanoparticle Components Using the BioAccord LC–MS System with waters_connect Software. Waters Application Note 720007844, 2023.
(14) Strezsak, S.; Pimentel, A.; Hill, I.; Beuning, P.; Skizim, N. Novel Mobile Phase to Control Charge States and Metal Adducts in the LC–MS for mRNA Characterization Assays. ACS Omega 2022, 7, 22181−22191. DOI: 10.1021/acsomega.2c00185
Thomas Menneteau is R&D Scientist at Quality Assistance (QA) Donstiennes, Belgium.
Claire I. Butré is R&D Technical Leader at QA.
Damien Mouvet is Senior Scientific Manager at QA.
Arnaud Delobel is R&D and Innovation Director at QA.

Investigating 3D-Printable Stationary Phases in Liquid Chromatography
May 7th 20253D printing technology has potential in chromatography, but a major challenge is developing materials with both high porosity and robust mechanical properties. Recently, scientists compared the separation performances of eight different 3D printable stationary phases.
Characterizing Polyamides Using Reversed-Phase Liquid Chromatography
May 5th 2025Polyamides can be difficult to characterize, despite their use in various aspects of everyday life. Vrije Universiteit Amsterdam researchers hoped to address this using a reversed-phase liquid chromatography (RPLC)-based approach.
New Method Explored for the Detection of CECs in Crops Irrigated with Contaminated Water
April 30th 2025This new study presents a validated QuEChERS–LC-MS/MS method for detecting eight persistent, mobile, and toxic substances in escarole, tomatoes, and tomato leaves irrigated with contaminated water.

.png&w=3840&q=75)

.png&w=3840&q=75)


.png&w=3840&q=75)


.png&w=3840&q=75)


