Molecular Structure of Poly(Lactic-co-Glycolic acid) by SEC with Advanced Detection
The macroscopic properties of material based on poly(D,L-lactic-co-glycolic acid) (PLGA) polymers are tunable by molar mass distribution and degree of branching, enabling optimization for applications in the pharmaceutical and medical industries. Size-exclusion chromatography followed by online multi-angle light scattering with intrinsic viscosity detection (SEC–MALS–IV) is an advanced analytical method for determining absolute molar mass distributions, identifying polymer conformation and quantifying branching. SEC–MALS–IV overcomes the errors that can be encountered in molar mass determined by conventional SEC, which arise from chemical composition and molecular structure, and provides comprehensive characterization of PLGA to facilitate the targeted development of optimized polymer.
LuckyStep/stock.adobe.com

Poly(D,L-lactic-co-glycolic acid) (PLGA) is a copolymer approved by the US Food and Drug Administration (FDA) for a variety of medical devices, tissue engineering and material for drug delivery. The mechanical properties and the rate of biodegradability depend on the ratio of the two monomers, and on their arrangement in a random or block pattern.
In addition to the chemical structure, the properties of PLGA are affected by its molar mass distribution and molecular structure, that is, linear or branched chains. Molar mass distributions are primarily affected by the synthetization method, usually either ring-opening polymerization of two cyclic diesters of lactic and glycolic acids, that is, lactide and glycolide, (1) or direct polycondensation of lactic and glycolic acid without addition of any catalysts (2). The latter, which avoids the need to purify the final product from the catalyst, typically leads to polymers with lower molar mass.
Control of branching opens further routes to modification of the physical properties and degradability of PLGA. The branched structures are typically induced by the addition of polyfunctional hydroxy components such as glucose or pentaerythritol. Comb-like structures may be created with polyacrylic acid or copolymers of acrylic acid.
Polymer Analysis by SEC
Conventional analytical size-exclusion chromatography (SEC) relies on column calibration to determine molar mass distributions. A calibration curve is constructed, which relates the molar mass of the analyte to elution volume, by means of reference standards of known molar mass. When the mobile phase is an organic solvent, SEC calibration is most commonly performed with narrow polystyrene standards prepared by anionic polymerization.
Conventional SEC is widely used for polymer characterization, but SEC separates polymer molecules according to their hydrodynamic volume, and there is no broadly valid relationship between hydrodynamic volume and molar mass. Consequently, a molar mass distribution obtained with polystyrene calibration is actually that of a hypothetical polystyrene sample that has the same distribution of hydrodynamic volume as the sample under analysis.
The addition of a multi-angle light scattering (MALS) detector upgrades conventional SEC from an unreliable, relative method to an advanced analytical technique. SEC–MALS yields absolute molar mass distributions, as well as an additional important characteristic of macromolecules: the root mean square (RMS) radius R. With detailed RMS radius distributions, branching can be detected and quantified as the number of branch units (in randomly branched polymers) or the number of arms (in star polymers).
Whereas molar mass can be measured reliably down to several hundreds of g/mol, the lower limit for R analysis by MALS is about 10 nm, roughly corresponding to a linear polymer of about 80 000 g/mol. The majority of material in commercially available PLGA falls below this limit, hence the R method of branching analysis is not appropriate. SEC combined with intrinsic viscosity (IV) detection and MALS (SEC–MALS–IV) represents another path to branching analysis which is not subject to a lower size limit, and is even more sensitive to branching than MALS alone.
The Fundamental Theory of MALS and Online Viscometry
The fundamental theory behind MALS and online viscometry can be found in the literature (3). Briefly, the molar mass is determined from the scattering-angle-dependent Rayleigh ratio (intensity of scattered light relative to that of incident light) extrapolated to zero angle:

where R0 is the Rayleigh ratio extrapolated to zero scattering angle; K* is an optical constant including specific refractive index increment, refractive index of the mobile phase, and the operating wavelength of the MALS detector; c is the concentration in g/mL, usually measured by a refractive index (RI) detector; and M is the molar mass. The above equation has a second concentration term (the ellipses) that can be neglected without significant error, as concentrations of molecules eluting from SEC are very low.
The IV is measured by an online viscometer connected downstream of the MALS detector. The specific viscosity of the sample eluting from SEC columns is calculated from the pressure difference across the bridge and the pressure drop between the bridge inlet and outlet. The intrinsic viscosity [η] is the specific viscosity divided by concentration; in turn, [η] is used to calculate the viscometric hydrodynamic radius and the Mark‑Houwink plot, which is the log–log relation [η]–M.
The Theoretical Background of Branching Analysis
The basic principle of detection and quantification of polymer long-chain branching is based on the difference in size between a branched macromolecule and the corresponding linear macromolecule of the same molar mass, as shown theoretically by Zimm and Stockmayer in their famous paper (4). The authors defined branching ratio g and related it to the number of arms in star polymers by equations 2 and 3:
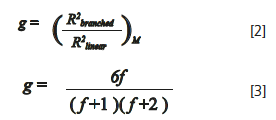
where R2 is the mean square radius of branched or linear macromolecules with identical molar mass M, and f is the number of arms in a star macromolecule having arms of random length. Although equations 2 and 3 represent the most fundamentally correct description of branching, their application to PLGA and other smaller polymers is limited by the minimum RMS radius MALS can measure.
An alternative branching ratio g´ based on the intrinsic viscosity, and hence not subject to the size limit, was derived by Zimm and Kilb in equation 4 (5):

where [η] is the intrinsic viscosity of linear and branched molecules of identical molar mass. The relationship between the two branching ratios is given by equation 5:

where e is so-called draining parameter, related to the permeability of polymer coils to the solvent. Although detailed literature data are scarce, it seems that the parameter e varies with molar mass and branching. It is expected to fall between 0.5–1.5, so the values ≈ 0.7–1.0 might be good estimates. Other equations relating g´ with f have been published, yielding slightly different results, yet their detailed evaluation is beyond the scope of this paper.
Experimental
The results presented in this paper were acquired with a DAWN MALS photometer, a ViscoStar online viscometer, and an Optilab RI detector and processed with ASTRA 7 software, all from Wyatt Technology (Santa Barbara, CA). The SEC system consisted of an Agilent 1260 HPLC instrument with two PLgel Mixed-C 300 × 7.5 mm columns, also from Agilent. Tetrahydrofuran (THF) was used as the mobile phase at a flow rate of 1 mL/min. Samples were prepared in THF in the concentration of 2.5–5 mg/mL and injected in the volume of 100 μL.
Results and Discussion
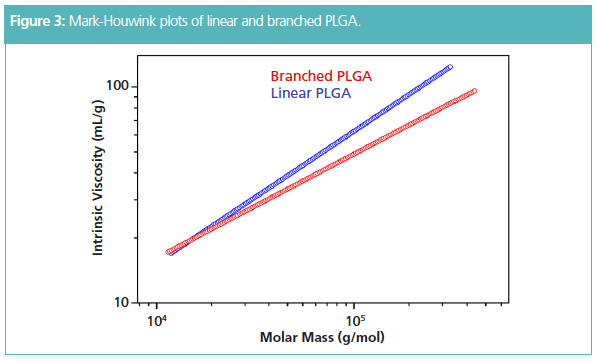
The failure of conventional analytical SEC, in terms of column calibration, to properly describe the molar mass distribution is demonstrated in Figure 1, which compares the SEC–MALS plots of molar mass versus elution volume for broad polystyrene and three different PLGA samples. Figure 1 reveals the following: (i) molar mass of PLGA 50:50 measured by conventional SEC with polystyrene calibration is overestimated by 25–30%, (ii) conventional SEC yields markedly larger error for PLGA consisting of 85% lactic acid, and (iii) the plot of commercial branched PLGA overlaps with that of linear PLGA in the region of lower molar masses, and starts to deviate from ≈ 50 000 g/mol. The deviation from the plot of linear PLGA confirms the presence of branched macromolecules in part—but not all—of the sample. It is worth mentioning that while polystyrene calibration would overestimate molar mass of the branched sample in the lower range, it would underestimate values of the most branched fractions with M greater than about 150 000 g/mol.
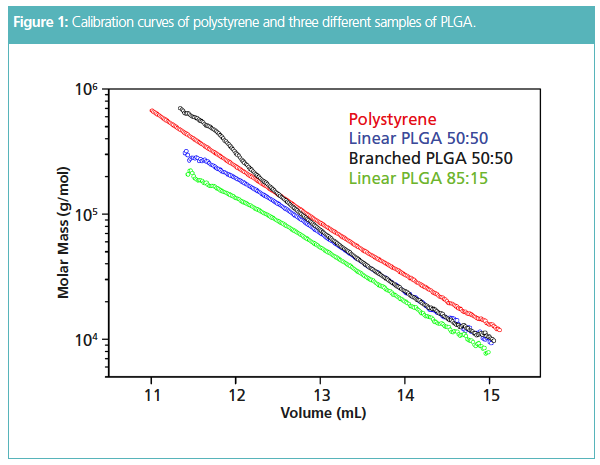
Figure 2 depicts typical data from SEC–MALS–IV, with MALS and specific viscosity measured simultaneously following SEC separation, yielding molar masses and intrinsic viscosities. The data enable calculation of the molar mass distribution, all molar mass averages (number-, weight- and z-averages), and the Mark-Houwink plot.
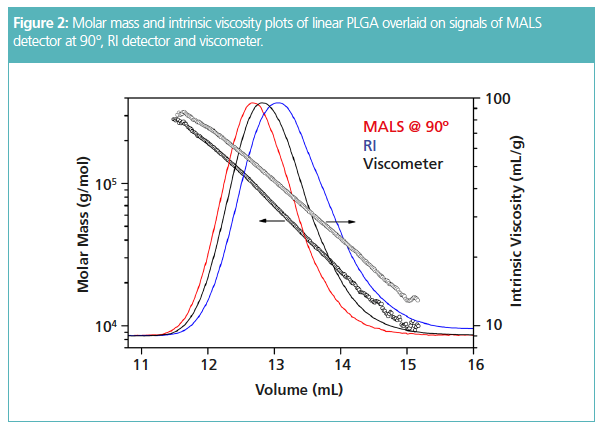
Figure 3 compares the Mark-Houwink plots of linear PLGA and commercially available branched PLGA. The slope of the plot of branched PLGA is low compared to the linear counterpart, as is typical for branched polymers.
The number of arms f may be calculated using equation 3, and plotted against molar mass. For the sake of simplicity, the draining parameter e was set to unity. Figure 4 depicts an example of such a calculation of f, overlaid with the cumulative molar mass distribution. Note that f, which is a discrete quantity having the values f = 2, 3, 4, …, is plotted here as a continuous quantity. This is because f—at any given molar mass—is averaged over molecules having different number of arms.
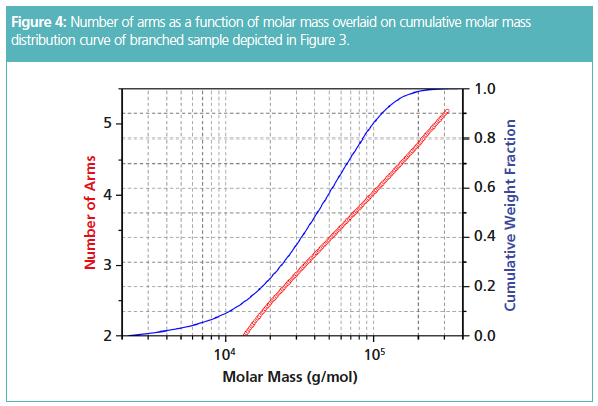
The plot in Figure 4 shows increasing number of arms with increasing molar mass, which indicates that not all hydroxyls of the branching compound (likely glucose) created starting points for the PLGA arms. The maximum value of f approaches five, which corresponds to fully reacted glucose. However, the cumulative distribution shows that the weight fraction of molecules with f > 4 is less than ≈ 15 %, and that the sample contains a substantial amount, roughly 15%, of linear molecules (since f = 2 corresponds to a linear molecule).
Conclusion
PLGA-based polymers are vital for many pharmaceutical and medical products, and the pharmaceutical industry requires a fast, accurate and highly robust analytical technique to characterize them. This need is fulfilled by SEC with triple detection comprising a MALS photometer, an online viscometer, and an RI detector. This study shows that SEC–MALS–IV can describe the PLGA molecular structure completely, that is, provide the absolute molar mass distribution and the relation between the number of arms and molar mass in star-PLGA. The difference between the correct molar mass by MALS and polystyrene equivalent depends on the monomer ratio, and even more importantly, on the degree of branching. The study also shows that commercially available branched PLGA can contain a significant fraction of linear molecules.
References
- O. Dechy-Cabaret, B. Martin-Vaca, and D. Bourissou, Chem. Rev. 104, 6147–6176 (2004).
- E. Snejdrova, S. Podzimek, J. Martiska, O. Holas, and M. Dittrich, Acta Pharm. 70, 63–75 (2020).
- S. Podzimek, Light Scattering, Size Exclusion Chromatography and Asymmetric Flow Field Flow Fractionation (Wiley, Hoboken, New Jersey, USA, 2011).
- B.H. Zimm and W.H. Stockmayer, J. Chem. Phys. 17, 1301 (1949).
- B.H. Zimm and R.W. Kilb, J. Polym. Sci. 37, 19–42 (1959).
Stepan Podzimek is a scientific consultant for Wyatt Technology with research interests focused on the characterization of molecular structure of synthetic and natural polymers by means of separation techniques and light scattering and viscometric detectors. He also heads the Department of Analytical and Physical Chemistry at SYNPO, a Czech R&D company conducting contract research in synthetic polymers and related materials, and holds a professorial position at the Institute of Chemistry and Technology of Macromolecular Materials at the University of Pardubice, Czech Republic.
Daniel Some is Principal Scientist at Wyatt Technology. He is responsible for scientific and technical marketing content and other projects including instrumentation for macromolecular interactions and real‑time process analytics.
E-mail: stepan.podzimek@wyatt.eu
Website: www.wyatt.com

Characterizing Plant Polysaccharides Using Size-Exclusion Chromatography
April 4th 2025With green chemistry becoming more standardized, Leena Pitkänen of Aalto University analyzed how useful size-exclusion chromatography (SEC) and asymmetric flow field-flow fractionation (AF4) could be in characterizing plant polysaccharides.
Rethinking Chromatography Workflows with AI and Machine Learning
April 1st 2025Interest in applying artificial intelligence (AI) and machine learning (ML) to chromatography is greater than ever. In this article, we discuss data-related barriers to accomplishing this goal and how rethinking chromatography data systems can overcome them.
Influence of Concentration in Conventional GPC/SEC and Advanced Detection GPC/SEC
March 21st 2025Sample concentration is a parameter that can influence the quality of gel permeation chromatography/size-exclusion chromatography (GPC/SEC) separations and the obtained results. Understanding this influence can help to support the development of reliable GPC/SEC methods.


