Maximizing Robustness and Throughput in Liquid Chromatography by Using Pressure-Controlled Operation
LCGC North America
Analysis time can be reduced 10–30% by switching from constant-flow-rate mode to a constant-pressure gradient-elution mode.
A considerable gain in analysis time (10–30%) can be obtained by switching from a constant-flow-rate mode of operation to a constant-pressure gradient-elution mode. This switch will not reduce separation selectivity, because selectivity is volume-based and thus is independent of the flow rate. The peak areas and plate heights are similar in the two modes.
Imagine yourself driving home but stuck in a traffic jam in which you can only drive at a 10 mph. After the traffic clears up, you will surely want to increase your driving speed, preferably up to the speed limit, or maybe even a little higher when no police are around. In any case, you will certainly not continue driving at 10 mph.
However, when running a liquid chromatography (LC) gradient (1–3), maintaining a slow speed is exactly what we all do: The flow rate we apply is always determined by the pressure bottleneck, occurring when the gradient composition reaches its viscosity maximum. This is illustrated in Figure 1a, which shows the pressure trace of a 5–95% gradient of acetonitrile–water (red curve) obtained when a constant flow rate is selected such that the pump does not exceed 1000 bar. In agreement with Darcy's law, the pressure trace follows the viscosity profile of the varying mobile-phase composition pumped through the column during the gradient. As can be noted, the pressure maximum of 1000 bar is reached only for a brief moment, when the column is filled with a 20:80 (v/v) acetonitrile–water mixture (4). Before and after this bottleneck, the pressure drop is considerably lower than the imposed limit of 1000 bar, leaving a considerable margin to increase the flow rate during these portions of the gradient.
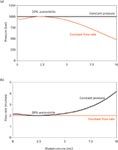
Figure 1: Traces of (a) pressure and (b) flow rate of a 5â95% acetonitrileâwater mobile-phase gradient under constant pressure (black) and constant flow rate (red).
Doing so, and controlling the pump so it delivers the maximum pressure during the entire gradient, the flow rate at the start and end of the gradient is larger than in the case of a constant flow rate (see the black lines in Figures 1a and 1b). For the presently considered 5–95% acetonitrile gradient, the average increase in affordable flow rate is about 20%. When running methanol gradients, a similar situation arises, with a similar percentage gain. The main difference is that in this case the viscosity maximum occurs at about 50% (vol%) methanol instead of at about 20% acetonitrile.
Because the flow rate in the constant flow rate mode is determined by the viscosity bottleneck, the average flow rate in the constant-pressure mode will always be larger than that in the constant-flow-rate mode. As a consequence, the gradient program will always be finished sooner than in the constant-flow-rate mode, thus leading to a noticeable time saving.
Because the possible average increase in the flow rate and the accompanying analysis time savings are determined by the viscosity of the mobile phase, the time savings will heavily depend on the start and end composition of the gradient. When these compositions lie close to the viscosity maximum of the water–organic modifier mixture, the gain will only be on the order of a few percent. This is true, for example, in the case for an acetonitrile–water gradient running between 10 and 30% acetonitrile or for a methanol–water gradient running between 40 and 60% methanol. On the other hand, gains on the order of 16–22% can be realized for gradients running between 5 and 50% or 50 and 95% methanol. For typical scouting gradients — that is, gradients running between 5 and 95% of organic modifier — the time gain is also on the order of approximately 20%, for methanol as well as acetonitrile gradients. For some exotic solvents, or for some complex mobile-phase gradient profiles (segmented gradients), the time gain can even be larger. A more detailed calculation of the time gain that can be achieved is found in the literature (5,6).
The time gain also is dependent on pressure and temperature, because of the temperature and pressure dependency of the viscosity. For the average column pressure of 200 bar typical of high performance liquid chromatography (HPLC) separations (Pinlet = 400 bar), the time gain at 30 °C for a linear 20–95% acetonitrile–water gradient is 26% compared to the time gain of 21% for an average column pressure of 500 bar, typical for ultrahigh-pressure LC (UHPLC) separations (Pinlet = 1000 bar). With increasing temperature, the time gain further decreases because the viscosity differences between water and an organic modifier such as acetonitrile or methanol become smaller, because the viscosity of water is more sensitive to temperature than that of organic modifier (4). When increasing the column temperature to 60 °C, the time gain is further limited to 16% for Pinlet = 1000 bar.
In practice, the time gain that can be achieved is 5–10% greater (leading to an overall gain on the order of 30%) than what would be calculated on the basis of the changing mobile–phase viscosity only. This is because the pressure safety margin that needs to be taken into account in the constant-flow-rate mode is no longer needed in the constant-pressure mode. In the constant-flow-rate mode, this margin is needed to buffer possible pressure fluctuations or a degradation of the column's permeability. In the constant-pressure mode, this margin is not needed because the pressure is controlled to its set point. This robustness advantage of the constant-pressure operation might even be more attractive than the reduction in analysis time, especially in unattended operation or in start-up procedures when a column heats up either by an oven or by frictional heating (because it is a common observation that the pressure drop in the column decreases during the first couple of minutes of high-pressure operation as a result of column heating by frictional heat).
Knowing from the above that a considerable gain in analysis time can be obtained by switching from a constant flow rate to a constant-pressure gradient-elution mode, several questions emerge. How will this switch affect the separation selectivity and the width of the elution window? What will happen to the sensitivity of analysis and the reliability of quantification? And finally, what will happen to the peak broadening? These questions are answered in the following sections.
Selectivity Is Volume-Based and Thus Independent of the Flow Rate in Volumetric Coordinates
Given that it is the common experience that the retention coefficient in gradient elution varies with the flow rate, one might fear that the variable flow rate in the constant pressure mode will affect the selectivity of the separation. However, since the early days of gradient elution theory (7), it has been a well-established fact that the position of the peaks in the column is not determined by the volume pumped per time (the flow rate) but by the volume and composition of the mobile phase.
This is illustrated in Figure 2, which shows a schematic representation of a column in which a stepwise 10–90% acetonitrile gradient is applied. When the first beaker with a weak eluent (10% acetonitrile in water) is poured into the column, the injected analytes (indicated with the red line) will migrate a given distance along the column. When the volume of eluent in the beaker is doubled, the migration distance will double as well. However, when the beaker is poured out twice as fast, the migration distance will remain unchanged. The same holds for the subsequent beakers with mobile phase, only here the analytes migrate faster because of the increasing solvent strength. Figure 2 thus illustrates the well-established fact that the position of the analytes inside the column is purely thermodynamically determined; that is, it depends on the added mobile-phase volume, its solvent strength, and other parameters such as temperature, pressure, and pH, but not on the rate at which the mobile phase has been fed to the column.
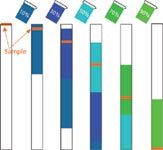
Figure 2: Illustration of a stepwise 10â90% gradient program.
This implies that even if the flow rates of two gradient-elution runs were to vary, the runs will always display the same elution window and the same peak-to-peak selectivity, provided both runs follow to the same volumetric mobile-phase gradient program (that is, a program in which the %B is changed as a function of the pumped volume of mobile phase). Referring to Figure 2, this condition corresponds to the fact that the consecutive beakers with different %B that are poured into the column have the same volume, whereas the rate with which they are poured (the flow rate) has no effect on the distance the analytes migrate in the column.
Example 1: The concept discussed above is illustrated in Figure 3a, which shows the separation of a mixture containing eight phenones and acetanilide on a 150 mm × 2.1 mm, 1.8-μm dp C18 column (Agilent Zorbax Eclipse Plus RRHD) with a linear 20–95% acetonitrile gradient (VG/V0 = 12.24, where VG and V0 are defined as gradient volume and column volume, respectively) on a prototype LC system (Agilent 1290 Infinity) provided with a special firmware enabling system operation at constant pressure with preservation of a given gradient program versus delivered volume. Special software utilities transformed the detector signals recorded versus real time to a coordinate system in which the detector signal was plotted versus the delivered volume, even if the flow rate varied during the separation (6).
The black line chromatogram shows the separation operated in the constant-flow-rate mode at a flow rate of 0.3 mL/min, and the red chromatogram shows the same separation operated in the constant-pressure mode with the pressure set to the maximum pressure drop (475 bar) encountered during the constant-pressure mode. Because the gradient starts at 20% acetonitrile, this pressure maximum is encountered at the beginning of the gradient. The flow rate in the constant-pressure mode is therefore initially nearly identical to that in the constant-flow-rate mode (0.300 mL/min), thus explaining why the first peak of the chromatogram (acetanilide) is eluted almost at the same time in both modes. Because of the decreasing viscosity of the mobile phase toward the end of the gradient, the flow rate in the constant-pressure mode gradually increases until it finally reaches a value of 0.63 mL/min at the end of the gradient (95% acetonitrile). As a consequence, the subsequent peaks in the chromatogram are eluted faster and faster compared to their counterparts in the constant-flow-rate mode case, until eventually the last peak (octanophenone) is eluted at 10.4 min, compared to the 13.2 min needed for this peak to be eluted in the constant-flow-rate mode. This results in a time gain of 2.7 min, or roughly 21%.
The gradual increase in flow rate also can be appreciated from the gradient profile shown in Figure 3a. Whereas the value of %B varies linearly with the time in the constant-flow-rate mode (red line in Figure 3a), the plot of gradient composition versus time (black line in Figure 3a) displays an upward curvature in the case of the constant-pressure mode. This results from the fact that, whereas both modes run the same volume-based program (see Figure 3b), this gradient program is executed with increasing acceleration in the constant pressure mode.
Whereas in Figure 3a the detector signal is plotted versus time, Figure 3b shows the same signals, but now plotted versus the pumped eluent volume. As can be noted, the two operation modes (constant flow rate and constant pressure) now produce exactly the same elution window and peak-to-peak selectivity versus elution volume. This reflects what was already illustrated in Figure 2, that the relative position of the analytes in the column, and hence the true selectivity, is fully determined by the change of %B versus the pumped volume. This also implies that the true selectivity should be determined from a volume-based chromatogram (as in Figure 3b) and not from a time-based chromatogram (as in Figure 3a).

Figure 3: Comparison of the chromatograms and the gradient program in constant-flow-rate mode (red) and constant-pressure mode (black) of a phenone mixture (Pmax = 475 bar, Fmin = 0.3 mL/min, 150 mm à 2.1 mm column) plotted versus the (a) real time and the (b) elution volume. A linear 20â95% acetonitrileâwater gradient was imposed, VG/V0 = 12.24. Peaks: 1 = acetanilide, 2 = acetophenone, 3 = propiophenone, 4 = butyrophenone, 5 = valerophenone, 6 = hexanophenone, 7 = heptanophenone, 8 = octanophenone, 9 = benzophenone.
As long as a separation is run in constant-flow-rate mode, the distinction between time- and volume-based coordinates does not matter, because volume and time scale linearly. When the flow rate varies with the time, however, this no longer holds, and the selectivity should be determined from a volume-based chromatogram, as was done in the very early days of chromatography. LC systems have been operated versus time since the onset of automated liquid chromatography only because data recorders could be much more easily related to the elapsed time than to the dispensed mobile-phase volume.
However, even when working in the constant-pressure mode, it remains possible to substitute the volume axis by a time axis by scaling the volume with a constant-flow-rate value (see equation 1). This value can be selected arbitrarily, but to directly compare the constant-pressure and constant-flow-rate modes, it is convenient to use the constant flow rate Fcf of the corresponding constant flow rate separation. The resulting time axis can be referred to as the chromatographic time:

where V is volume and tV is chromatographic time. This is the second axis added to Figure 3b, showing that in chromatographic time units (tV – time), the peaks in the chromatogram generated using constant pressure are eluted at exactly the same time as in the constant-flow-rate mode. The representation of the chromatographic signals versus the chromatographic time thus seems a convenient way to visualize HPLC or UHPLC results obtained under constant pressure or generally variable flow conditions in a more traditional way.

Figure 4: Comparison of chromatograms in constant-flow-rate mode (red) and constant-pressure mode (black) plotted versus the (a) real time and the (b) elution volume. A linear 15â85% acetonitrileâwater gradient was imposed, VG/V0 = 22; Pmax (constant flow) = 1150 bar and Pset (constant pressure) = 1200 bar. Peaks: 1 = 2-naphthoic acid, 2 = 2-hydroxyquinoline, 3 = methyl 4-hydroxybenzoate, 4 = quinoline, 5 = 1-indanone, 6 = acetophenone, 7 = ethyl 4-hydroxybenzoate, 8 = 2-naphtol, 9 = propyl 4-hydroxybenzoate, 10 = 9-hydroxyfluorene, 11 = benzofuran, 12 = butyl 4-hydroxybenzoate, 13 = butyrophenone, 14 = indene, 15 = valerophenone, 16 = indane, 17 = dibenzofuran, 18 = fluorene, 19 = heptanophenone, 20 = octanophenone.
In reality, small differences in selectivity between the constant-pressure and constant-flow-rate chromatograms might always occur as a result of secondary effects caused by the difference in operating pressure or column temperature (when viscous heating becomes significant). Fortunately, both effects counter each other to some extent. On the one hand, the higher average column pressure during the constant-pressure run might lead to stronger retention (8), while on the other hand, the higher average column temperature (because of the higher degree of viscous heating), might lower the retention (9). As a consequence, the selectivity differences between the constant-pressure and the constant-flow-rate modes are expected to be moderate or negligible in most cases. Differences in retention caused by pressure and viscous heating effects are in fact inevitable when trying to reduce the analysis time by increasing the pressure, and also occur when switching from HPLC to UHPLC. Because the change in selectivity caused by pressure and frictional heating can go either way (that is, it can either improve or reduce selectivity), the difference in selectivity between the constant-pressure and constant-flow-rate modes can be considered to be a rather neutral thing.
When column permeability decreases, such as because of column aging, the constant-flow-rate and constant-pressure modes can still be expected to retain the same selectivity (except for the possible pressure and temperature effects mentioned above). When column permeability decreases, the achievable flow rate will inevitably become smaller in the constant-pressure mode, but the selectivity will be maintained, because, as already mentioned, the selectivity is determined by the volume of mobile phase flowing through the column and not by the flow rate.
Example 2: Figure 4 shows a second example, the separation of a more complex mixture containing polycyclic hydrocarbons, quinoline and furan derivatives, and alkylphenones (see figure caption for peak identities) under constant-flow (red) and constant-pressure (black) conditions. The separation was performed on a 100 mm × 2.1 mm, 1.8-μm dp C18 column (Agilent Zorbax Eclipse Plus RRHD) column applying a linear 15–85% acetonitrile gradient (VG/V0 = 22), followed by an isocratic 85% acetonitrile segment (five column volumes). The flow rate in the constant-flow-rate mode was chosen such that a pressure drop of 1150 bar was achieved at maximal viscosity (20% acetonitrile) to leave a safety margin of 50 bar. In the constant-pressure mode, the set value of the pressure was 1200 bar because the safety margin was no longer needed and thus the entire gradient could be run at the instrument limit of 1200 bar.
In the constant-pressure mode, the initial flow rate was higher than in the constant-flow-rate mode (0.77 mL/min versus 0.7 mL/min) because the initial mobile-phase composition (15% acetonitrile) had a viscosity lower than the maximal viscosity (20% acetonitrile) and because the pressure safety margin was eliminated. The flow rate increased to 1.29 mL/min at 85% acetonitrile, and Figure 4a shows that the separation was run in 7.5 min compared to 10.0 min in the constant-flow-rate mode.
Figure 4b shows again that the same selectivity is obtained in both operation modes when the chromatogram is plotted versus the run volume or, equivalently, versus the chromatographic time. As can be seen from the inset, the retention in the constant-pressure mode was slightly higher than in the constant flow rate mode. This effect was most probably caused by the increased pressure in the constant-pressure mode (8); the largest difference between the retention times in both modes is 1%.
Peak Quantification
Another possible point of concern when contemplating a change from constant-flow-rate to constant-pressure mode is the effect of the operation mode on the peak areas. Considering a concentration-sensitive detector such as a UV detector, it can be expected that the total injected mass will correspond to the sum of the partial masses contained in all elementary volumes making up the peak. This again implies that the true peak area of a constant-pressure mode separation should be considered in volume-based coordinates (or equivalently, in chromatographic time units) and not in real time units. In real time units, the faster eluting bands at the end of the chromatogram appear narrower in the constant pressure mode than in the constant flow rate mode. However, this difference is only caused by the higher flow rate in the former, making the bands pass faster at the detector. In the volume-based or chromatographic time-based coordinates, the peaks have the same area, as they should.
The inset in Figure 4b indeed shows that very similar peak areas are obtained in both modes when inspecting the chromatogram in the volume units or in the chromatographic time units. For example, the difference in average peak area from five subsequent injections ranges from 0.3 to 2.0% (see Table I). The difference in area (in absolute or relative values) is smaller, equal to three times the standard deviation of the peak area in the constant-flow-rate mode, corresponding to the 99.7% confidence interval. Table I shows that both operation modes also produce a very similar repeatability: Both modes lead to similar relative standard deviations for the peak area and the retention time (considering the volumetric or the chromatographic time coordinates).

Table I: Comparison of the average and standard deviation of the peak area and retention time (volume based) inconstant-pressure and constant-flow-rate mode
Band Broadening
Because the injected analytes are subjected to a different flow rate evolution, band broadening will inevitably be different in the constant pressure and the constant flow rate mode. To investigate this further, plate height values were measured from the volume-based chromatograms obtained for the sample considered in Figure 3, and applying different flow rate set values in the constant-flow-rate mode and different set pressures in the constant-pressure mode. The obtained plate height values are shown in Figure 5. They were measured in the gradient mode but were corrected with the retention coefficient at elution (7,10). Figures 5a and 5b show the van Deemter plots of peaks 3 (propiophenone) and 8 (heptanophenone), respectively, of the chromatogram shown in Figure 3.
The general trend observed in Figures 5a and 5b is representative for most comparisons between the constant-flow-rate and constant-pressure modes. In the diffusion-limited separation region (B-term region, left side of plot), narrower peaks are obtained in the constant-pressure mode (red). This is because any increase in flow rate (which is what happens when going from the constant-flow-rate mode to the constant-pressure mode) leads to superior separation performance in the B-term-dominated region. In the region controlled by mass transfer (the C-term region) on the other hand, the peaks are slightly broader in the constant-pressure mode because in this region any increase in flow rate reduces efficiency. Around the optimum of the van Deemter plot, efficiency is nearly independent of flow rate. As a consequence, similar plate heights are obtained in both modes.
For peak 3 (Figure 5a), the difference between the van Deemter curves in the two modes is very small, because the flow rates during its elution are very similar in the constant-pressure and constant-flow-rate modes (compare this to the small difference in the real-time gradient profile added to Figure 3a). The difference in plate height variation is much more pronounced for peak 8 (compare to Figure 5b). This is due to the fact that peak 8 has experienced the highest velocities occurring during the constant-pressure run, while the flow rate in the constant-flow-rate run remained at the same lower level. It can be calculated that peak 3 was eluted from the column at a flow rate of 0.38 mL/min instead of at 0.30 mL/min in the constant-flow-rate mode (see the arrows in Figure 5). This difference is relatively small, and almost no difference is seen between the band broadening in the two modes. For peak 8, the difference is more pronounced as it is eluted from the column at a flow rate of 0.58 mL/min compared to 0.30 mL/min in the constant-flow-rate mode. As indicated by the arrows in Figure 5b, the loss in efficiency for peak is approximately 12%. This difference is still small, however, and this disadvantage generally does not weigh up against the gain in analysis time (5,6).
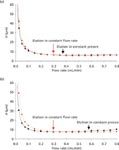
Figure 5: Plot of the effective plate heights versus the (minimal) flow rate for the constant-flow-rate mode (red) and constant-pressure mode (black) for (a) peak 3 and (b) peak 8 from the phenone mixture. The same conditions were used as in Figure 3.
Conclusion
Constant-pressure LC can offer the same gradient selectivity, elution window, and area count under UV–vis detection as in the constant-flow LC mode, while the chromatographic result can be obtained 10–30% faster. While other approaches to increase the speed of analysis require a change in instrument (to move from HPLC to UHPLC) or column (to move to high-temperature LC or to porous-shell particles), the constant-pressure mode gain only requires a change in firmware. This is possible because the LC process is volume- and not flow rate- or time-based, and because the flow rate is no longer limited by the viscosity bottleneck in the constant-pressure mode. A further benefit of the constant-pressure operation is the elimination of system faults or shutdowns as a result of occasional overpressure conditions. Although the pressure-controlled hardware operation differs significantly from the conventional constant-flow one, the user interface can still be made analogous to the conventional one by producing chromatograms in time coordinates.
When working close to the minimum of the van Deemter curve, the chromatograms in the constant-pressure mode are obtained without any loss in efficiency. When working in the C-term region, the constant-pressure mode will have slightly reduced efficiency due to the increased flow rate. However, this loss in efficiency only occurs for the peaks that have experienced the highest velocities during a large part of their elution process. The other peaks are much less affected or not affected at all. Furthermore, operating a column in the C-term-dominated regime is only a good idea when one is already using the smallest possible particle size. If this is not the case, faster analysis is always possible by switching to a column with smaller particles and operating it near the minimum of the van Deemter curve.
References
(1) L.R. Snyder, J.W. Dolan, and J.R. Gant, J. Chromatogr. A 165, 3 (1979).
(2) P.J. Schoenmakers, H.A.H. Billiet, R. Tijssen, and L. de Galan, J. Chromatogr. 149, 519 (1978).
(3) P. Jandera, J. Chromatogr. A, 1126, 195 (2006).
(4) J. Billen, K. Broeckhoven, A. Liekens, K. Choikhet, G. Rozing, and G. Desmet, J. Chromatogr. A 1210, 30 (2008).
(5) K. Broeckhoven, M. Verstraeten, K. Choikhet, M. Dittmann, K. Witt, and G. Desmet, J. Chromatogr. A 1218, 1153 (2011).
(6) M. Verstraeten, K. Broeckhoven, M. Dittmann, K. Choikhet, K. Witt, and G. Desmet, J. Chromatogr. A 1218, 1170 (2011).
(7) L.R. Snyder, J. Chromatogr. 13, 415 (1964).
(8) N. Tanaka, T. Yoshimura, and M. Araki, J. Chromatogr. 406, 247 (1987) .
(9) H. Poppe, J.C. Kraak, J.F.K. Huber, and H.M. van der Berg, Chromatographia 14, 515 (1981).
(10) H. Poppe, J. Paanakker, and M. Bronckhorst, J. Chromatogr. 204, 77 (1981).
Matthias Verstraeten, Ken Broeckhoven, and Gert Desmet are with Vrije Universiteit Brussel, in Brussels, Belgium.
Klaus Witt, Konstantin Choikhet, and Monika Dittmann are with Agilent Technologies, in Waldbronn, Germany.
Direct correspondence to Gert Desmet at gedesmet@vub.ac.be.

Understanding FDA Recommendations for N-Nitrosamine Impurity Levels
April 17th 2025We spoke with Josh Hoerner, general manager of Purisys, which specializes in a small volume custom synthesis and specialized controlled substance manufacturing, to gain his perspective on FDA’s recommendations for acceptable intake limits for N-nitrosamine impurities.
University of Rouen-Normandy Scientists Explore Eco-Friendly Sampling Approach for GC-HRMS
April 17th 2025Root exudates—substances secreted by living plant roots—are challenging to sample, as they are typically extracted using artificial devices and can vary widely in both quantity and composition across plant species.
Determining the Serum Proteomic Profile in Migraine Patients with LC–MS
April 17th 2025Researchers used liquid chromatography–mass spectrometry (LC–MS) in their proteomic analysis to compare the serum proteome of migraine patients with healthy controls and to identify differentially expressed proteins as potential migraine biomarkers.


