Elevated Temperatures in Liquid Chromatography, Part III: A Closer Look at the van 't Hoff Equation
LCGC North America
An exploration of the usefulness and relevance of the van 't Hoff equation using various examples from the literature
Part I of this article series discussed some of the advantages of and practical considerations for elevated temperature separations in liquid chromatography (LC) (1). Part II reviewed some of the basic thermodynamics of chromatography and elevated temperature separations, which included a brief derivation and discussion of the van 't Hoff equation (2). This third and final part continues the exploration of elevated temperatures in LC with a more detailed discussion of the van 't Hoff equation, exploring its usefulness and relevance using various examples from the literature.
Van 't Hoff plots can be a useful and interesting part of data analysis for high-temperature liquid chromatography (LC). Here, in part III of this series, we take a closer look at the van 't Hoff equation using various examples from the literature.
Review of the Advantages of Elevated-Temperature Separations
Elevated temperatures offer a number of benefits in LC. One such benefit is that they facilitate retention mapping in which the retention factor, k, is measured at different temperatures so that the values of k over a range of temperatures can be predicted (3,4). Retention mapping can also include the probing and predicting of k at different mobile-phase compositions and is widely used in method development (3,5,6). Another benefit is that selectivity (α) may change with temperature, which is important for retention mapping and is another parameter that can be considered in method development (3,5,6). Also, increasing temperatures can improve sample throughput because the van Deemter minima shifts to higher flow rates; that is, the optimal efficiency for a separation shifts to a higher mobile-phase velocity (7–9). Finally, a decrease in the organic modifier is possible due to the change in the polarity of water at increasing temperatures; water behaves more like an organic solvent at elevated temperatures. Furthermore, a more aqueous mobile phase is considered "greener" because of a reduction in the amount of organic modifier used (10–14). Clearly, there are good reasons for considering the use of elevated temperatures in LC. Now, let's discuss various aspects of high-temperature separations in the context of the van 't Hoff equation.
Review of the van 't Hoff Equation
The van 't Hoff equation is derived from the following two basic thermodynamic equations:

where ΔG0 is the Gibbs free energy, ΔH0 is the enthalpy of transfer, T is the absolute temperature in kelvins, ΔS0 is the entropy of transfer, R is the gas constant, and K is the equilibrium constant. When we equate these two equations and solve for ln K we achieve the van 't Hoff equation:

As discussed in part II (2), ln K = ln kβ, where k is the retention factor and β is the phase ratio (VM/VS) — the ratio of the mobile-phase volume and stationary-phase volume. By substituting kβ for K in equation 3 we obtain the van 't Hoff equation as it is commonly encountered in LC:

Note that sometimes Φ is used instead of β, where Φ = 1/β = VS/VM. Thus, an equivalent form of equation 4 is:

Unfortunately, both β and Φ are referred to as the "phase ratio."
The van 't Hoff Equation in Retention Mapping
Van 't Hoff plots are often linear, which makes them useful in retention mapping. For this purpose, a simpler, but mathematically equivalent, version of equation 4 can be used (3,15):

where plots of log k vs. 1/T are generated under isocratic conditions (6,16–18) and A and B either have values as given by equation 5 or may be viewed empirically. While to some degree this semi-empirical equation conceals the underlying thermodynamics, in most cases this is not the primary concern. Of course, retention mapping may be conveniently performed using commercially available software.
When using temperature as a variable to optimize a separation, chromatographers can create a series of van 't Hoff plots for various analytes to determine the best temperature for the separation. To demonstrate this optimization process, Figure 1 shows a series of van 't Hoff plots for various drugs. In this example, some of the drugs, such as in the circled lines in the plot, show different slopes and change elution order (reverse selectivity) where their lines cross. Obviously, the temperature at this crossing point would be a very poor choice for separation conditions because the peaks would coelute, that is, α = k2/k1 = 1. Thus, in a separation involving multiple analytes, a series of van 't Hoff plots can be used to optimize the separation.
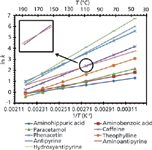
Figure 1: Van ’t Hoff plots for test probes showing linear relationships between the natural logs of the retention factors vs. 1/T for these compounds. The inset shows the point at which the elution is reversed for aminoantipyrine and caffeine. From left to right, the data points correspond to 180, 150, 120, 90, 60, and 40 °C. Adapted from reference 10 with permission.
Thermodynamics of Linear van 't Hoff Plots
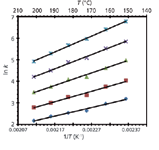
Linear van 't Hoff plots such as those in Figure 1 suggest that the retention mechanisms for the analytes are constant; that is, the values for ΔH0, ΔS0, and β for the analytes are constant over the temperature range under consideration. Of course there is the possibility that ΔH0, ΔS0, and β are mutually changing so that the net effect is a linear relationship, but this will be discussed below. If the retention mechanism is constant with temperature it may be possible to compare the enthalpies (ΔH0) and entropies (ΔS0) of similar analytes on the same column, or of a single analyte on different columns. It should be noted again that the ΔH0 transfer of the analyte from the mobile phase to the stationary phase can be derived from the slope of its van 't Hoff plot (see equation 4) (2). When ΔH0 is negative, which is typically the case in reversed-phase chromatography, transfer of the analyte from the mobile phase to the stationary phase is favored and exothermic. Clearly, the more negative ΔH0 is the more favorable the interaction between the analyte and the stationary phase is, which generally leads to larger values of k. For example, in reversed-phase chromatography, the ΔH0 values for a homologous series of increasingly hydrophobic analytes such as the alkyl benzenes with longer and longer alkyl chains should steadily become more negative (exothermic). This effect is shown in Figure 2: The alkyl benzenes with longer alkyl chain lengths (more hydrophobic) have larger slopes than those with shorter chain lengths (less hydrophobic) (19).
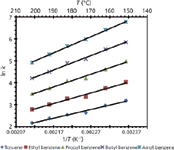
Figure 2: Van ’t Hoff plots for a homologous series of alkyl benzenes. Increases in alkyl character result in larger slope values indicating more negative ÎH0 values. From right to left, the data points correspond to 200, 190, 180, 170, 160, and 150 °C. Adapted from reference 19 with permission.
Nonlinearities in van 't Hoff Plots Because of Phase Transitions
As a corollary to the previous statements, a nonlinear van 't Hoff plot shows that ΔH0, ΔS0, or β are changing, that is, the retention mechanism for the analyte is not constant over the temperature range under consideration. A possible explanation for a nonlinear van 't Hoff plot is a phase transition in the stationary phase; at lower temperatures the stationary phase will generally be in a solid-like conformation and at higher temperatures it will adopt a more liquid-like conformation (13,20,21). Thus, a nonlinear van 't Hoff plot may indicate that the thermodynamic interactions between the analyte and stationary phase change when the stationary phase undergoes a phase transition. The possibility of a phase transition in a C18 phase seems reasonable because long chain hydrocarbons have melting points in the range of 20–50 °C, for example, the melting point of octadecane is approximately 28 °C. For silica-based C18 stationary phases, this phase transition may occur in the range of 20–50 °C (22–24). Of course, the melting transition of a C18 stationary phase is much more complicated than the simple melting of a pure hydrocarbon because of the tethering of the chains in the stationary phase, the density or packing of the chains, and the presence of other chemical groups in the film such as endcapping agents.
Other phase transitions at higher temperatures have also been reported. For example, a phase transition around 100 °C was found for a silica-based hybrid C18 column (Figure 3). This transition was attributed to a change in the conformation of the stationary phase in the presence of the mobile phase as a function of temperature (19). This idea was substantiated by solid-state nuclear magnetic resonance (NMR) spectroscopy, which showed, over a temperature range of 30–150 °C, that the dry stationary phase did not undergo any conformational changes. Differential scanning calorimetry (DSC) was also performed on the stationary phase under conditions that mimicked typical LC mobile phase conditions. DSC showed thermal desorption of the mobile phase (70:30 water–acetonitrile) from the stationary phase around the phase transition point (circa 97 °C), suggesting a change in the conformation of the stationary phase when the mobile phase was present.
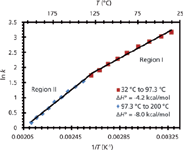
Figure 3: Van ’t Hoff plot for toluene demonstrating curvilinear behavior around 100 °C. Adapted from reference 19 with permission.
The phase transition in Figure 3 produces two linear van 't Hoff plots: region I at lower temperatures (32–97.3 °C) and region II at higher temperatures (97.3–200 °C). Interestingly, ΔH0 in region II is approximately twice that of region I. Coym and Dorsey (25) discussed this possibility of an increase in ΔH0 following a phase transition:
It may seem odd that the enthalpy of transfer (retention) at high temperature is more favorable than at low temperature, because retention is greater at low temperature. The thermodynamic quantity that governs retention is the free energy (ΔG0), which has an entropy component (ΔS0). Because of the change in hydrogen bond structure of water with temperature, the entropy change associated with retention changes with temperature. At lower temperatures, where the mobile phase is hydrogen bonded, there is a favorable entropy change upon retention. This is commonly referred to as "hydrophobic effect." However, at high temperatures, where there is little or no hydrogen bonding, the entropy change would be expected to be much less. As a result, although the enthalpy (ΔH0) of retention is more favorable at high temperature, it is outweighed by the entropic (ΔS0) contribution.

Figure 4: Van ’t Hoff plots of protriptyline obtained at pH 7.8. Column: (a) Inertsil ODS 3V, (b) X-Terra RP18. Flow rate: 1.0 mL/min. Temperature increases from right to left. Adapted from reference 33 with permission.
Irregularities in van 't Hoff Plots Because of pH Effects
Unusual van 't Hoff plots may be observed in the separation of acids and bases (26) because a change in the temperature, and therefore polarity, of the mobile phase can affect the pKa and pKb values of weak acids and bases. Obviously, a change in the ionization state of an analyte or buffer in a mobile phase can alter retention (27), and selectivity changes associated with temperature changes are larger for polar and ionizable analytes than for nonpolar analytes (28–32). In particular, an analyte's pKa value can shift approximately –0.03 pKa units per degree Celsius (33,34). These effects are complex and are usually strongly manifested when pH ˜≈ pKa; that is, where both the weak acid and conjugate base have appreciable concentrations (29). The success of these types of separations depends on the nature of the buffer and analyte (30). Two examples are shown in Figures 4 and 5. Figure 4 shows an increase in retention of protriptyline, a tricyclic antidepressant, with increasing temperature on two different columns. Figure 5 also shows analytes that exhibit (unusual) negative slopes in their van 't Hoff plots. As a side note, temperatures can also affect large molecules — for example, proteins may undergo conformational changes with temperature (31).

Figure 5: Van ’t Hoff plots of acidic and basics analytes. (a) Phosphate buffer pH (25 °C) = 8.10, and (b) tris + HCl buffer pH (25 °C) = 8.09; mobile phase contains 50% (v/v) methanol. Analytes: â = 2,4-dichlorophenol, â = 2,6-dichlorophenol, â² = benzylamine, â = benzyldimethylamine. Adapted from reference 29 with permission.
Confirming the Linearity of van 't Hoff Plots and Evaluating Changes in Entropy
Chester and Coym (35) explored the possibility of β changing during a van 't Hoff analysis and noted that, at least in theory, a change in β could compensate for changes in ΔH0 or ΔS0, leading to an (apparently) linear van 't Hoff relationship. This statement is consistent with some of the concerns raised by Gritti and Guichon (36,37); that is, different compensating or canceling factors may lead to the linearity often observed in van 't Hoff plots. To eliminate this possibility, Chester and Coym (35) noted a slightly more advanced use of van 't Hoff analysis in which one plots ln β vs. 1/T, where α is the selectivity (k2/k1) between two analytes. This relationship is obtained from equation 4 by subtracting the van 't Hoff relationship for the second analyte from the van 't Hoff relationship for the first, leading to the following equation:

which can also be expressed as

If the individual van 't Hoff relationships for the first and second analytes are linear, and the van 't Hoff relationship in equation 7 or 8 for their selectivity is also linear, then there is a higher probability that ΔH0, ΔS0, and β are constant (or at least not substantially changing) over the temperature range in question. Thus, if one wishes to use a van 't Hoff analysis to extract ΔH0 and ΔS0 values for an analyte, it would probably be advisable to apply this additional check on the data. If the resulting plot of equation 7 or 8 is linear, it would add credence to any claim that meaningful thermodynamic information could be extracted from the analysis. In addition, if the plot of ln α vs. 1/T is nonlinear then the stationary phase may undergo a conformational change in the temperature range studied (38–41).
As a corollary to these last points, using b1 = ΔS01/R – ln β for the first analyte and b2 = ΔS02/R – ln β for the second analyte under the same conditions or same column, we can calculate the difference in entropies of transfer for the two analytes as ΔΔS02,1 = ΔS02 – ΔS01 = R(b2 – b1), where this latter term is the gas constant multiplied by the difference between the y-intercepts of the two van 't Hoff plots for the two analytes. Note that the phase ratio, which we often do not know, has canceled, leaving us with the difference between the two entropies of transfer. This analysis can be useful on a series of compounds, where they are all compared to one member of the series.
Concerns About the van 't Hoff Equation
A careful study of the van 't Hoff equation and its use in elevated-temperature LC suggests that there is some question regarding its fundamental accuracy (36,37). For example, the van 't Hoff relationship assumes that the stationary phase is homogeneous, which is clearly not the case — in general, a stationary phase will contain different types of sites, which will have different affinities for a given analyte. The van 't Hoff equation also assumes that both the stationary phase and the mobile phase remain constant as a function of temperature. Neither will be entirely true. The adsorption and absorption (partitioning) of mobile-phase components in the stationary phase, which will alter the properties of the stationary phase, will vary with temperature, and the mobile phase will also change with temperature; for example, the static permittivity (dielectric constant) of water will change with temperature. Perhaps a measured view of these concerns is to acknowledge their validity, while also noting that in many circumstances it appears that these effects are not so extreme that useful information cannot be obtained by van 't Hoff analysis.
Conclusions
Van 't Hoff plots can be a useful and interesting part of data analysis for high temperature LC. They are a valuable tool in an empirical sense for retention modeling, and thermodynamic data may be extracted from them. They can reveal phase transitions in stationary phases, and the changes in pKa values of analytes with temperature. Plots of ln α vs. 1/T can help confirm that ΔH0 and ΔS0 are constant with temperature. It should be understood that the underlying assumptions of the van 't Hoff equation are not entirely correct.
References
(1) D.S. Jensen, T. Teutenberg, J. Clark, and M.R. Linford, LCGC North Am. 30(9), 850–862 (2012).
(2) D.S. Jensen, T. Teutenberg, J. Clark, and M.R. Linford, LCGC North Am. 30(11), 992–998 (2012).
(3) J.W. Dolan, J. Chromatogr., A 965(1–2), 195–205 (2002).
(4) S. Wiese, T. Teutenberg, and T.C. Schmidt, J. Chromatogr., A 1218(39), 6898–6906 (2011).
(5) J.W. Dolan, L.R. Snyder, N.M. Djordjevic, D.W. Hill, D.L. Saunders, L. Van Heukelem, and T.J. Waeghe, J. Chromatogr., A 803(1–2), 1–31 (1998).
(6) R.G. Wolcott, J.W. Dolan, and L.R. Snyder, J. Chromatogr., A 869(1–2), 3–25 (2000).
(7) G. Vanhoenacker, F. David, and P. Sandra, Chromatogr. Today 3(3), 14–16 (2010).
(8) Y. Xiang, B. Yan, B. Yue, C.V. McNeff, P.W. Carr, and M.L. Lee, J. Chromatogr., A 983(1–2), 83-89 (2003).
(9) G. Vanhoenacker and P. Sandra, Anal. Bioanal. Chem. 390(1), 245–248 (2008).
(10) A.M. Edge, S. Shillingford, C. Smith, R. Payne, and I.D. Wilson, J. Chromatogr., A 1132(1–2), 206–210 (2006).
(11) C.M. Hong and C. Horváth, J. Chromatogr., A 788(1–2), 51–61 (1997).
(12) J.V. Tran, P. Molander, T. Greibrokk, and E. Lundanes, J. Sep. Sci. 24(12), 930–940 (2001).
(13) S. Heinisch and J.-L. Rocca, J. Chromatogr., A 1216(4), 642–658 (2009).
(14) J. Bowermast and H.M. McNair, J. Chromatogr. Sci. 22, 165–170 (1984).
(15) L.R. Snyder, J.J. Kirkland, and J.W. Dolan, Introduction to Modern Liquid Chromatography (Wiley, Hoboken, New Jersey, 2010).
(16) P.L. Zhu, L.R. Snyder, J.W. Dolan, N.M. Djordjevic, D.W. Hill, L.C. Sander, and T.J. Waeghe, J. Chromatogr., A 756(1–2), 21–39 (1996).
(17) P.L. Zhu, J.W. Dolan, and L.R. Snyder, J. Chromatogr., A 756(1–2), 41–50 (1996).
(18) R.G. Wolcott, J.W. Dolan, L.R. Snyder, S.R. Bakalyar, M.A. Arnold, and J.A. Nichols, J. Chromatogr., A 869(1–2), 211–230 (2000).
(19) Y. Liu, N. Grinberg, K.C. Thompson, R.M. Wenslow, U.D. Neue, D. Morrison, T.H. Walter, J E. O'Gara, and K.D. Wyndham, Anal. Chim. Acta 554(1–2), 144–151 (2005).
(20) J.F. Wheeler, T.L. Beck, S.J. Klatte, L.A. Cole, and J.G. Dorsey, J. Chromatogr., A 656(1–2), 317–333 (1993).
(21) K.B. Sentell and A.N. Henderson, Anal. Chim. Acta 246(1), 139–149 (1991).
(22) L.A. Cole and J.G. Dorsey, Anal. Chem. 64(13), 1317–1323 (1992).
(23) L.A. Cole, J.G. Dorsey, and K.A. Dill, Anal. Chem. 64(13), 1324–1327 (1992).
(24) D. Morel and J. Serpinet, J. Chromatogr., A 214(2), 202–208 (1981).
(25) J.W. Coym and J.G. Dorsey, J. Chromatogr., A 1035(1), 23–29 (2004).
(26) T. Teutenberg, Anal. Chim. Acta 643(1–2), 1–12 (2009).
(27) B. Hemmateenejad, J. Chemom. 19(11–12), 657–667 (2005).
(28) S. Pous-Torres, J.R. Torres-Lapasió, J.J. Baeza-Baeza, and M.C. García-Álvarez-Coque, J. Chromatogr., A 1163(1–2), 49–62 (2007).
(29) C.B. Castells, L.G. Gagliardi, C. Ràfols, M. Rosés, and E. Bosch, J. Chromatogr., A 1042(1–2), 23–36 (2004).
(30) L.G. Gagliardi, C.B. Castells, C. Ràfols, M. Rosés, and E. Bosch, J. Chromatogr., A 1077(2), 159–169 (2005).
(31) R.C. Chloupek, W.S. Hancock, B.A. Marchylo, J.J. Kirkland, B.E. Boyes, and L.R. Snyder, J. Chromatogr., A 686(1), 45–59 (1994).
(32) L.G. Gagliardi, C.B. Castells, C. Ràfols, M. Rosés, and E. Bosch, Anal. Chem. 78(16), 5858–5867 (2006).
(33) S.M.C. Buckenmaier, D.V. McCalley, and M.R. Euerby, J. Chromatogr., A 1060(1–2), 117–126 (2004).
(34) S.M.C. Buckenmaier, D.V. McCalley, and M R. Euerby, J. Chromatogr., A 1026(1–2), 251–259 (2004).
(35) T.L. Chester and J.W. Coym, J. Chromatogr. A 1003(1–2), 101–111 (2003).
(36) F. Gritti and G. Guiochon, J. Chromatogr., A 1099(1–2), 1–42 (2005).
(37) F. Gritti and G. Guiochon, Anal. Chem. 78(13), 4642–4653 (2006).
(38) F. Wang, T. O'Brien, T. Dowling, G. Bicker, and J. Wyvratt, J. Chromatogr., A958(1–2), 69–77 (2002).
(39) T. O'Brien, L. Crocker, R. Thompson, K. Thompson, P.H. Toma, D.A. Conlon, B. Feibush, C. Moeder, G. Bicker, and N. Grinberg, Anal. Chem.69(11), 1999–2007 (1997).
(40) E. Papadopoulou-Mourkidou, Anal. Chem. 61(10), 1149–1151 (1989).
(41) R.K. Gilpin, S.E. Ehtesham, and R.B. Gregory, Anal. Chem.63(24), 2825–2828 (1991).
David S. Jensen and Matthew R. Linford are with the Department of Chemistry and Biochemistry at Brigham Young University in Provo, Utah. Direct correspondence to: mrlinford@chem.byu.edu.
Thorsten Teutenberg is with the Institut für Energie- und Umwelttechnik e. V. in Duisburg, Germany.
Jody Clark is with Selerity Technologies Inc., in Salt Lake City, Utah.

New TRC Facility Accelerates Innovation and Delivery
April 25th 2025We’ve expanded our capabilities with a state-of-the-art, 200,000 sq ft TRC facility in Toronto, completed in 2024 and staffed by over 100 PhD- and MSc-level scientists. This investment enables the development of more innovative compounds, a broader catalogue and custom offering, and streamlined operations for faster delivery. • Our extensive range of over 100,000 high-quality research chemicals—including APIs, metabolites, and impurities in both native and stable isotope-labelled forms—provides essential tools for uncovering molecular disease mechanisms and exploring new opportunities for therapeutic intervention.
New Guide: Characterising Impurity Standards – What Defines “Good Enough?”
April 25th 2025Impurity reference standards (IRSs) are essential for accurately identifying and quantifying impurities in pharmaceutical development and manufacturing. Yet, with limited regulatory guidance on how much characterisation is truly required for different applications, selecting the right standard can be challenging. To help, LGC has developed a new interactive multimedia guide, packed with expert insights to support your decision-making and give you greater confidence when choosing the right IRS for your specific needs.

.png&w=3840&q=75)

.png&w=3840&q=75)


.png&w=3840&q=75)


.png&w=3840&q=75)


