Maximization of Selectivity in Reversed-Phase Liquid Chromatographic Method Development Strategies
LCGC North America
The approach described here will help chromatographers produce highly efficient method development strategies for reversed-phase LC separations in a relatively short time frame.
The selectivity of different combinations of organic modifiers, pH, and types of reversed-phase liquid chromatography (LC) materials has been characterized using Tanaka column characterization, linear solvent energy relationships (LSER), and selectivity correlations. The three characterization techniques highlighted the potential complementary selectivity of these phases and conditions as well as the type and dominancy of some of the retention mechanisms involved. Subsequently, selectivity differences were proven to be valid in the practical separation of acids, bases, and neutral analytes. This paper aims to help chromatographers to produce highly efficient method development strategies for reversed-phase LC separations in a relatively short time frame.
A range of columns are available on the market for small molecule reversed-phase liquid chromatography (LC) method development strategies. These types of columns are purported to possess complementary selectivities in order to maximize the probability of separating all components in a mixture. Reversed-phase LC materials complementary to the ubiquitous and standard C18 include pentafluorophenyl (PFP), phenyl, cyano (CN), extended polar selectivity, and polar embedded group (PEG) phases. In addition to a hydrophobic retention mechanism, these types of phases can offer additional (augmented) retention mechanisms such as π-π, dipole–dipole, dipole-induced dipole, hydrogen bonding, ion-ion, ion-dipole, ion-induced dipole, and steric interactions (1) when compared to conventional C18 phases. Retention of analytes on reversed-phase LC materials is dependent on the dominancy or proportion of each stationary–mobile phase–analyte interaction that occurs.
There is a growing trend within many industries, and particularly within the pharmaceutical sector, to utilize reversed-phase LC column and solvent switching strategies to rapidly assess which combination of stationary and mobile phase is the most suitable to progress into retention modeling and optimization studies (2).
This article presents an unbiased and in-depth evaluation of a representative range of complementary stationary phases from a single manufacturer that are recommended for reversed-phase LC method development strategies. The five totally porous stationary phases investigated are based on the same silica, utilizing the same monofunctional bonding and endcapping technologies that generate phases of approximately the same surface coverage and hydrophobicity. It is well known that reversed-phase LC materials that possess the same bonded ligand on differing base silica can yield products with differing chromatographic properties (3). Hence, there was a need to limit the study to a single manufacturer’s range of materials so that the underlying silica chemistry would not confuse any interpretations and that any differences in chromatographic selectivity observed would be attributed only to the differences in the type of ligands. It is expected that similar deductions regarding selectivity should be valid in respect of another manufacturer’s method development phases. In addition, the use of high-pH-stable phases (both totally porous and superficially porous) has been evaluated in terms of chromatographic selectivity as a function of pH, organic modifier, and stationary-phase chemistry. Empirical-based approaches (that is, principal component analysis [PCA], column characterization, and selectivity correlations) and a model-based approach (linear solvent energy relationships [LSER]) have been employed to provide a scientific rationale for the use of complementary stationary- and mobile-phase combinations.
Experimental
Experimental work was performed on Agilent 1260 and 1290 LC systems. All columns were of 50 mm x 2.1 mm format and a particle size of 2.5 and 3 μm, respectively, for the superficially porous and totally porous materials unless otherwise stated. Table I details the columns investigated. As mentioned previously, columns from the same manufacturer were chosen so that differences in chromatographic selectivity observed would be attributed solely to the differences in the type of ligands and not different silica chemistries from different manufacturers.

Their integrity was assessed periodically throughout the runs by injecting a standard of toluene. pH measurements were recorded in the aqueous fraction of the mobile phase. PCA was performed using Simca-P+ version 11.5 software (Umetrics). To give all variables the same importance, the variables were “auto scaled”; that is, the average was subtracted from each variable and each variable was divided by its standard deviation. Physical properties, logD, and pKa determinations of analytes were performed using ACD/Percepta v 2015 (ACD/Labs). Multivariable regression analysis, Fisher F test, and selectivity correlations were performed using Microsoft Excel.
Results and Discussion
Column chromatographic properties and hence the selectivity of stationary phases are commonly assessed by comparing the retention differences between analytes of well-defined physical or chemical properties-see reference 4 for a review on column characterization databases and procedures. Popular protocols include the PQRI (5,6), NIST 870 methodology (6,7), University of Leuven (8), the supercritical fluid chromatography method (9), and the Tanaka (10) plus its extended variant (3,11–14) approaches. All of these approaches are equally valid in comparing column selectivity. The extended Tanaka approach determines chromatographic parameters that are associated with hydrophobicity (kPB, αCH2), steric or shape selectivity (αT/O), hydrogen bonding capacity (αC/P), ion-exchange capacity at pH 2.7 and 7.6 (αB/P), aromatic selectivity (αTNB/T), phenolic selectivity (αP/BA), and dipole-dipole interactions (α1,2-/1,4-DNB).
An alternative approach is that of LSER, which involves a series of analytes of well-defined structural properties chromatographed on each column using either methanol or acetonitrile (15,16). Multiple regression analysis of the analyte’s retention against their Abraham’s solvatochromic solute parameters (17) allows a number of stationary phase properties to be determined.
An assessment of the chromatographic selectivity between two sets of stationary- and mobile-phase conditions can be conveniently derived from the correlation of the retention times of a structurally diverse set of analytes chromatographed using both LC conditions (18).
This article will describe the characterization of a range of complementary reversed-phase LC phases (based on the same base silica) using the extended Tanaka, chromatographic selectivity, and LSER approaches. It will also assess the practical usability of these reversed-phase materials in method development strategies.
Tanaka Column Characterization Approach: PCA (19,20) is a general tool for interpretation of large data tables. In PCA the number of variables (the column characterization parameters) is reduced by a projection of the objects (the stationary phases) onto a smaller number of new variables termed principal components (PC). The PCs are orientated so that the first PC describes as much as possible of the original variation between the objects. The second PC is orientated in an orthogonal manner to the first PC and is directed to describe as much as possible of the remaining variation and so on. The projection of objects onto a PC is called scores-by plotting the scores for two PCs it is possible to graphically find similarities and differences between objects. The distance between objects in a score plot shows if they are similar or different. How much of each of the original variables that are included in a PC is described by so-called loadings, one for each variable. By plotting the loadings for the two PCs and superimposing it onto the score plot, it is possible to see which of the original variables are the most important (the longest distance from the origin) and if any variables are correlated (the same or opposite directions on a straight line through the origin). The reason why two objects are different can easily be determined with a so-called contribution plot. This type of plot shows which variables (that is, the chromatographic parameters) cause a difference between two objects (the stationary phases).
From the PCA score plot (see Figure 1) of 13 x C18, 5 x PFP, 6 x phenyl, 8 x PEG, and 2 x cyano stationary phases, from a range of manufacturers (both superficially [SPP] and totally porous particles [TPP] of 2.5–3.5 μm), based on their Tanaka column characterization data (column details can be supplied by the authors on request) the heterogeneous nature of the PFP, phenyl, PEG, and cyano class of phases can be clearly seen as demonstrated by the distance between them. This is attributed to the difference in silica, pore size, bonding functionality, type of endcapping, and, more importantly, differences in the silanes used. For example, it has previously been shown that the length of the alkyl spacer between the silica and the phenyl moiety can have a profound effect on the resultant chromatographic properties of the phase (11). The PCA results also highlight the diversity within different classes of phases as reported previously for PFP (12) and PEG (13). In contrast, the new generation C18 phases appear to be clustered more closely together, highlighting their more similar chromatographic properties.
Figure 1: PCA score and loading plot of a representative range of phases using
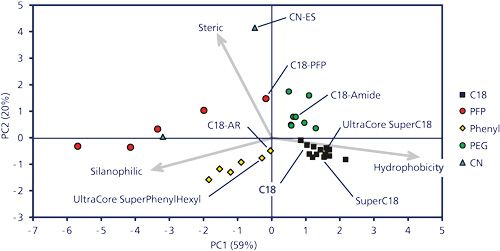
the standard Tanaka column characterization protocol. The Tanaka column characterization data have been taken from the ACD database (21).
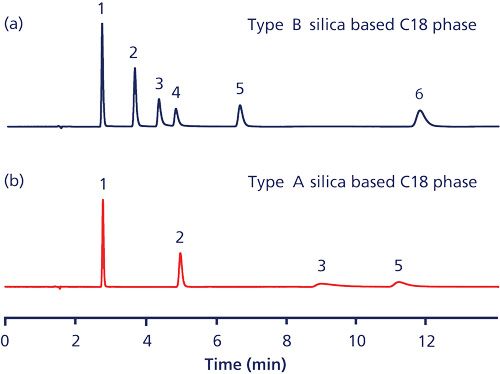
The importance of using the same base silica was highlighted in Figure 2 in which identical C18 bonding was applied to a Type A and Type B silica. The acidic nature of the Type A silica compared to the Type B silica produced a markedly different selectivity and even caused irreversible adsorption of the bases remacemide and nortripyline (peaks 4 and 6) onto the Type A silica C18 phase. Therefore, if meaningful interpretations regarding ligand–mobile phase–analyte interactions are to be made, then the ligands must be bonded onto the same base silica.
Figure 2: Isocratic chromatography of five basic analytes plus phenol as a neutral analyte using 20 mM KH2PO4, pH 2.7, in 54.5:45.5 (v/v) water–methanol, 1 mL/min, 60 °C, λ = 210 nm, 150 mm x 4.6 mm, 5-µm. (a) Type B silica-based C18, (b) Type A silica-based C18. Peaks: 1 = phenol, 2 = proprietary base X, 3 = proprietary base Y, 4 = remacemide, 5 = diphenhydramine, 6 = nortripyline.
The PCA score plot (Figure 3) of the six TPP (3 μm) and two SPP (2.5 μm) phases from a single manufacturer using the extended Tanaka parameters (see Table 1) illustrates that these phases possess complementary chromatographic properties as demonstrated by the distance between them. However, the two phenyl phases (the TPP phenyl and the high-pH SPP phenyl) are chromatographically similar overall but very different from their porous and superficially porous C18 phases counterparts. The extended pH range phases, while being chromatographically similar to their conventional versions, have the added advantage that they can be employed with high-pH mobile phases.
Figure 3: PCA score and loading plot of the phases using the extended Tanaka column characterization protocol.
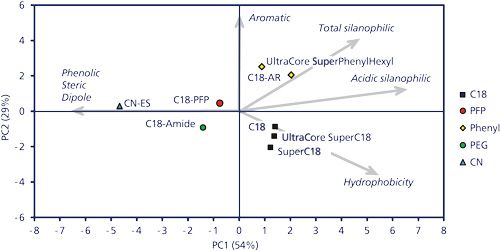
PCA contribution plots of each complementary phase against the standard C18 phase highlight the chromatographic differences that occur between them (data not shown). For example, the phenyl phases possessed additional aromatic selectivity (that is, π-π interactions as shown by increased αTNB/T and αC/P parameters [in addition to assessing hydrogen bonding selectivity, the latter term also assesses the π-π interaction of caffeine with phenyl moieties]); the PFP phase additional dipole–dipole (α1,2-/1,4-DNB), apparent steric/shape selectivity (αT/O), and aromatic selectivity; the PEG phase additional phenolic selectivity (αP/BA) and decreased silanophilic interactions (αB/P); the CN phase additional dipole–dipole, apparent steric/shape selectivity, phenolic selectivity, and decreased silanophilic interactions; and the high-pH-stable TPP C18 possessed enhanced hydrophobicity (kPB, αCH2), and decreased silanophilic activity at pH 7.6 compared to the standard C18 phase.
Linear Solvent Energy Relationships (LSER): The retention of the eight phases from one manufacturer was characterized by employing LSER using Abraham’s solvatochromic solute parameters (17) and studying the retention of 30 disparate solutes (22,23). The stationary phases were investigated with either methanol–water or acetonitrile–water gradients containing 20 mM ammonium formate at pH 3.
Retention time (tR) in gradient reversed-phase LC can be correlated with various fundamental solute properties as described in equation 1 (22):

where capitals indicate the solute properties while the properties of the separation conditions (system coefficients) are indicated by lower case letters in italics. The contribution from electron pair interactions is defined by eE, interactions of a dipole type by sS, hydrogen bond interactions aA and bB, and differences in cavity formation and dispersion interactions in the mobile and stationary phase by vV. Solute descriptors are E, excess molar refraction; S, dipolarity/polarizability; A, effective hydrogen bond acidity; B, effective hydrogen bond basicity; and V, McGowan’s volume. The intercept c and the regression coefficients e, s, v, a, and b are characteristic of the particular mobile and stationary phase combination and are obtained by multivariable linear regression of the retention times against the solute descriptors.
LSER regression coefficients and their corresponding statistical descriptors using equation 1 were determined for the eight stationary phases using either methanol or acetonitrile. The goodness of fit of the equations was acceptable (r2 > 0.95) and the validity of the regression hypothesis was demonstrated for all column and mobile phase combinations by the Fisher F-test (F > 90) (Data can be supplied by the authors on request). By comparing the coefficients of equation 1, the relative effects of different stationary phase properties can be revealed and thus assist in the understanding of which retention mechanism is responsible for the complementary selectivity observed between these reversed-phase LC materials.
Highlights from the LSER study are given below. A positive coefficient indicates that the respective molecular interaction is stronger in the stationary than in the mobile phase and hence increases retention. This is the case for v (measurement of cavity formation and dispersive interactions) and e (n- and π-electron interactions) coefficients. The magnitude of these two coefficients indicates that cavity formation together with dispersion is far more critical than electron-involved type interactions. A negative coefficient indicates molecular forces are more favorable in the mobile phase and hence decrease retention. Hydrogen bond donor and acceptor interactions and dipole-type forces fall into this class. The size of the coefficients highlights that solute molecular size and hydrogen bonding acceptor-basicity are the two main dominant retention controlling factors.
The e coefficient describes the solvated stationary phase and mobile phase ability to interact with solutes possessing n- and π-electrons. The larger e coefficients for the PEG, phenyl, CN, and PFP phases (compared to the C18 phase) suggest that solutes capable of donating n- and π-electrons are retained longer on these phases.
The PEG phase exhibited enhanced hydrogen bond basicity (a coefficient) than the other phases as a consequence of the amide functionality embedded in the silane ligand.
The phenyl and PFP phases displayed a greater ability to interact with solutes possessing π-electrons (e coefficient) via the phenyl and pentafluorophenyl functionality than the C18 phase.
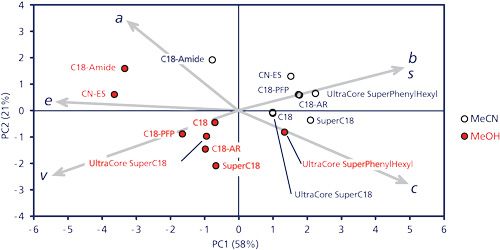
When the value of these terms in either methanol or acetonitrile was analyzed by PCA the score plot demonstrated that larger selectivity differences were observed in methanol compared to acetonitrile (Figure 4). Hence, in method development strategies, it is strongly recommended that methanol be evaluated if possible, in addition to the ubiquitously used acetonitrile.
Figure 4: PCA score and loading plot of the LSER coefficients for the columns evaluated as a function of organic modifier used.
Selectivity Correlations: A measurement of chromatographic selectivity between two sets of stationary- and mobile-phase conditions can be conveniently derived from the correlation of the retention time of a set of structurally diverse analytes chromatographed using both sets of LC conditions.
The selectivity correlations were determined using equation 2, where r2 = correlation coefficient between the retention times of the two phases under specified LC conditions (18). S values of 0 and 100 signify columns of equal and orthogonal retention selectivity:

A range of 45 analytes (10 acids, 11 bases, 14 neutrals, and 10 phenols) of differing physical properties was selected (the diversity of the set of analytes was proven by PCA score plots that highlighted the wide difference between the different classes of analytes and also within each class-data not shown) to produce the selectivity values shown in Table II.
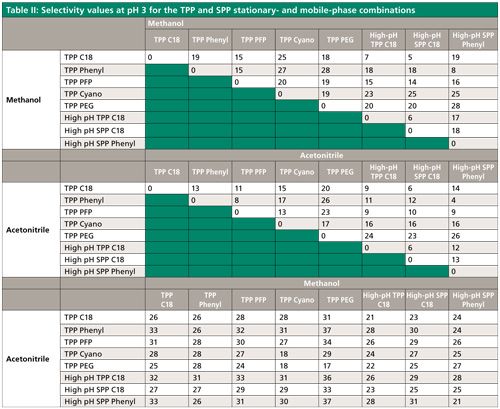
Table II demonstrates the similarity between TPP C18 and high-pH TPP and SPP C18 phases; for example, S values of <9 were observed between the extended pH range and the conventional C18 phases in methanol and acetonitrile; this is also true for the TPP phenyl and high-pH SPP phenyl phases. In comparison, S values between 15 and 25 are observed between the C18 phase and the four complementary phases in methanol, while the range is 11–20 for acetonitrile, suggesting reduced selectivity differences in acetonitrile compared to methanol.
The importance of organic modifier was highlighted by S values of between 17 and 30 being obtained when methanol and acetonitrile were compared with the same phases. Evaluating both stationary phase and organic modifier combinations generated S values in the range of 17 to 37, highlighting the usefulness of evaluating both stationary phase and organic modifier selectivity parameters in method development strategies.
The selectivity differences between the C18 and phenyl containing TPP and SPP phases were maintained (TPP, S= 19 and 13 in methanol and acetonitrile, respectively; SPP, S = 18 and 13 in methanol and acetonitrile, respectively), which should give the chromatographer reassurance that complementary selectivity can be maintained and exploited in either TPP or SPP range of phases.
There appeared to be only minor selectivity differences (S = 6 in either methanol or acetonitrile) between the TPP and SPP C18 phases that should be highly beneficial in method translation exercises. However, the high-pH SPP C18 possesses reduced hydrophobicity compared to its TPP variant (kPB = 7.93 compared to 6.33 for the TPP and SPP, respectively). This may, in part, be attributed to their difference in surface area. The same is true for the TPP phenyl and high-pH SPP phenyl phases because low selectivity values of 8 and 4 were obtained in methanol and acetonitrile respectively. Despite their similar selectivities, the SPP phenyl phase possesses significantly reduced hydrophobicity (kPB = 4.50 compared to 2.63 for the TPP and SPP phases, respectively).
Stationary-Phase Selectivity Examples: An evaluation of the selected method development phases by either the Tanaka column characterization, LSER, or selectivity values has demonstrated that they provide the chromatographer with a range of reversed-phase columns of complementary chromatographic selectivity to maximize the probability of achieving the desired separation. The following three examples highlight what these observed chromatographic differences equate to in practical complementary chromatographic selectivity using a range of typical gradient and isocratic liquid chromatography–mass spectrometry (LC–MS) and liquid chromatography–ultraviolet (LC–UV) conditions (differing gradient time, temperature, organic modifier, and low- to mid-pH conditions).
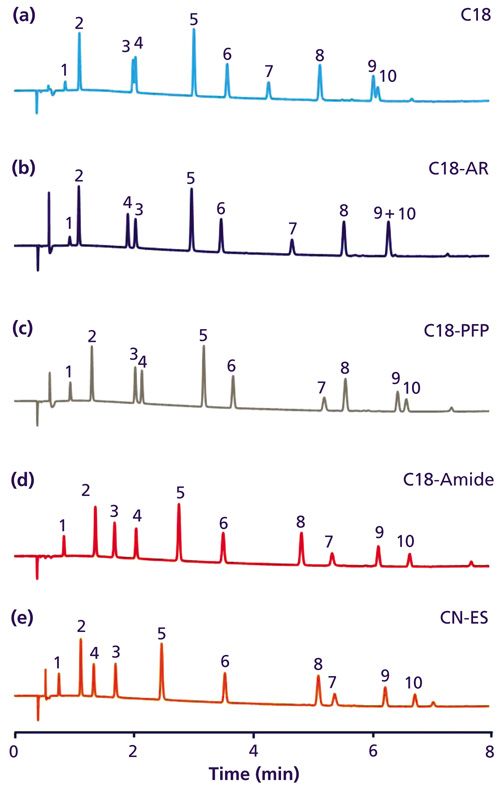
Example 1: Figure 5 highlights the selectivity differences between the five TPP stationary phases using “LC–MS friendly generic gradient conditions” (that is, methanol–ammonium acetate pH 6) in the separation of 10 paracetamol-related compounds. Three out of the five stationary phases generated separation of all 10 components. The PEG phase gave the best overall separation using these generic non-optimized conditions. It was of interest to observe that peaks 8 (2-nitrophenol) and 7 (4-nitrophenol) eluted in the order 7 before 8 in the cases of the PFP, C18, and phenyl phases while the reverse elution order was observed for the PEG and CN phases. This must, in part, be due to the 4-nitrophenol’s higher hydrogen bonding acidity, which can interact with the PEG and CN phases (that is, enhanced αP/BA and a coefficient). The CN and phenyl phases also caused an elution reversal of peaks 3 (2-aminophenol) and 4 (paracetamol) compared to the other three phases.
Figure 5: Gradient chromatography of paracetamol and related compounds on (a) ACE C18, (b) ACE C18-AR, (c) ACE C18-PFP, (d) ACE C18-Amide, and (e) ACE CN-ES phases (100 mm x 3 mm, 2-µm) gradient 5–95% B in 10 min, 1.2 mL/min, 40 °C, λ = 210 nm. Mobile-phase A: 20 mM ammonium acetate in water, pH 6; mobile-phase B: 20 mM ammonium acetate, pH 6, in 9:1 (v/v) methanol–water. Peaks: 1 = 4-aminophenol, 2 = hydroquinone, 3 = 2-aminophenol, 4 = paracetamol, 5 = 2-acetamidophenol, 6 = phenol, 7 = 4-nitrophenol, 8 = 2-nitrophenol, 9 = 4-chloroacetanilide, 10 = 4-chlorophenol.
Example 2: Figure 6 highlights the chromatographic selectivity differences between the five TPP phases using the UV popular conditions of a methanol–potassium phosphate pH 2.7 generic gradient in the separation of 18 pharmaceutically relevant compounds (including acids, bases, and neutral components).
Figure 6: Gradient chromatography of 18 pharmaceutically relevant compounds on (a) ACE C18, (b) ACE C18-AR, (c) ACE C18-PFP, (d) ACE C18-Amide, and (e) ACE CN-ES phases (50 x 2.1 mm, 5-µm) gradient 3 to 100% B in 5 min, 0.6 mL/min, 60 °C, λ = 214 nm. Mobile-phase A: 20 mM KH2PO4, pH 2.7 in water; mobile-phase B: 20 mM KH2PO4, pH 2.7 in 35:65 (v/v) water–methanol. Peaks: 1 = sotalol, 2 = salbutamol, 3 = N-acetylprocainamide, 4 = 3-hydroxybenzoic acid, 5 = pindolol, 6 = methylphenylsulfoxide, 7 = benzyl alcohol, 8 = quinoxaline, 9 = quinine, 10 = p-cresol, 11 = 1,2-dimethoxybenzene, 12 = furosemide, 13 = anisole, 14 = methylbenzoate, 15 = remacemide, 16 = nimesulide, 17 = ethylbenzoate, 18 = diflunisal.
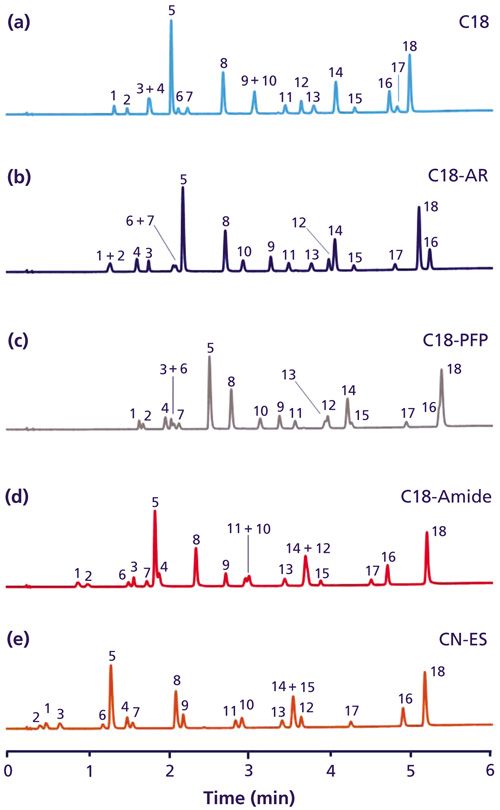
While it is of academic interest to hypothesize and understand which retention mechanism is responsible for the enhanced retention, from a practical viewpoint only, these chromatograms quickly inform the chromatographer of the number of peaks that are in the sample and that no one phase can separate all the components under these conditions. However, in this example, the C18 and phenyl phases are very good starting points for further retention modelling and optimization studies. It can be clearly seen in the C18 chromatogram that peaks 1 and 2 are separated while 3 and 4 are coeluted; in comparison peaks 1 and 2 are coeluted and 4 and 3 are separated on the phenyl phase.
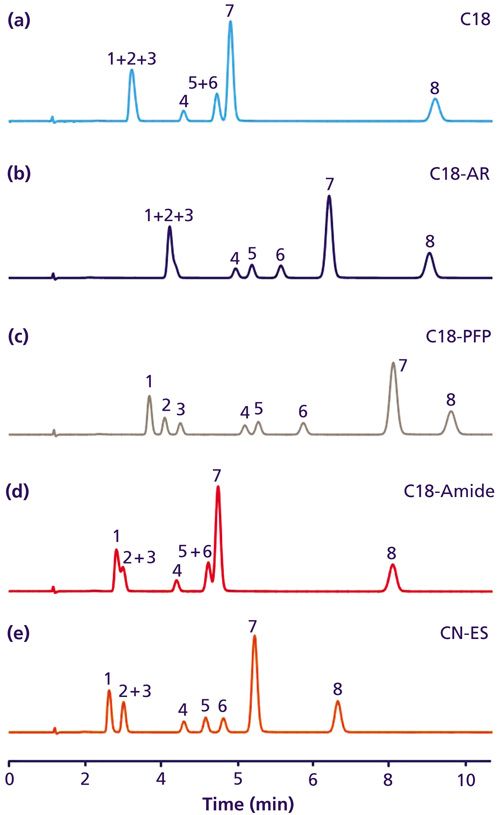
Example 3: Figure 7 highlights the chromatographic selectivity differences between the five TPP phases using an isocratic methanol–water separation of a range of methoxybenzene regio-isomers under the specified conditions. It is clear that the hydrophobic retention mechanism of the C18 phase alone is insufficient to differentiate and separate these components. Only the PFP phase successfully separated all the components. The C18, phenyl, and PEG phases did not provide complete separation of the 1,2,3- from the 1,2,4-trimethoxybenzene regio-isomer, while the PFP and CN phases afforded excellent separation. It is believed that the high steric or shape selectivity term (αT/O) associated with the later phases is responsible for the separation of these regio-isomers. In comparison, the 1,2-, 1,4-, and 1,3-dimethoxybenzene regio-isomers were easily separated on all the phases. Examples 1, 2, and 3 show that significant selectivity differences can be practically observed with S values between 10 and 25.
Figure 7: Isocratic chromatography of mono-, di-, and trimethoxybenzene regio-isomers using 1:1 (v/v) methanol–water, 0.21 mL/min, 40 °C, λ = 210 nm, 50 mm x 2.1 mm, 3-µm column. (a) ACE C18, (b) ACE C18-AR, (c) ACE C18-PFP, (d) ACE C18-Amide, and (e) ACE CN-ES. Peaks: 1 = 1,2,3-trimethoxybenzene, 2 = 1,2-dimethoxybenzene, 3 = 1,2,4-trimethoxybenzene, 4 = 1,4-dimethoxybenzene, 5 = methoxybenzene, 6 = 1,3-dimethoxybenzene, 7 = 1,3,5-trimethoxybenzene, 8 = toluene.
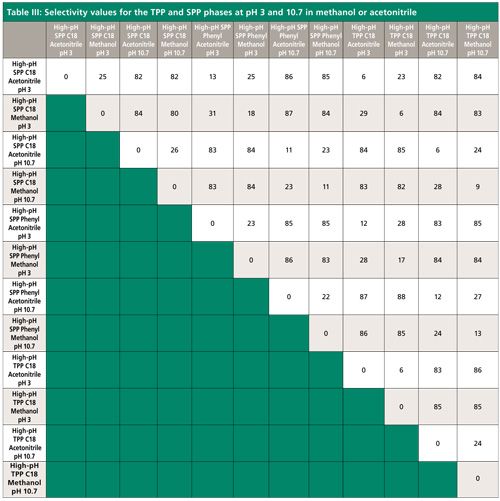
Mobile-Phase pH Selectivity: Over the last 10 years the chromatographic market place has seen a steady rise in the number of phases that can withstand high-pH conditions. This is an extremely attractive situation for the chromatographer because the ionization of acidic or basic analytes can now be switched on or off and hence retention controlled. The use of pH can dramatically change chromatographic selectivity as can be seen in the case of the high-pH TPP C18 phase selectivity values: in either methanol or acetonitrile, selectivity values >80 have been obtained for a set of 45 structurally diverse analytes (containing acidic, basic, neutral, and phenolic components) when low- and high-pH conditions are compared (see Table III). These are extremely high selectivity values compared against the typical values of 10–37 achieved when changes are made to the stationary phase or the organic modifier is changed from methanol to acetonitrile.
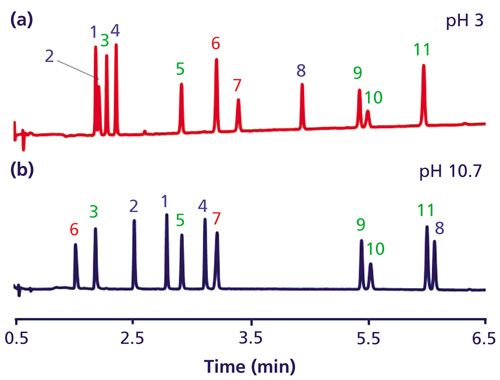
The usefulness of this approach can be seen in Figure 8 where the chromatographic elution profile of a mixture of neutral, basic, and phenolic components can be changed at low and high pH (24). The unionized bases (that is, nizatidine, N-acetylprocainamide, salbutamol, and reserpine) eluted later at pH 10.7 compared to their ionized forms at pH 3, while the ionized phenolic analytes (methyl parabens and p-cresol) were eluted earlier at pH 10.7 compared to pH 3. There was little movement of the neutral species (quinoxaline, piperine, toluene, and felodipine). These movements result in a totally different elution profile as shown in Figure 8. The elution order is not in line with the logD values of the analytes at either pH conditions (see Figure 8 caption), suggesting that there are other retention mechanisms in operation as well as hydrophobicity even on a high-purity C18 phase.
Figure 8: Gradient chromatography of a mixture of 11 bases, phenols, and neutral components on an ACE SuperC18 phase (50 mm x 2.1 mm, 3-µm column) gradient 3 to 100%B in 7 min, 0.42 mL/min, 40 °C, λ = 254 nm. (a) Mobile-phase A: 10 mM ammonium formate in water, pH 3; mobile-phase B: 10 mM ammonium formate, pH 3, in 90:10 (v/v) acetonitrile–water; (b) mobile-phase A: 18 mM ammonia in water pH 10.7; mobile-phase B: 18 mM ammonia, pH 10.7, in 90:10 (v/v) acetonitrile–water. Peaks (logD at pH 3 and 10.7): 1 = nizatidine (-3.01/0.15), 2 = salbutamol (-2.49/0.15), 3 = amiloride (0.95/1.03), 4 = N-acetylprocainamide (-1.8/1.28), 5 = quinoxaline (1.45/1.45), 6 = methyl paraben (2.14/-0.19), 7 = p-cresol (2.09/1.48), 8 = reserpine (1.09/4.16), 9 = piperine (2.55/2.55), 10 = toluene (2.61/2.61), 11 = felodipine (4.68/4.86). Peak assignments in red, blue, and green = phenolic, basic and neutral constituents, respectively (24).
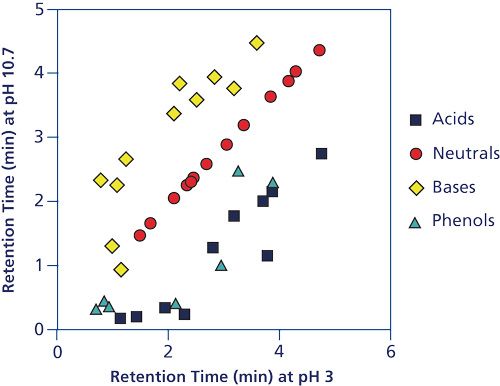
On closer inspection of the retention time correlations for the TPP or SPP version of the extended-pH-range C18 material (see Figure 9 for the SPP version) at low and high pH, it can be seen that the neutral components exhibit a near perfect correlation (S value = 1). The retention time correlations for these phases exhibited excellent complementary selectivity at low and high pH for basic, acidic, and phenolic analytes but not for neutrals.
Figure 9: Correlation of 45 analytes (10 acids, 11 bases, 10 phenols, and 14 neutrals) on the ACE UltraCore SuperC18 phase using gradient chromatography (50 mm x 2.1, 3-µm column) 3 to 100% B in 6 min, 0.6 mL/min, 60 °C. Mobile-phase A: 20 mM ammonium formate, pH 3, in water or 18 mM ammonia, pH 10.7, in water; mobile-phase B: 20 mM ammonium formate, pH 3, in 1:9 (v/v) water-methanol or 18 mM ammonia, pH 10.7, in 1:9 (v/v) water–methanol. Overall S value = 80, for the neutral components S = 1.
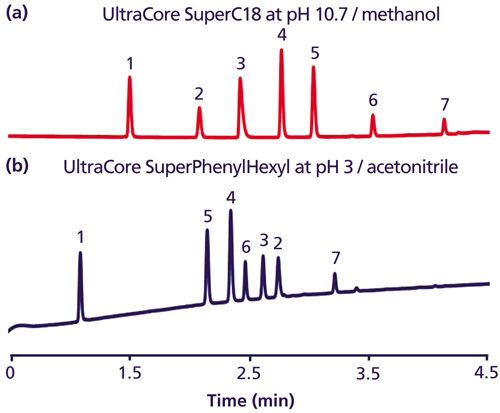
As a consequence, many leading stationary phase manufacturers have recently introduced additional stationary phase chemistries that are also stable at high-pH conditions to rectify this deficiency. For example, the high-pH SPP phenyl phase was designed to complement the high-pH SPP C18 phase. Table III highlights that both phases possess excellent selectivity differences at low and high pH (S values > 80) for the same organic modifier. The organic modifier selectivity with both phases at either low or high pH exhibited S > 23. The stationary phase selectivity values between the two phases at either low or high pH were observed to be > 11 for acetonitrile and methanol, respectively. The practical significance of these S values is borne out in Figure 10, which illustrates the separation of seven neutral components at low pH with acetonitrile on the high-pH SPP phenyl phase compared to the high-pH SPP C18 under alkaline conditions in methanol. Peaks 2–6 exhibited a completely different elution order on the two systems.
Figure 10: Gradient chromatography of a mixture of seven neutral analytes using a 3 to 100% B in 6-min gradient, 0.6 mL/min, 60 °C, λ = 214 nm. (a) ACE UltraCore SuperC18 phase (50 mm x 2.1 mm, 2.5-µm column) using mobile-phase A 18 mM ammonia in water, pH 10.7, and mobile-phase B 18 mM ammonia, pH 10.7, in 90:10 (v/v) methanol–water; (b) ACE UltraCore SuperPhenylHexyl phase (50 mm x 2.1 mm 2.5-µm column) mobile phase A 20 mM ammonium formate in water, pH 3, and mobile-phase B 20 mM ammonium formate, pH 3, in 90:10 (v/v) acetonitrile–water. Peaks: 1 = caffeine, 2 = 1,3,5-trinitrobenzene, 3 = 1,2-dinitrobenzene, 4 = dimethylphthalate, 5 = 1,2,3,4-tetrahydro-1-naphthol, 6 = corticosterone, 7 = piperine.
Conclusions
The column characterization procedures investigated have demonstrated measurable differences between reversed-phase LC columns specifically designed for method development purposes. It has been shown that these differences do result in complementary chromatographic selectivity that the method developer can practically exploit in development strategies to fully resolve separations. These differing reversed-phase materials, which possess additional retention mechanisms to that of hydrophobicity, when used in combination with differing organic modifiers at differing pH values, have been shown to be of great benefit in the practical resolution of moderately complex separations.
The development of robust column and solvent switching technologies with software generated methods and sequences that most of the major instrument manufacturers offer, in combination with complementary columns and mobile phases or pH, now permits the chromatographer to evaluate a wider and more comprehensive method development space in a relatively short timeframe. In addition, the ability to identify stationary- and mobile-phase combinations with complementary chromatographic selectivity will be of major importance in the rapidly developing field of two-dimensional reversed-phase LC.
Acknowledgments
The authors would like to thank Dr. A.P. McKeown of Advanced Chromatography Technologies Ltd for supplying the ACE range of columns.
References
- J.L.E. Reubsaet and K Jinno, Trends in Analytical Chemistry17, 157 (1998)
- HPLC Made to Measure. A Practical Handbook for Optimization, S. Kromidas, Ed. (Wiley-VCH, 2006).
- M.R. Euerby and P. Petersson, J. Chromatogr. A994, 13 (2003).
- T. Taylor, LCGC North Am.30, 442 (2012).
- L.R. Snyder, J.W. Dolan, and P.W. Carr, J. Chromatogr. A1060, 77 (2004).
- HPLC Column Classification, Pharmacopeial Forum 31, 637 (2005).
- https://www-s.nist.gov/srmors/certificates/870.pdf
- T. Iványi, Y. Vander Heydan, D. Vsiky, P. Baten, J. De Beer, I. Lázár, D.L. Massaet, E. Roets, and J. Hoogmartens, J. Chromatogr. A954, 99 (2002).
- E. Lesellier, J. Chromatogr. A1266, 34 (2012).
- K. Kimata, K. Iwaguchi, S, Onishi, K. Jinno, R. Eksteen, K. Hosoya, M. Arki, and N. Tanaka, J. Chromatogr. Sci. 27(2989), 721 (1989).
- M.R. Euerby, P. Petersson, W. Campbell, and W. Roe, J. Chromatogr. A1154, 138 (2007).
- M.R. Euerby, A.P. McKeown, and P. Petersson. J. Sep. Sci.26, 295 (2006).
- M.R. Euerby and P. Petersson, J. Chromatogr. A1088, 1 (2005).
- C. Markopoulou, T. Tweedlie, D. Watson, G. Skellern, H. Reda, P. Petersson, H. Bradstock, and M.R. Euerby, Chromatographia70, 705 (2009).
- L.A. Lopez and S.C. Rutan, J. Chromatogr. A965, 301 (2002).
- M. Reta, P.W. Carr, P.C. Sadek, and S.C. Rutan, Anal. Chem. 71, 3484 (1999).
- M.H.J. Abraham, J. Pharm. Sci. 83, 1085 (1994).
- U.D. Neue, J. E. O’Gara, and A. Mendez, J. Chromatogr. A1127, 161 (2006).
- L. Eriksson, E. Johansson, N. Kettaneh-Wold, and S. Wold, Multi- and Megavariate Data Analysis: Principles and Applications (Umetrics AB, Umeå, Sweden, 2001).
- K. Esbensen, S. Schönkopf, and T. Midtgaard, Multivariate Analysis in Practice (Camo AS, Trondheim, Norway, 1994).
- ACD Column selector http://www.acdlabs.com/resources/freeware/colsel/
- K. Valkó, M. Plass, C. Bevan, D. Reynolds, and M.H. Abraham, J. Chromatogr. A 797, 41 (1998).
- Á. Sándi and L. Szepesy, J. Chromatogr. A818, 1 (1998).
- ACE SuperC18 Brochure, Application No. 1510, http://www.ace-hplc.com/products/product.aspx?id=2814, accessed 24 July 2015.
Melvin Euerby is the head of R&D at Hichrom Ltd and professor at the University of Strathclyde and the Open University. Mark Fever is a research scientist at Hichrom Ltd. Colin Pipe is a research scientist at Hichrom Ltd. Jennifer Hulse is an application scientist at Hichrom Ltd. Matthew James is an application Scientist at Hichrom Ltd. Patrik Petersson is a principal scientist at Novo Nordisk A/S and Associate Professor at Uppsala University.

Common Challenges in Nitrosamine Analysis: An LCGC International Peer Exchange
April 15th 2025A recent roundtable discussion featuring Aloka Srinivasan of Raaha, Mayank Bhanti of the United States Pharmacopeia (USP), and Amber Burch of Purisys discussed the challenges surrounding nitrosamine analysis in pharmaceuticals.
Extracting Estrogenic Hormones Using Rotating Disk and Modified Clays
April 14th 2025University of Caldas and University of Chile researchers extracted estrogenic hormones from wastewater samples using rotating disk sorption extraction. After extraction, the concentrated analytes were measured using liquid chromatography coupled with photodiode array detection (HPLC-PDA).


