A Look at Matrix Effects
LCGC North America
In the environmental analytical chemistry literature, the topic of matrix interferences and matrix effects has not been addressed in a fundamental way. Here, we examine which methods appear to have a tendency for matrix interference and suggest ways to reduce the problem.
All quantitative environmental analytical chemistry methods probably have matrix effects to some extent. However, the natural tendency for a high-volume testing laboratory is to blame the sample matrix when matrix spike recoveries are outside of limits and move on to the next sample. Increasingly, approved regulatory methods require that results for samples with out-of-limits matrix spike recoveries not be used for regulatory compliance reporting. The environmental analytical chemistry literature on matrix interferences and matrix effects is small, and the topic doesn't appear to have been addressed in a fundamental way. This installment of "Focus on Environmental Analysis" examines the possible types of matrix interferences or matrix effects. It examines method performance using routine quality control indicators to gauge which methods appear to have a tendency for matrix interference problems and suggests ways to reduce matrix effects. It ends with a look at cyanide as the "baddest" bad actor regarding matrix effects.
Environmental analytical chemistry testing performed for regulatory purposes generally uses standardized quality control (QC) indicators to demonstrate that the testing was performed properly and usable results were obtained. This includes the following "batch QC" samples:
- Laboratory reagent blank (LRB) or method blank (MB) is a clean matrix, like deionized water, carried through the test procedure.
- Laboratory control sample (LCS) or laboratory fortified blank (LFB) is a known amount of target analyte in a clean matrix carried through the test procedure.
- Matrix spike (MS)–matrix spike duplicate (MSD) or laboratory fortified matrix–laboratory fortified matrix duplicate is a known amount of target analyte added to a sample in the batch, carried through the test procedure.
If you look closely enough, all quantitative analytical chemistry methods probably have matrix effects to some extent. However, the natural tendency for a high-volume environmental testing laboratory is to blame the sample when MS–MSD recoveries are outside of laboratory or method required control limits and move on to the next sample. ("It's a matrix effect!") Environmental Protection Agency (EPA)-approved methods vary in how out-of-limits MS–MSD recoveries are addressed, but often state that the associated sample results are "suspect" and "may not be reported for regulatory compliance purposes" (1). These methods often do not acknowledge that for multianalyte methods, QC indicators will occasionally exceed statistically derived control limits, just by random variation.
Blame the Sample
To stay in business at high-volume commercial and government environmental labs you need to have robust, consistent procedures to get the work done efficiently. Samples are processed in batches and need to have good batch QC to show that things are working and you can move on to the next batch. If the LCS worked and the MS didn't (and the MSD agrees with the MS), then it's the sample's fault. It's a matrix effect. Move on!
A high-volume laboratory doesn't have control over the clients' sample matrices. You can't shut down the operation to investigate one particular sample. And for organic analyses, such as pesticides, volatiles, and semivolatiles, there are so many target analytes, that something is always out of statistically set recovery control limits just because of random variation. However, the spike recovery is telling you something about that analyte in that sample analyzed by that particular analysis method. But who has time to investigate?
A Little History on Matrix Effects
An online search of the American Chemical Society (ACS) journals for the first use of the term "matrix effect" found a 1951 paper on the spectroscopic determination of vanadium in fuel oil (2), in which it was stated that "it was assumed that the use of silica and graphite eliminated any matrix effect that might otherwise have been caused by the chemical character of the fuel oil." The first use of the term "matrix interference" appears in a 1962 paper on neutron activation analysis (3): "The method is rapid, sensitive, and selective, and is free from most matrix interferences." The term "matrix effects" was also used in a 1980 instrumental analysis text for undergraduates (4).
According to the ACS search performed in 2016, the term "matrix effects" was used in 792 out of 78,769 articles (1.0%) and "matrix interferences" was used in 3189 out of 78,769 articles in the journals Analytical Chemistry and Environmental Science and Technology (4.0%). Or, in other words, 95% of the articles in these journals used neither term.
What Is a Matrix Effect?
Environmental analytical chemists blithely toss around the term "matrix effect," but are rarely asked to define it. We can start with an EPA definition (5):
Manifestations of non-target analytes or physical/chemical characteristics of a sample that prevents the quantification of the target analyte (i.e., the compound or element of interest being effectively quantified by the test method) as it is routinely performed, typically adversely impacting the reliability of the determination. For example, a matrix effect can give rise to a high or low bias.
There doesn't seem to be an EPA definition of matrix interference. There is an International Union of Pure and Applied Chemistry (IUPAC) definition (6) of the term matrix effect: "The combined effect of all components of the sample other than the analyte on the measurement of the quantity." And also interference, "If the specific component can be identified as causing an effect then this is referred to as an interference."
Interestingly, the 2016 NELAC Institute (TNI) standard (7) only mentions "the effect of the matrix" in its definition of matrix spike:
A sample prepared, taken through all sample preparation and analytical steps of the procedure unless otherwise noted in a referenced method, by adding a known amount of target analyte to a specified amount of sample for which an independent test result of target analyte concentration is available. Matrix spikes are used, for example, to determine the effect of the matrix on a method's recovery efficiency.
The key aspect of a matrix effect or matrix interference is usually bias, and can be summarized as follows:
- matrix interference if you know what is causing the bias.
- matrix effect if you don't know what is causing the bias.
Or it could be that there is something fundamentally wrong with the method itself and it is affecting the target analyte.
What Do EPA Methods Say About Poor Matrix Spike Recoveries and Matrix Effects?
I always believed that the 600-series Clean Water Act, the National Pollutant Discharge Elimination System (NPDES) wastewater methods (for example, 608, 624, and 625), were relatively forgiving with regard to poor matrix spike recoveries, but that belief is actually erroneous. For example, wastewater semivolatile Method 625 (8) says this in section 8.4.3:
If the recovery of any such parameter falls outside the designated range, the laboratory performance for that parameter is judged to be out of control, and the problem must be immediately identified and corrected. The analytical result for that parameter in the unspiked sample is suspect and may not be reported for regulatory compliance purposes.
Not being able to use the results for regulatory reporting is especially problematic for a treatment plant laboratory that must meet monthly reporting deadlines. After the month is over you can't go back and resample, so the testing laboratory needs to do the best job possible with each regulatory sample. The EPA has provided guidance on how to document and resolve matrix effects for wastewater samples (9).
For solid waste and hazardous waste, the corresponding language in EPA SW-846 methods compendium is more forgiving (10): "If the results are to be used for regulatory compliance monitoring, then the analyst must take steps to demonstrate that the analytes of concern can be determined in the sample matrix at the levels of interest." Even the language in the corresponding drinking water method, 525.2, is tolerant: "If the recovery data for a LFM [MS] does not meet the criteria . . . and LFBs [LCSs] show the laboratory to be in control, then the samples from that matrix (sample location) are documented as suspect due to matrix effects" (1). Suspect means flag or qualify the data and move on.
How Prevalent Are Matrix Effects?
Matuszewski and colleagues (11) presented an interesting way of examining matrix effects, noting that a matrix effect can be quantified by examining target analyte recovery with and without sample matrix. For environmental testing, these recoveries are the LCS and MS–MSD. The magnitude of the matrix effect (ME) is calculated as follows:
ME (%) = MS Recovery/LCS Recovery x 100
If the MS and LCS give the same recovery, then ME = 100%, meaning no matrix effect is evident. If ME > 100% there is signal enhancement and if ME < 100% there is signal suppression. Using about six years of QC results in our laboratory information management system (LIMS), we can use the variability of MS–MSD and LCS recovery data in bulk to go looking for significant matrix effects using a simple F -test for:
F calc = s 2MS/MSD/s 2LCS compared to F critical
where s is standard deviation. If the calculated F calc is larger than the F critical, there is a significant matrix effect.
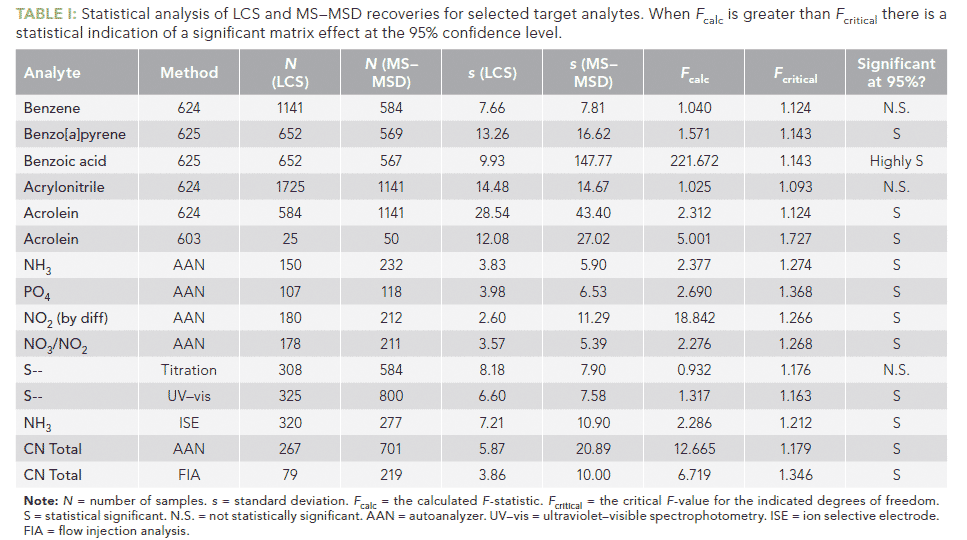
Table I shows some representative results of this calculation using approximately six years of data from our LIMS. An example for benzo[a ]pyrene by EPA Method 625 for semivolatiles is shown in Figure 1, demonstrating a small, but statistically significant, matrix effect. Note that nearly all the analytes presented in Table I showed a statistically significant matrix effect.
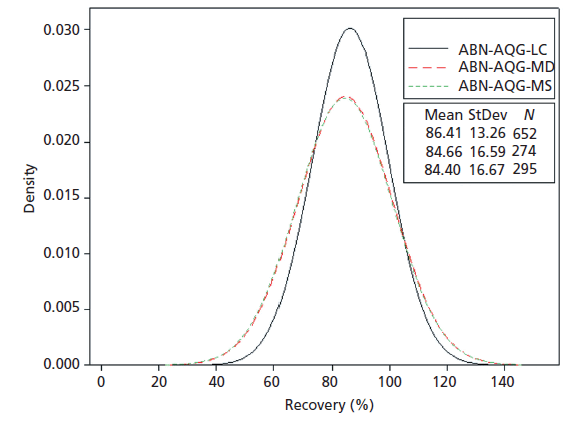
Figure 1: Distribution of LCS and MS-MSD recoveries for benzo[a]pyrene by EPA Method 625.
Types of Matrix Effects
There isn't a generally embraced systematic way of characterizing or organizing the various types of matrix effects. Perhaps it's helpful to think about the impact of the matrix effect on the calibration curve relationship between target analytes and the observed signal. Additive effects move the calibration curve up or down and multiplicative effects change the slope of the calibration curve.
It might be helpful to characterize matrix effects as simple or subtle. Simple matrix effects include matrix interferences that can be addressed by improving the method. For example, in a chromatographic analysis, if a nontarget interfering compound is coeluted with the target analyte, the matrix interference can be decreased by
- Better cleanup. Remove the interference.
- Better chromatography. Separate the interference from the target analyte.
- Better detector-more selective. Detect the target analyte but not the interference.
Subtle matrix effects are, by definition, harder to characterize. Perhaps it's helpful to think about ways to address subtle matrix effects using the "matrix spectrum," shown in Figure 2, which runs from 0% matrix to 100% matrix. Real samples, as well as MS–MSD, contain 100% matrix while calibration standards, method blanks, and LCS are typically formulated with deionized water, therefore consisting of 0% matrix. Techniques for decreasing matrix effects can be envisioned as moving along the matrix spectrum. For example, in metals analysis, matrix matching is when the calibration standards are prepared in a matrix more similar to the prepared samples (such as digestates). This approach changes the matrix of the standards from 0% matrix toward 100% matrix. In organics analysis, internal standards may be added to the prepared standards and samples (for example, extracts) to compensate for various effects of the sample matrix on the analysis, corresponding to 100% matrix. The standard additions approach (12) is perhaps the ultimate in compensating for matrix effects because known amounts of the target analyte are added directly to the samples, thus forming the calibration curve under conditions of 100% matrix. However, this technique is not commonly used in environmental analysis because each sample must be spiked and analyzed one or more times-decreasing throughput.
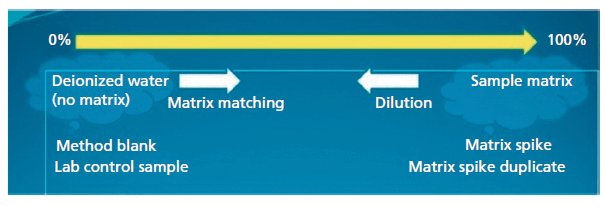
Figure 2: The matrix spectrum.
Perhaps the most common way of addressing a matrix effect is by what might be called matrix minimization , but is more commonly known as dilution . Minimizing the sample matrix by dilution is used in a variety of ways, such as diluting extracts or digestates, or taking smaller volumes of the native sample for sample preparation. Dilution amounts to moving along the matrix spectrum (Figure 2) from 100% matrix toward 0% matrix.
Dilution is especially useful when the analytical technique has sensitivity to spare. A good example of this is high performance liquid chromatography–tandem mass spectrometry (HPLC–MS/MS). This is a highly sensitive and selective technique that is also prone to matrix effects (13,14), but dilution has been shown to be effective in reducing electrospray ion suppression and other matrix effects (15–18).
An interesting approach to systematically using dilution to improve quantitation, called standard dilution analysis (19), combines the method of standard additions and internal standards to simultaneously correct for matrix effects and other variations and instrumental parameters. However, this approach probably won't have a major impact on high-volume laboratory operations.
It would be remiss not to mention the work on matrix effects by Kalivas and Kowalski (20), but here we are about 35 years later and the chemometric approach really hasn't had an impact except in cases where the math might be imbedded in commercial instrument software.
Cyanide Is the "Baddest" Bad Actor
Of all the tests routinely performed in environmental laboratories, it can be argued that cyanide is the worst in terms of method performance. There is a fair bit of literature on the "bad behavior" of cyanide in wastewater and drinking water testing (21–25). Cyanide is notable because it can be formed or destroyed, and this can happen during sampling, preservation, storage, and testing. Not only that, the methods are prone to interferences such as aldehydes, color, dissolved solids, fatty acids, mercury, metal anions, metal cations, nitrate, nitrite, oxidants, photodecomposition, sugars, sulfides, turbidity, sulfur compounds, thiocyanate, and "unknowns that cause negative results" (26).
Because of all the potential matrix interferences and matrix effects, the performance of cyanide testing matrix QC indicators tends to be very variable. Figure 3 shows the distribution of total cyanide recoveries for LCS and MS–MSD over four years using EPA Method 335.4 (27), an automated colorimetric method (autoanalyzer). These are primarily wastewater samples from industrial dischargers into the sewer system. Also shown on this graph are field spike (FS) recoveries, obtained using a known amount of a complex cyanide added to a portion of wastewater samples at the time of sample collection. We have demonstrated the utility of field spikes for this analysis (22). Note the wide distribution of MS recoveries and the very wide distribution of FS recoveries.
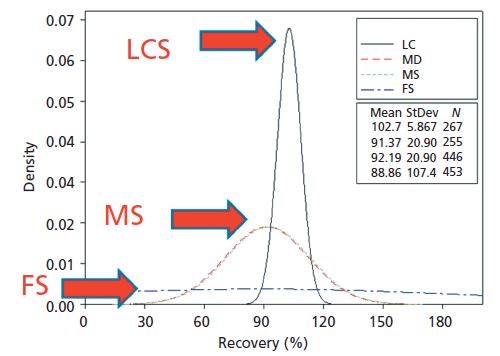
Figure 3: Distribution of LCS, MS-MSD, and field spike (FS) recoveries for total cyanide by autoanalyzer (AAN).
Field Dilution Is a Solution
The FS recoveries for total cyanide have allowed us to identify industrial sample matrices that have a strong matrix effect on the total cyanide analysis. This knowledge allows us to go back to the site and use alternative dechlorination agents, interference treatments, and even field dilution, to obtain reasonable FS recoveries, demonstrating that we have maintained sample integrity for cyanide and have met the requirements of the cyanide footnote in 40 Code of Federal Regulations (CFR ) 136 Table II, footnote 6, which states (27)
Any technique for removal or suppression of interference may be employed, provided the laboratory demonstrates that it more accurately measures cyanide through quality control measures described in the analytical test method.
Especially for industrial wastewater samples, we have found the combination of field dilutions, field spikes, and careful field preservation to be vital in demonstrating accurate total cyanide analyses. However, keep in mind that when you dilute the sample you raise the reporting limit by a comparable factor, which could be above the regulatory limit.
Use a Better Method
Finally, there's no better substitute to minimizing matrix effects than using a better method, although regulatory environmental analyses are often limited to using an EPA-approved method. For both total and free cyanide analyses we have found the flow injection analysis (FIA) methods that use online ultraviolet (UV) digestion (for total cyanide) membrane diffusion, and amperometric detection to perform better than distillation–spectrophotometric methods. This includes Methods OIA-1677-DW (28) for free cyanide in drinking water and ASTM D7511-09 (29) for total cyanide in wastewater. For wastewater, we have found that the distribution of FS recoveries using FIA the method is significantly tighter than for the distillation–autosampler method. The FIA methods have the added benefit that they are highly automated, which allows more analyst time to investigate problematic samples.
Unfortunately, method modifications are generally not allowed by the EPA for drinking water analyses. National modifications can be obtained through the EPA's national Alternative Test Procedure (ATP) program (30). For wastewater testing under the Clean Water Act (CWA), certain method flexibility is afforded in 40 CFR 136.6 (27). For hazardous and solid waste testing, methods in the EPA's compendium SW-846 are often regarded as advisory and can be modified for a particular project. Check with your local environmental permitting authority for regulatory requirements in their jurisdiction.
Conclusion
Matrix effects are everywhere in environmental testing and, unfortunately, the regulatory requirements often make it difficult for analytical chemists to improve method performance. Also, high-volume laboratories don't have the luxury to treat each sample as a special project. But if environmental laboratories keep running routine samples efficiently, perhaps that would allow some time for dealing with problematic samples or method improvements.
References
(1) EPA Method 525.2, Determination of Organic Compounds in Drinking Water by Liquid-Solid Extraction and Capillary Column Gas Chromatography/Mass Spectrometry , Revision 2.0. (U.S. Environmental Protection Agency, Washington, D.C., 1995).
(2) J.W. Anderson and H.K. Hughes, Anal. Chem. 23(10), 1358–1361 (1951).
(3) E.L. Steele and W.W. Meinke, Anal. Chem. 34(2), 185–187 (1962).
(4) D.A. Skoog, Principles of Instrumental Analysis , Third Edition (Saunders College Publishing, Philadelphia, Pennsylvania, 1980), p. 479.
(5) EPA Forum on Environmental Measurement (FEM) Glossary. Downloaded 6/9/17 at https://www.epa.gov/measurements/forum-environmental-measurements-fem (U.S. Environmental Protection Agency, Washington, D.C., 2017).
(6) G.G. Guilbault and M. Hjelm, Pure & Appl. Chem. 61(9), 1657–1664 (1989).
(7) The NELAC Institute, TNI Standard. Management and Technical Requirements for Laboratories Performing Environmental Analysis , Volume 1. EL-V1-ISO-2016-Rev2.0 (The NELAC Institute, Weatherford, Texas).
(8) EPA Method 625, Base/Neutrals and Acids . 40 Code of Federal Regulations Part 136. Appendix A (U.S. Environmental Protection Agency, Washington, D.C.).
(9) EPA 821-R-07-002, Solutions to Analytical Chemistry Problems with Clean Water Act Methods (U.S. Environmental Protection Agency, Washington, D.C., 2017).
(10) EPA Method 8000D, Test Methods for Evaluating Solid Waste: Physical/Chemical Methods (SW-846) . Determinative Chromatographic Separations (U.S. Environmental Protection Agency, Washington, D.C.).
(11) B.K. Matuszewski, M.L. Constanzer, and C.M. Chavez-Eng, Anal. Chem. 75, 3019–3030 (2003).
(12) J. Meija, E. Pagliano, and Z. Mester, Anal. Chem. 86, 8563-8567 (2014).
(13) P.J. Taylor, Clin. Biochem. 38, 328–334 (2005).
(14) S. Tulipani, R. Llorach, M. Urpi-Sarda, and C. Andres-Lacueva, Anal. Chem. 85, 341-348 (2013).
(15) H. Stahnke, S. Kittlaus, G. Kempe, and L. Alder, Anal. Chem. 84, 1474 (2012).
(16) C. Ferrer, A. Lozano, A. Agüera, A.J. Girón, and A.R. Fernández-Alba, J. Chromatogr. A 1218(42), 7634–9 (2011).
(17) A.J. Krynitsky, R.A. Niemann, and D.A. Nortrup, Anal. Chem. 76, 5518–5522 (2004).
(18) S.C. Nanita, Anal. Chem . 85, 11866-11875 (2013).
(19) W.B. Jones, G.L. Donati, C.P. Calloway, Jr., and B.T. Jones, Anal. Chem. 87, 2321-2327 (2015).
(20) J.H. Kalivas and B.R. Kowalski, Anal. Chem. 55(3), 532–535 (1983).
(21) M.F. Delaney, C. Blodget, C.E. Hoey, N.E. McSweeney, P.E. Epelman, and S.F. Rhode, Environ. Sci. Technol. 41(24), 8383 (2007).
(22) M.F. Delaney and C. Blodget, Water Environ. Res . 87(6), 559 (2015).
(23) M.F. Delaney and C. Blodget, "A Look at Matrix Effects," presented at the National Environmental Monitoring Conference, Orange County, California, 2016. http://nemc.us/meeting/2016/techprog.php.
(24) M.F. Delaney and C. Blodget, Journal of the American Water Works Association , E87–E98, (2016), http://dx.doi.org/10.5942/jawwa.2016.108.0006.
(25) M.F. Delaney and C. Blodget, Journal of the American Water Works Association , 109(12), 27 (2017) https://doi.org/10.5942/jawwa.2017.109.0120.
(26) American Society for Testing Materials D7365-09a, Standard Practice for Sampling, Preservation, and Mitigating Interferences in Water Samples for Analysis of Cyanide (ASTM International, West Conshohocken, Pennsylvania, 2009).
(27) EPA Guidelines Establishing Test Procedures for the Analysis of Pollutants Under the Clean Water Act; Analysis and Sampling Procedures; Final rule, ("Methods Update Rule") ( Federal Register 77[97], U.S. Environmental Protection Agency, Washington, D.C., 2012), pp. 29758–29845.
(28) OI Analytical, "Method OIA-1677-DW: Available Cyanide by Ligand Exchange and Flow Injection Analysis (FIA)" (OI Analytical, College Station, Texas, 2004).
(29) American Society for Testing Materials D7511-09, Standard Test Method for Total Cyanide by Segmented Flow Injection Analysis, In-Line Ultraviolet Digestion and Amperometric Detection (ASTM International, West Conshohocken, Pennsylvania, 2009).
(30) EPA Protocol for Review and Validation of Alternate Test Procedures for Regulated Organic and Inorganic Analytes in Wastewater Under EPA's Alternate Test Procedure Program (EPA 821-B-16-002, U.S. Environmental Protection Agency, Washington, D.C., 2016).
ABOUT THE AUTHOR
Michael F. Delaney, PhD

Michael F. Delaney, PhD, is the Director of Laboratory Services at the Massachusetts Water Resources Authority in Winthrop, Massachusetts. Direct correspondence about this column to LCGCedit@ubm.com

University of Rouen-Normandy Scientists Explore Eco-Friendly Sampling Approach for GC-HRMS
April 17th 2025Root exudates—substances secreted by living plant roots—are challenging to sample, as they are typically extracted using artificial devices and can vary widely in both quantity and composition across plant species.
Sorbonne Researchers Develop Miniaturized GC Detector for VOC Analysis
April 16th 2025A team of scientists from the Paris university developed and optimized MAVERIC, a miniaturized and autonomous gas chromatography (GC) system coupled to a nano-gravimetric detector (NGD) based on a NEMS (nano-electromechanical-system) resonator.
Characterizing Plant Polysaccharides Using Size-Exclusion Chromatography
April 4th 2025With green chemistry becoming more standardized, Leena Pitkänen of Aalto University analyzed how useful size-exclusion chromatography (SEC) and asymmetric flow field-flow fractionation (AF4) could be in characterizing plant polysaccharides.


