Liquid Chromatography at Room Temperature: When Should the Column Temperature Be Specified in a Method?
LCGC North America
There are still many methods in use that have been developed for use at “room temperature.” With such a method, can one reasonably expect to obtain the same separation in Anchorage, Alaska, as in Mumbai, India?
In reversed-phase liquid chromatography, increasing the column temperature usually results in a decrease in analyte retention. Will this cause problems if a method does not call for control of the column temperature, but the room temperature of the laboratory environment changes?
In the early days of liquid chromatography (LC), precise control of the column temperature was not a primary consideration in many instrument setups. Unlike gas chromatography (GC), where the column temperature is the single most important experimental variable that dictates retention, in LC the column temperature has a smaller influence on retention compared to the mobile-phase composition (that is, the organic:aqueous ratio for reversed-phase and hydrophilic-interaction chromatography [HILIC]separations, or cation:anion concentration for charge-based separations). As the community’s knowledge about the effects of temperature on LC separations has increased, the need for accurate and precise control of column temperature has increasingly been recognized. For example, we now know much more about the effects of column temperature on the retention of different analyte types (1), the importance of matching the temperature of mobile phase at the column inlet to the temperature of the column itself (2), and the effects of heat flow in columns on apparent column efficiency (3). As a result, users generally pay attention to control of temperature in their LC instruments (and the designs of instrument modules for doing so), and specify a particular temperature or temperature range when developing and validating a method. However, there are still many methods in use that have been developed for use at “room temperature,” where there is no provision for the LC instrument to control the column temperature, and in some cases no precise specification of what is meant by “room temperature” in the method. This leads to the obvious question: With such a method, can one reasonably expect to obtain the same separation in Anchorage, Alaska, as in Mumbai, India? In this installment of “LC Troubleshooting,” I discuss some of the basics of the effect of temperature on retention in LC, and then discuss some experimental data that help us understand when some variation in room temperature might be okay, and when it might seriously affect the performance of a separation.
Basics of the Effect of Column Temperature on Retention in Reversed-Phase LC
In reversed-phase LC, the influence of temperature on retention is most commonly described using a Van ’t Hoff type of relationship, like that shown in equation 1:

where k is analyte retention factor, and T is temperature (in K). The variable A is a condition-specific parameter related to the entropy of transfer of the analyte from the mobile phase to the stationary phase and the phase ratio (the relationship of stationary phase volume to mobile phase volume), and B is related to the enthalpy of transfer of the analyte from the mobile phase to the stationary phase. Figure 1 shows experimental retention data for several neutral small molecules obtained with a C18 column, an acetonitrile:water mobile phase, at different temperatures. The data follow a roughly linear trend, as predicted by equation 1. Recent work by the Weber group has examined a large body of experimental measurements of this type, and concluded that a non-linear version of equation 1 frequently produces a better fit of the data than a linear one (1). Other researchers have argued that the apparent linearity of the data is more of a happy accident than a thermodynamic inevitability (4).
Figure 1: Effect of changing column temperature (T) on retention factor (k) for several neutral small molecules obtained using a C18 column and mobile phase of 50/50 (v/v) acetonitrile/water: (a) shows toluene, ethylbenzene, and propylbenzene, while (b) shows p-nitrobenzyl chloride and anisole. Dashed lines are linear regression lines. Data are from the PhD dissertation of Yun Mao (6).
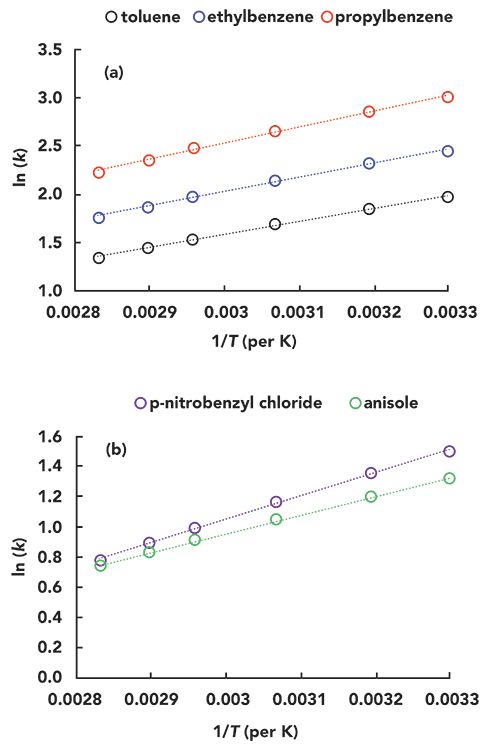
Figure 1: Effect of changing column temperature (T) on retention factor (k) for several neutral small molecules obtained using a C18 column and mobile phase of 50/50 (v/v) acetonitrile/water: (a) shows toluene, ethylbenzene, and propylbenzene, while (b) shows p-nitrobenzyl chloride and anisole. Dashed lines are linear regression lines. Data are from the PhD dissertation of Yun Mao (6).
The slope of each line in Figure 1 is related to the enthalpy of transfer of the analyte from the mobile to the stationary phase. For molecules that are chemically similar, the slopes are numerically similar, as shown by the data for toluene, ethylbenzene, and propylbenzene in Figure 1a. In a separation of a mixture of molecules like these, increasing the column temperature will decrease retention, but the relative spacing of the peaks (that is, the selectivity) will not change much, because all of the peaks move in the same direction at about the same rate. However, for molecules with different functional groups, the slopes can be quite different, as shown in Figure 1b for the analytes p-nitrobenzyl chloride and anisole. In a case like this, increasing column temperature will decrease retention for both analytes, but at different rates, such that selectivity and resolution will change. In extreme cases this can even lead to a reversal of elution order (5). Readers interested in exploring these phenomena on their own can do so easily using our web-based simulator that allows the user to change mobile- phase composition and column temperature, and observe the impact on retention and resolution (www.multidlc.org/hplcsim).
Let’s Look at Some Experimental Data
In preparation for writing this installment of “LC Troubleshooting,” I created a microenvironment for one of the LC instruments in my laboratory. I first disconnected the column from the flow path going through the column thermostat compartment we normally use to control the column temperature, such that the mobile phase flow went directly from the autosampler to the column, and then directly on to the detector. Then, I heated or cooled the microenvironment to simulate the impact of changing room temperature on my separation, and measured the ambient air temperature near the column inlet using a small thermocouple. Finally, I recorded the chromatograms for separations of a simple mixture of small molecules (one acid, one base, and two neutrals) at different “room temperatures” after equilibrating the system for about 30 min for each temperature. Three of these chromatograms-recorded with “room temperatures” of 24, 28, and 42 °C-are shown in Figure 2. The vertical dashed line is added as a visual aid, to help quantify the shift in retention that occurs as the temperature is increased. Although there is a shift that is discernible by eye, it is instructive to plot the resulting data as a function of temperature to more precisely understand the effect, particularly for changes in selectivity. Figure 3 shows the effect of temperature on the retention factors of all four probe compounds. In Figure 3a, I have plotted the absolute values of the retention factors, and, in Figure 3b, I have plotted the percent change in retention relative to average retention for each compound over the range of temperatures measured. As expected, the retention of all compounds decreases as temperature increases, and here we have our first important point from this experiment. That changes in “room temperature” can definitely be enough to cause a change in retention on the order of 2% for small molecules, even over a modest range of laboratory room temperatures that might be experienced in the United States. The data point at 42 °C is admittedly a bit extreme, but there are LC laboratories across the globe that do experience this type of extreme condition.
Figure 2: Experimental chromatograms obtained for a test mixture at different room temperatures.
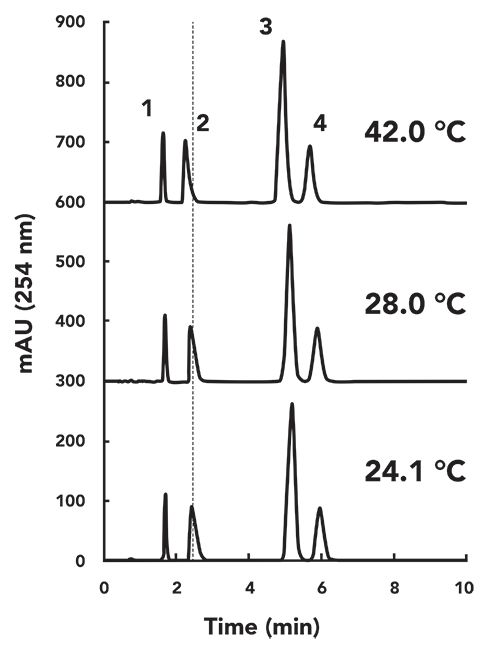
Figure 2: Experimental chromatograms obtained for a test mixture at different room temperatures. The dashed vertical line is added to aid visual comparison of retention times. Conditions: Column, 50 mm x 4.6-mm i.d., Zorbax SB-C18 (5-µm); Flow rate, 1.0 mL/min.; mobile phase, 40:60 (v/v) acetonitrile:ammonium formate in water (25 mM ammonium/ammonia, 105 mM formic acid:formate, pH 3.2); injection volume, 2 µL.
Test compounds are 1) acetophenone, 2) nortriptyline, 3) butyrophenone, 4) n-butylbenzoic acid.
In Figure 3b, we see that the slopes of the trends (% change in k vs. T) are pretty similar, with the exception of nortriptyline, which exhibits a much steeper slope. As discussed earlier, if the retention of all compounds changed at the same rate in response to a change in temperature, this would not be too much of a problem for method implementation, because resolution would not be affected too much. However, it appears from Figure 3b that the rate of retention for nortriptyline is on the order of two-fold higher than that of the other compounds. By plotting the selectivity of the separation against temperature we can obtain a more precise view of these changes in relative retention. Figure 4a shows α values for several pairs of the probe compounds, and Figure 4b shows the percent changes in these values vs. temperature. Here we see that there is no obvious change in the selectivity of the separation toward the neutral compounds (acetophenone and butyrophenone) as the temperature is increased from 24 to 42 °C. Even the selectivity of the separation for butyrophenone and n-butylbenzoic acid does not change, despite the fact that these are chemically quite different molecules. Even though the acid is ionogenic, at pH 3.2 it is mostly protonated and neutral. On the other hand, we see that the selectivity of the separation toward nortriptyline changes substantially over the range of temperature studied here. The alpha values for nortiptyline and butyrophenone (red circles) or butylbenzoic acid (blue circles) change by almost 5%.
Figure 3:
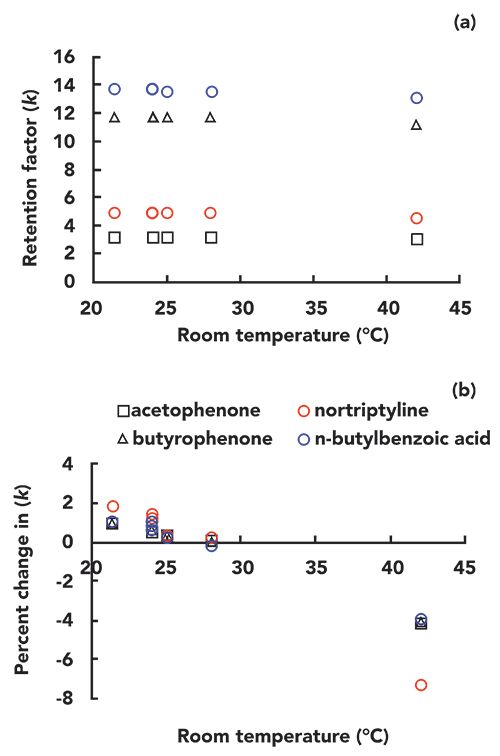
Figure 3: (a) Retention factor and (b) percent change in retention factor for the test compounds over the range of room temperatures tested (21–42 °C).
Figure 4:
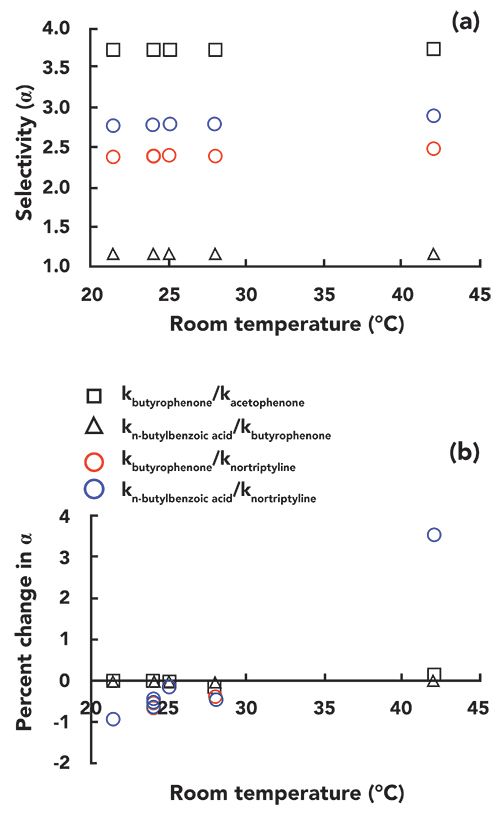
Figure 4: (a) Selectivity and (b) percent change in selectivity for the test compounds over the range of room temperatures tested (21–42 °C).
Implications for Method Development and Implementation
So far, we have observed that a change in room temperature can have a significant effect on the selectivity of a reversed-phase separation for some, but not all, types of molecules. The practically important question, then, is: Under what circumstances do changes of this kind really matter? The molecules I chose for this study are well separated (Figure 2), and even a 5% change in selectivity is not enough to bring them close enough together that they are no longer separated. Obviously, this will not always be the case. For separations where two neighboring peaks are just barely resolved at one room temperature, changing to a different room temperature could have a big effect on the resolution of that pair. We can quantify this effect using the Purnell equation for resolution, shown in equation 2.

If we consider a situation with a plate number (N) of 15,000, a retention factor (k) of 5 for the later eluted of two peaks, and an α of 1.1, the resolution (RS) of the two peaks will be about 2.3. We can use equation 2 to calculate the effect of a change in α on the resolution. Figure 5 shows how the resolution decreases as α decreases by up to 5% (that is, from 1.1 down to 1.045). Whereas a resolution of 2.3 corresponds to a nice separation where the valley between the peaks goes to baseline, at a resolution of 1.1 there is significant peak overlap. This overlap can significantly compromise quantitative accuracy of the method, particularly when one of the members of the peak pair is present at a concentration much higher than the other.
Figure 5:
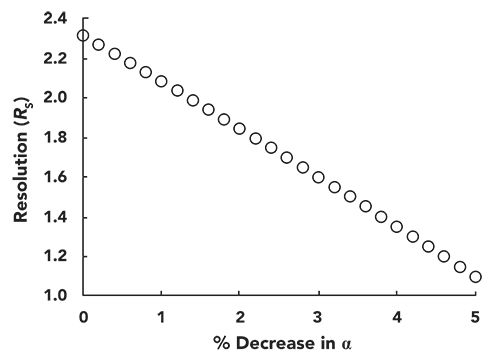
Figure 5: Effect of a decrease in selectivity (α) on the resolution for a pair of closely eluted peaks. Resolution is calculated using the Purnell equation (equation 2) with N = 15,000, k = 5, and starting α = 1.1.
Summary
In this installment of “LC Troubleshooting,” we have examined the impact of a change in room temperature on the performance of reversed-phase LC separations when the column temperature is not controlled, such that the column takes on the temperature of the ambient room air. In most cases, an increase in temperature leads to a decrease in retention for reversed-phase separations. This will not affect resolution of neighboring peaks too much as long as the degree of shift in retention is similar for both peaks. However, this is not always the case, and significant changes in the selectivity of the separation on the order of several percent can occur. These changes in selectivity can in turn lead to a significant decrease (or increase) in the resolution of closely eluting peaks, on the order of 50%! Taken together, this means that:
Specifying what constitutes “room temperature” during the method development will help prevent problems during method implementation, particularly if the method will be deployed in different laboratory environments where actual room temperatures may be very different.
During method development, the robustness of the method should be characterized to help understand what the sensitivity of the method performance is to changes in column temperature.
Controlling the column temperature with some means of thermostatting can help avoid these problems altogether, albeit at the cost of adding an instrument module for this purpose.
Acknowledgment
I would like to thank Dr. Ravi Ravichandran for bringing his thought provoking questions about room temperature LC to me, and many subsequent helpful conversations on this topic.
References
- A.R. Horner, R.E. Wilson, S.R. Groskreutz, B.E. Murray, and S.G. Weber, J. Chromatogr A 1589, 73–82 (2019). https://doi.org/10.1016/j.chroma.2018.12.055.
- J.D. Thompson, J.S. Brown, and P.W. Carr, Anal. Chem.73, 3340–3347 (2001). https://doi.org/10.1021/ac010091y.
- F. Gritti, LCGC North Am.36(6s), 18–23 (2018).
- F. Gritti and G. Guiochon, Anal. Chem.78, 4642–4653 (2006). https://doi.org/10.1021/ac0602017.
- Y. Mao and P.W. Carr, Anal. Chem. 72, 110–118 (2000). https://doi.org/10.1021/ac990638x.
- Y. Mao, Selectivity Optimization in Liquid Chromatography Using the Thermally Tuned Tandem Column (T3C) Concept, Ph.D. Dissertation, University of Minnesota, 2001.

Dwight R. Stoll is the editor of “LC Troubleshooting.” Stoll is a professor and co-chair of chemistry at Gustavus Adolphus College in St. Peter, Minnesota. His primary research focus is on the development of 2D-LC for both targeted and untargeted analyses. He has authored or coauthored more than 60 peer-reviewed publications and four book chapters in separation science and more than 100 conference presentations. He is also a member of LCGC’s editorial advisory board. Direct correspondence to: LCGCedit@mmhgroup.com

Polysorbate Quantification and Degradation Analysis via LC and Charged Aerosol Detection
April 9th 2025Scientists from ThermoFisher Scientific published a review article in the Journal of Chromatography A that provided an overview of HPLC analysis using charged aerosol detection can help with polysorbate quantification.
Removing Double-Stranded RNA Impurities Using Chromatography
April 8th 2025Researchers from Agency for Science, Technology and Research in Singapore recently published a review article exploring how chromatography can be used to remove double-stranded RNA impurities during mRNA therapeutics production.


