Liquid Chromatographic Peak Purity Assessments in Forced Degradation Studies: An Industry Perspective
This review article discusses scientific rationales and current best practices in the pharmaceutical industry for performing chromatographic peak purity assessments (PPA). These activities are associated with the development and validation of liquid chromatographic (LC) stability-indicating analytical methods applicable to regulatory submissions of small-molecule drug candidates. The discussion includes a comprehensive overview of the PPA-related regulatory and scientific landscape and common industry approaches to obtain PPA results, as well as the strengths and weaknesses of PDA-facilitated ultraviolet (UV) PPA and other PPA techniques.
The execution of chromatographic peak purity assessments (PPAs) is associated with the development of stability-indicating analytical methods (SIM) applicable to regulatory submissions (marketing applications) by pharmaceutical companies. When developing these methods, a forced degradation study (FDS) assessment is required to demonstrate that the method can adequately assess the stability of drug substances (DS) and drug products (DP) (1–4). The quality of the FDS data is dependent upon a well-designed FDS with scientifically justified conditions as well as appropriate evaluation of pertinent qualitative and quantitative FDS data, including correlations with mass balance data. If the quality of the data acquired during the FDS is sufficiently high, then the study informs our understanding of the stability-indicating capabilities of the analytical method.
When FDS data are compiled and analytical measures such as system suitability test and mass balance results indicate acceptable quality, the method is still at risk of having inadequate stability-indicating capability if pharmaceutically relevant degradant peaks coelute with the parent peak in stressed sample chromatograms. Such risks can be mitigated by evaluating the purity of the peak representing the main (parent) analyte; such an evaluation can be performed using various techniques where photodiode array (PDA)-facilitated PPA is most commonly employed (5). Although health authorities (HAs) in some countries require that the “chromatographic purity of the analyte signal” (that is, spectral homogeneity) shall be demonstrated for chromatographic methods (6,7), the requirement, as written, does not present specific expectations and guidance on the appropriate means to demonstrate peak purity.
Nevertheless, a PDA-facilitated PPA has become the de facto interpretation of how to assess peak purity by HA reviewers, evidenced by consistent requests for software-calculated peak purity data in queries received from various HAs regarding regulatory submissions containing chromatographic methods with ultraviolet (UV) detection. Notably, the draft ICH Q2(R2) guideline only states “spectra of different components could be compared to assess the possibility of interference” as an alternative to “suitable discrimination” in the Specificity/Selectivity section (4.1) without any specific mention of PDA-facilitated PPA. Although peak purity tests are not mentioned in the revised ICH Q2(R2) draft (8,9), ICH Q2(R1) states that “peak purity tests may be useful to show that the analyte chromatographic peak is not attributable to more than one component (diode array, mass spectrometry).” This statement, however, does not mandate PDA-facilitated PPA or any other specific technique for demonstrating method selectivity, and it is not regarded as a universal requirement by HAs and companies (although it is often a good practice).
PDA-facilitated (or, interchangeably, UV spectral) PPA is just one technique for demonstrating selectivity in a stability-indicating method. Several other valid techniques, including performing mass spectral PPA, spiking impurity markers, employing orthogonal chromatographic conditions, or using two-dimensional liquid chromatography (2D-LC), can effectively evaluate peak purity without relying solely on PDA-facilitated PPA. With a focus on small molecule active pharmaceutical ingredients (APIs), it is important to note that there is no universally appropriate technique for assessing selectivity. The most suitable technique should be selected on a case-by-case basis, supported by scientifically sound reasoning. Factors such as the chromatographic separation technique, detector type, and specific characteristics of the molecules of interest must be considered. Note that, because of the limitations mentioned above, PPA never proves unequivocally that a peak is pure. Rather, PPA can only be used to conclude that no coeluted compounds were detected. Combining a PPA along with other characteristics of forced degradation (including relevance of the specific degradation pathway) and validation greatly increases the confidence in the stability-indicating nature of the analytical method.
The absence of specific regulatory guidance on PPA poses challenges for both HA reviewers and applicants in terms of understanding the process of demonstrating method selectivity, setting appropriate acceptance criteria, and including sufficiently documented evidence of having met those criteria. To advocate for a shared understanding between industry and HA, the goal of this paper is to provide science-based clarification to guide LC-based PPA activities in the pharmaceutical industry, especially as it relates to small molecule APIs.
This article primarily centers around PDA-facilitated UV PPAs as the main tool for assessment, but it also explores additional supplementary techniques such as mass spectrometry (MS) and 2D-LC. Molecules with no chromophore (memantine) or where impurities commonly have essentially the same UV spectral characteristics (oligonucleotides), however, cannot be effectively evaluated using UV spectral PPAs, and hence, are not the focus of this article.
Peak Purity Assessment Options
The following are some examples of PPA assessment approaches.
PDA-Facilitated PPA
PDA-facilitated PPA is the most common approach to demonstrating adequate selectivity and is usually calculated using commercial chromatographic data systems (CDSs) or software, which examine changes in the UV absorbance spectrum throughout the peak to detect coeluted compounds with different UV absorbance spectra. A list of some commercially available PPA CDSs is presented in Table I. Commercial CDSs differ slightly in their spectral peak purity algorithms and terminology (10), but the core concepts to perform PPA are consistent—determining spectral contrast by comparing UV absorbance spectra at different points across the peak of interest to that of the apex. To describe the basic principles, the PPA method and terminology from Waters’ Empower software (11) will be used as an example of a widely accepted CDS among pharmaceutical companies. As depicted in Figure 1, Empower measures spectral contrast (that is, the shape difference between two spectra) as follows:
- Spectra are baseline corrected by subtracting interpolated baseline spectra between peak baseline liftoff and baseline touchdown.
- Spectra are converted into a vector in n-dimensional space.
- Vector lengths (concentration) are minimized using least-squares regression.
- The vectors are moved into a 2D plane and the angle between them is measured.
TABLE I: Example chromatography data systems and peak purity criteria.

FIGURE 1: Graphical representation of absorbance vs. wavelength in dimensional space (reproduced from Figure 1 in [10]): (a) Depiction of a three-point spectrum; (b) representation of this spectrum as a vector in 3D space; (c) depiction of two, similar three-point spectra; (d) representation of these two spectra as vectors in 3D space, with the angle between the vectors representing spectral similarity.
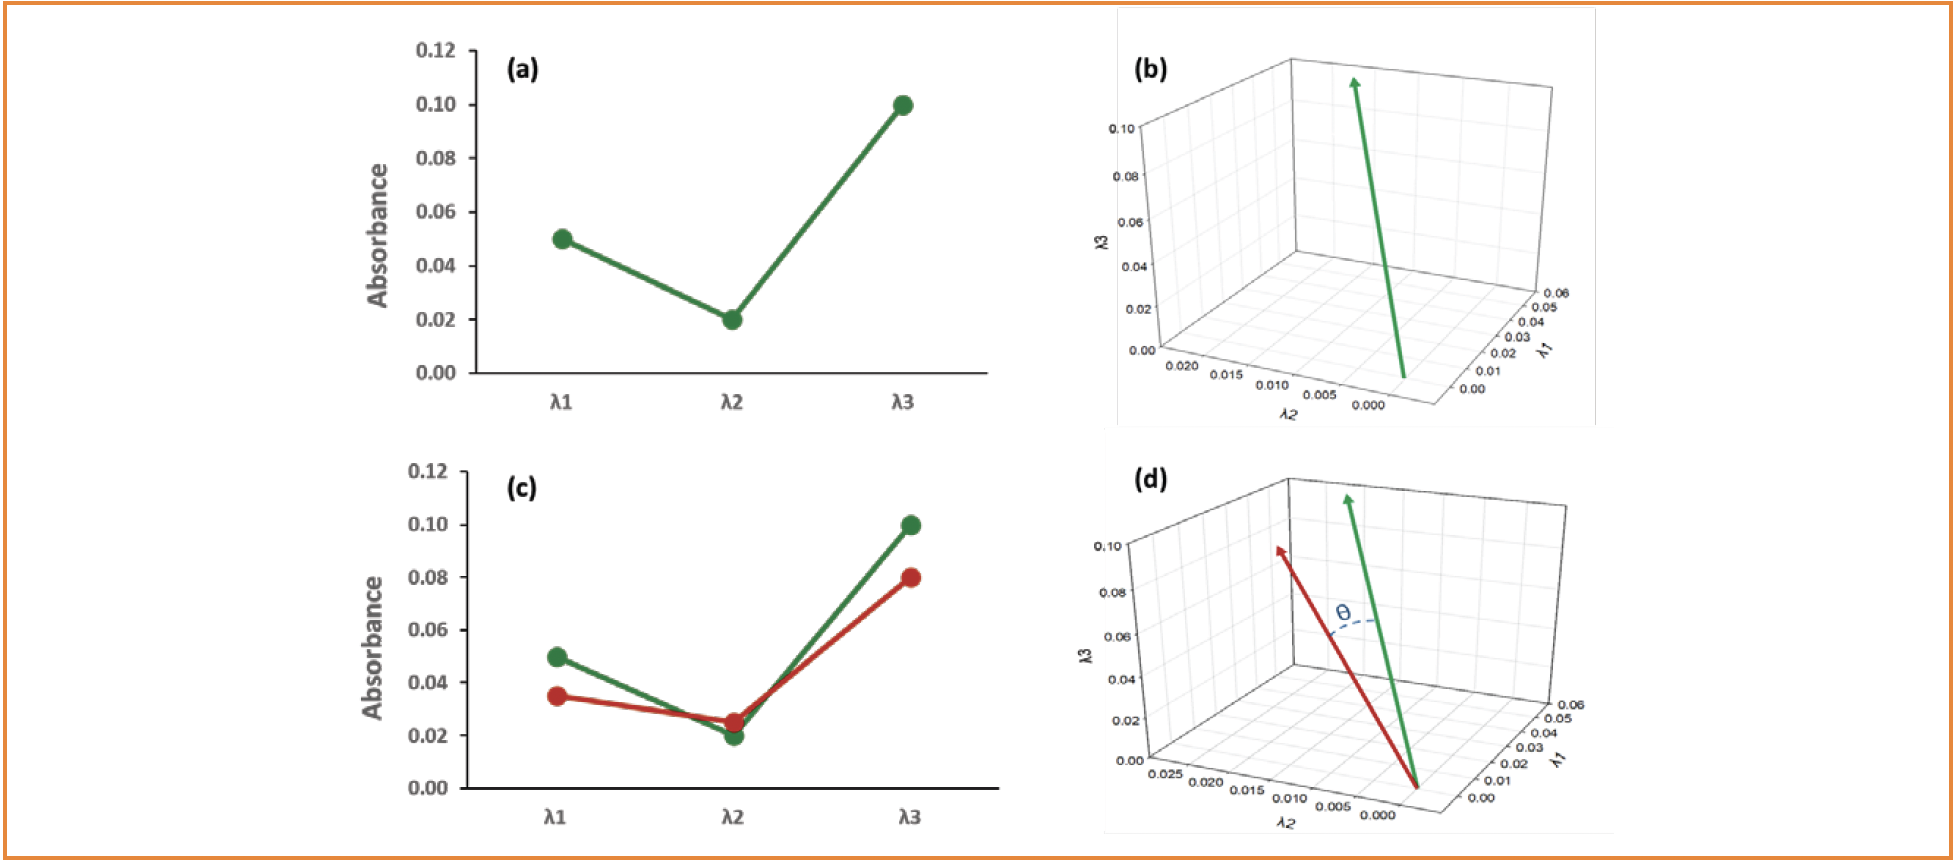
A spectral angle of 0 or 90 degrees indicates that the spectral shape is identical or that there is no spectral overlap, respectively. Spectra that diverge within a single peak are typically attributed to the coelution of compounds. Spectral contrast is used to compare all spectra within a peak to the apex spectrum by using an algorithm to calculate the purity angle (a weighted average of all calculated angles) and the degree of uncertainty because of the variation in the spectral vector (that is, the threshold angle) based on both solvent and noise contributions. A chromatographic peak is considered spectrally pure when its purity angle value is less than its purity threshold. Maziarz provides a practical example of verifying the spectral homogeneity of an API (12).
As listed in Table I, Agilent’s OpenLab CDS software uses a comparable approach to assess peak purity by calculating a similarity factor, which is expressed as 1000 × r2, where r is equivalent to cosθ (θ = purity angle in Empower).
Similarly, Shimadzu’s LabSolutions software uses cosθ values to quantify peak purity. Further, LabSolutions has a built-in feature of “i-PDeA II (Intelligent Peak Deconvolution Analysis II)” to deconvolve coeluted peaks using the algorithm of multivariate curve resolution-alternating least squares (MCR-ALS), the principle of which is discussed further in Section 4.3.3.
Strengths and Weaknesses of PDA-Facilitated UV PPAs
PDA-facilitated PPA, like any analytical technique, has a variety of strengths and weaknesses that should be considered when designing studies in which peak purity data are intended to be used to support conclusions about the stability-indicating capability of the method. Despite its limitations, UV spectral PPA is widely used and well understood in the analytical community within the pharmaceutical industry. It is an efficient and robust means of demonstrating spectral homogeneity of a peak with minimal or no extra cost in terms of time or resources.
One limitation—the potential for false negative results (that is, PPA results exhibiting spectral homogeneity while peaks still contain coeluted compounds)—occurs during spectral peak purity evaluations when:
- Coeluted impurities have minimal spectral difference.
- Coeluted impurities have poor UV responses.
- Impurity peaks are eluted near the apex of parent peak.
- Coeluted impurities are present at very low concentrations.
Similarly, false positives (that is, PPA indicating spectral inhomogeneity for a pure peak) are possible when:
- There are significant baseline shifts attributable to mobile phase gradients.
- PPA data processing settings are suboptimal.
- Integrations are suboptimal, leading to interference from background noise or neighboring peaks at the peak front or tail.
- UV absorbance measurements are conducted at extreme wavelengths (<210 nm or >800 nm).
- Impurities are evaluated at low concentrations (<0.1%), making interference from background noise is more pronounced.
- Artifacts, spurious spikes, and signal-dependent noise appear.
- Signals are present that are attributable to excipients or other substances unrelated to the API (that is, substances that are not degradants or process-related impurities).
Although they have their limitations, UV spectral PPAs are useful during chromatographic method development and forced degradation studies to confirm separation of the parent analytes from potential degradation products as determined by company best practices. Peak purity determination is not error-proof, and close attention should be paid, especially to borderline circumstances where false negative and positive results may occur.
Mass Spectrometry-Facilitated PPA
PPA by mass spectrometry (MS) is another option used to demonstrate method selectivity and is usually performed by nominal mass resolution single quadrupole mass spectrometers, such as the Waters QDa/SQD or Agilent MSD detectors. The PPA of a compound can be verified by demonstrating that the presence of the same precursor ions, product ions, and/or adducts across the peak that are attributed to the parent compound in the total ion chromatogram (TIC) or extracted ion chromatogram (EIC/XIC) (13).
Different MS instruments and data systems provide varied approaches to estimate mass spectral peak purity.
- On the Waters QDa, the mass spectra extracted at peak front, apex, and tail are compared and examined (14). Obtaining consistent mass spectra at three or more points across the parent peak provides evidence of peak purity.
- MS peak purity by Agilent MSD is determined by overlaying all the deconvoluted EIC peaks extracted from the TIC of the parent molecule (API) to estimate a MS purity score. A higher score than the configurable passing threshold, or minimum MS purity, suggests adequate peak purity.
The PPA thresholds (that is, the extraction point for the Waters QDa and the relative abundance cut-off for the Agilent MSD) need to be carefully selected to avoid false positives or negatives. The parent compound or impurities might be suppressed or fail to ionize, and impurities can have identical mass-to-charge (m/z) ratios as the parent, hindering direct MS determination and increasing the likelihood of false positives or negatives. Excessively high threshold values increase the risk of a false negative (incorrectly passing) PPA as potentially relevant signals may be excluded. Inversely, needlessly low threshold values raise the risk of a false positive (incorrectly failing) PPA because of the inclusion of signals attributable to solvent artifacts, baseline noise, or other responses unrelated to the parent compound, degradants, or process-related impurities. The appropriate threshold value should be determined on a case-by-case basis and varies between experiments, necessitating consideration of the instrumentation (such as cleanliness of the source or the sensitivity of the detector), the selectivity, sensitivity, and robustness of the analytical method, sample ionization efficiency or potential ion suppression, or interference from reagents or excipients, among other factors. It may be beneficial for the selection of the threshold to be accompanied by justification of the decision.
In addition to conducting PPAs with a nominal mass spectrometer, high-resolution MS (HRMS) can also be employed for this purpose. Although these advanced techniques typically require more sophisticated MS equipment (instruments with superior sensitivity, resolving power, and the ability to measure accurate mass) and greater expertise to interpret results, HRMS PPA provides additional evidence on spectral homogeneity by distinguishing masses that are attributed to the compound of interest from those that are not. For example, when acquiring mass spectra using ion trap MS or orbital trap (Tribrid) MS, mass traces are extracted for each peak of interest in TIC by manually selecting and extracting the associated mass spectral data above the peak width of the main component. These extracted mass traces are then overlaid to visually evaluate their congruence, where alignment between the traces indicates the purity of the peak. A detailed analysis of the mass spectra is conducted to determine if all detected masses can be attributed solely to the main component, comparing the observed masses with the expected masses based on the analyte’s molecular formula or known impurities. This evaluation confirms peak purity and identifies any potential coeluted components. Ion trap MS software (Analyst, ProteoWizard) generates a peak list table with relative intensities assigned to detected masses, allowing further analysis of other m/z ratios in descending order relative to the intensity of the main mass, providing additional insights into peak purity. The results from such mass spectral PPAs provide further valid evidence of peak purity even in the circumstances when UV spectral PPA information are not available or obtainable.
However, it is important to note that, when using a HRMS instrument, the ratio of attributable to non-attributable masses does not always offer an exact measure of spectral homogeneity. This is primarily because of the challenges in accurately estimating the co-eluting impurity’s proportion in the absence of impurity identification and the incorporation of a relative response factor or quantitation via an external standard in most cases. These complexities are attributed to various factors that influence signal response, such as ionization efficiency and signal suppression, for which specific values are not known. Consequently, establishing precise criteria for HRMS PPA becomes challenging because of the need to make various assumptions, including assuming uniform ionization efficiency and consistent response (that is, a relative response factor of one) for all detected compounds.
In essence, although MS PPA does not provide specific values to set acceptance criteria, such as the purity threshold and angle values shown in Table I for PDA assessments, it is advisable to supplement the regulatory submission dossier with more comprehensive explanatory information when conducting this assessment, which will help streamline the data review process.
Additional PPA Methodologies
Orthogonal Chromatographic Conditions
In certain circumstances, such as when the UV spectral PPA are not obtainable (when a PDA detector is not available or when an analyte has poor UV absorbance), peak purity can also be evaluated by employing orthogonal chromatographic conditions, which involve using different stationary phases, such as reversed phases compared to HILIC, or varying the composition of the mobile phase (altering the pH or organic modifiers). These alterations provide orthogonal separation mechanisms. By varying chromatographic conditions and parameters, impurity peaks that might coelute with the parent compound on one system have the potential to be resolved on another, allowing for a more accurate PPA. Moreover, the peak purity can be further investigated by collecting a fraction of the parent peak to be re-analyzed under orthogonal conditions (that is, manual 2D-LC).
2D-LC
Generally, 2D-LC instrumentation is not widely available in many laboratories because it is not a technology typically used for quality control (QC) testing and requires subject matter experts (SMEs) for maintenance and operation. When available, however, one of the most powerful capabilities of this technique is its ability to physically separate components that may be coeluted with the compound of interest under one set of chromatographic conditions.
2D-LC achieves this by subjecting effluent from one chromatographic system to a second set of chromatographic conditions. The combination of two different separation mechanisms results in improved resolution and separation of components in complex samples, where the two sets of conditions are joined through a “heart-cutting” or “fraction collecting” process. This process first separates components under the normal (or nominal) chromatographic conditions (1D), then makes use of a post-column sampling valve that diverts the flow of effluent at the expected retention time(s) of the peak(s) of interest, to the second separative system (2D).
2D-LC may also be used as an alternative method development tool or for investigations in forced degradation studies (15–17). Figure 2 exhibits a high-level illustration of the operation mechanisms of 1D and 2D-LC, permitting comparison of the two approaches (18). Using sequential chromatographic systems with orthogonal conditions or columns expands the separative ability of each system, offering superior overall selectivity that can separate coeluted peaks. Peak purity using this technique can be evaluated by comparing various characteristics, including chromatographic profiles, UV spectra, and mass spectra obtained from different dimensions. Deviations or overlaps in these characteristics may indicate the presence of coeluted components or impurities, suggesting potential purity concerns (17).
FIGURE 2: High-level comparison of 1D and 2D-LC (reproduced from Figure 1.1 of [18]).

PPA by Chemometrics
Chemometric techniques are also used to provide robust analyses using PDA spectral data by deconvoluting peaks composed of major and minor components (15). In principle, these techniques analyze the matrix of absorbance measurements at all wavelengths (that is, spectra) and at all time points across a given time region in the chromatogram. Using a regression-based approach to determine how the spectra change over time, any impurities cannot only be discovered, but also be mathematically resolved from the target peak. Several algorithms for PPA, including principal component analysis (PCA), evolving factor analysis (EFA), and, more recently, multivariate curve resolution-alternating least squares (MCR-ALS) have been reported in literature (19–22). However, these algorithms have neither not been widely implemented in commercial chromatographic data systems, nor have any reports comparing PPA results by chemometrics versus those determined by commercial software been published. As this technology is in its early stages of development, it should be considered an optional, potentially emerging, investigational tool for PPA assessments.
Summary of Current PPA Best Practice
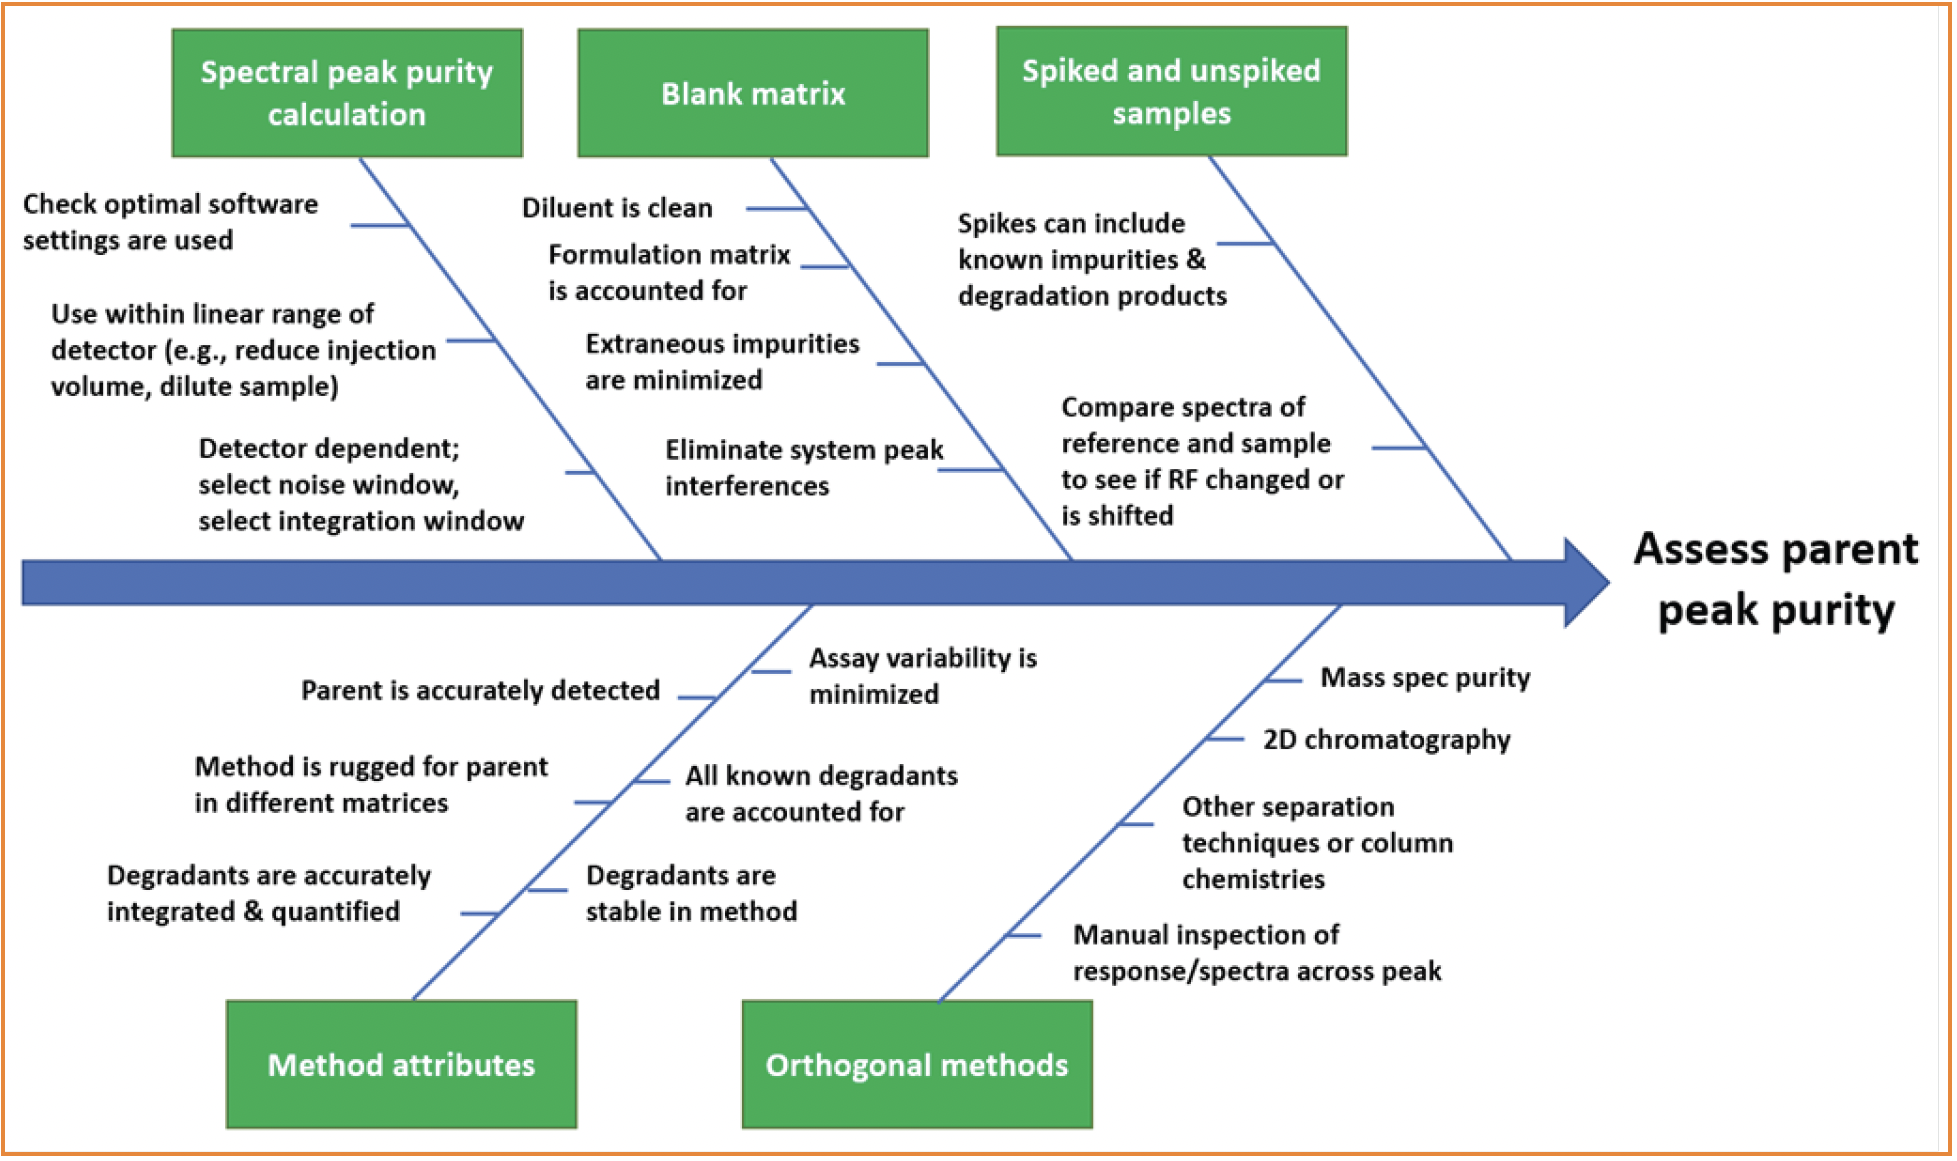
According to the information provided by the contributing analytical chemistry experts who are employed by global pharmaceutical companies, PPA results are typically part of the marketing application FDS data package supporting the suitability of a stability-indicating method. PPAs are performed on the peaks of parent compounds in chromatograms from samples stressed under various conditions to demonstrate confidence that no peaks attributed to degradation products are coeluted with the parent compound, thereby providing supporting information that the method is stability indicating. Typically, forced degradation is allowed to proceed until either 5–20% degradation of the API or drug product is achieved, or the pharmaceutically relevant endpoints of the stress conditions are reached (23,24). Figure 3 shows an Ishikawa (fishbone) diagram exhibiting factors to be considered when assessing the purity of the parent peaks in a method. Along the lines connecting these boxes to the central backbone are example components that provide more detail for each factor. This diagram serves as a troubleshooting tool when investigating why a particular PPA for a given method has indicated spectral inhomogeneity.
FIGURE 3: Considerations for troubleshooting spectral inhomogeneity.
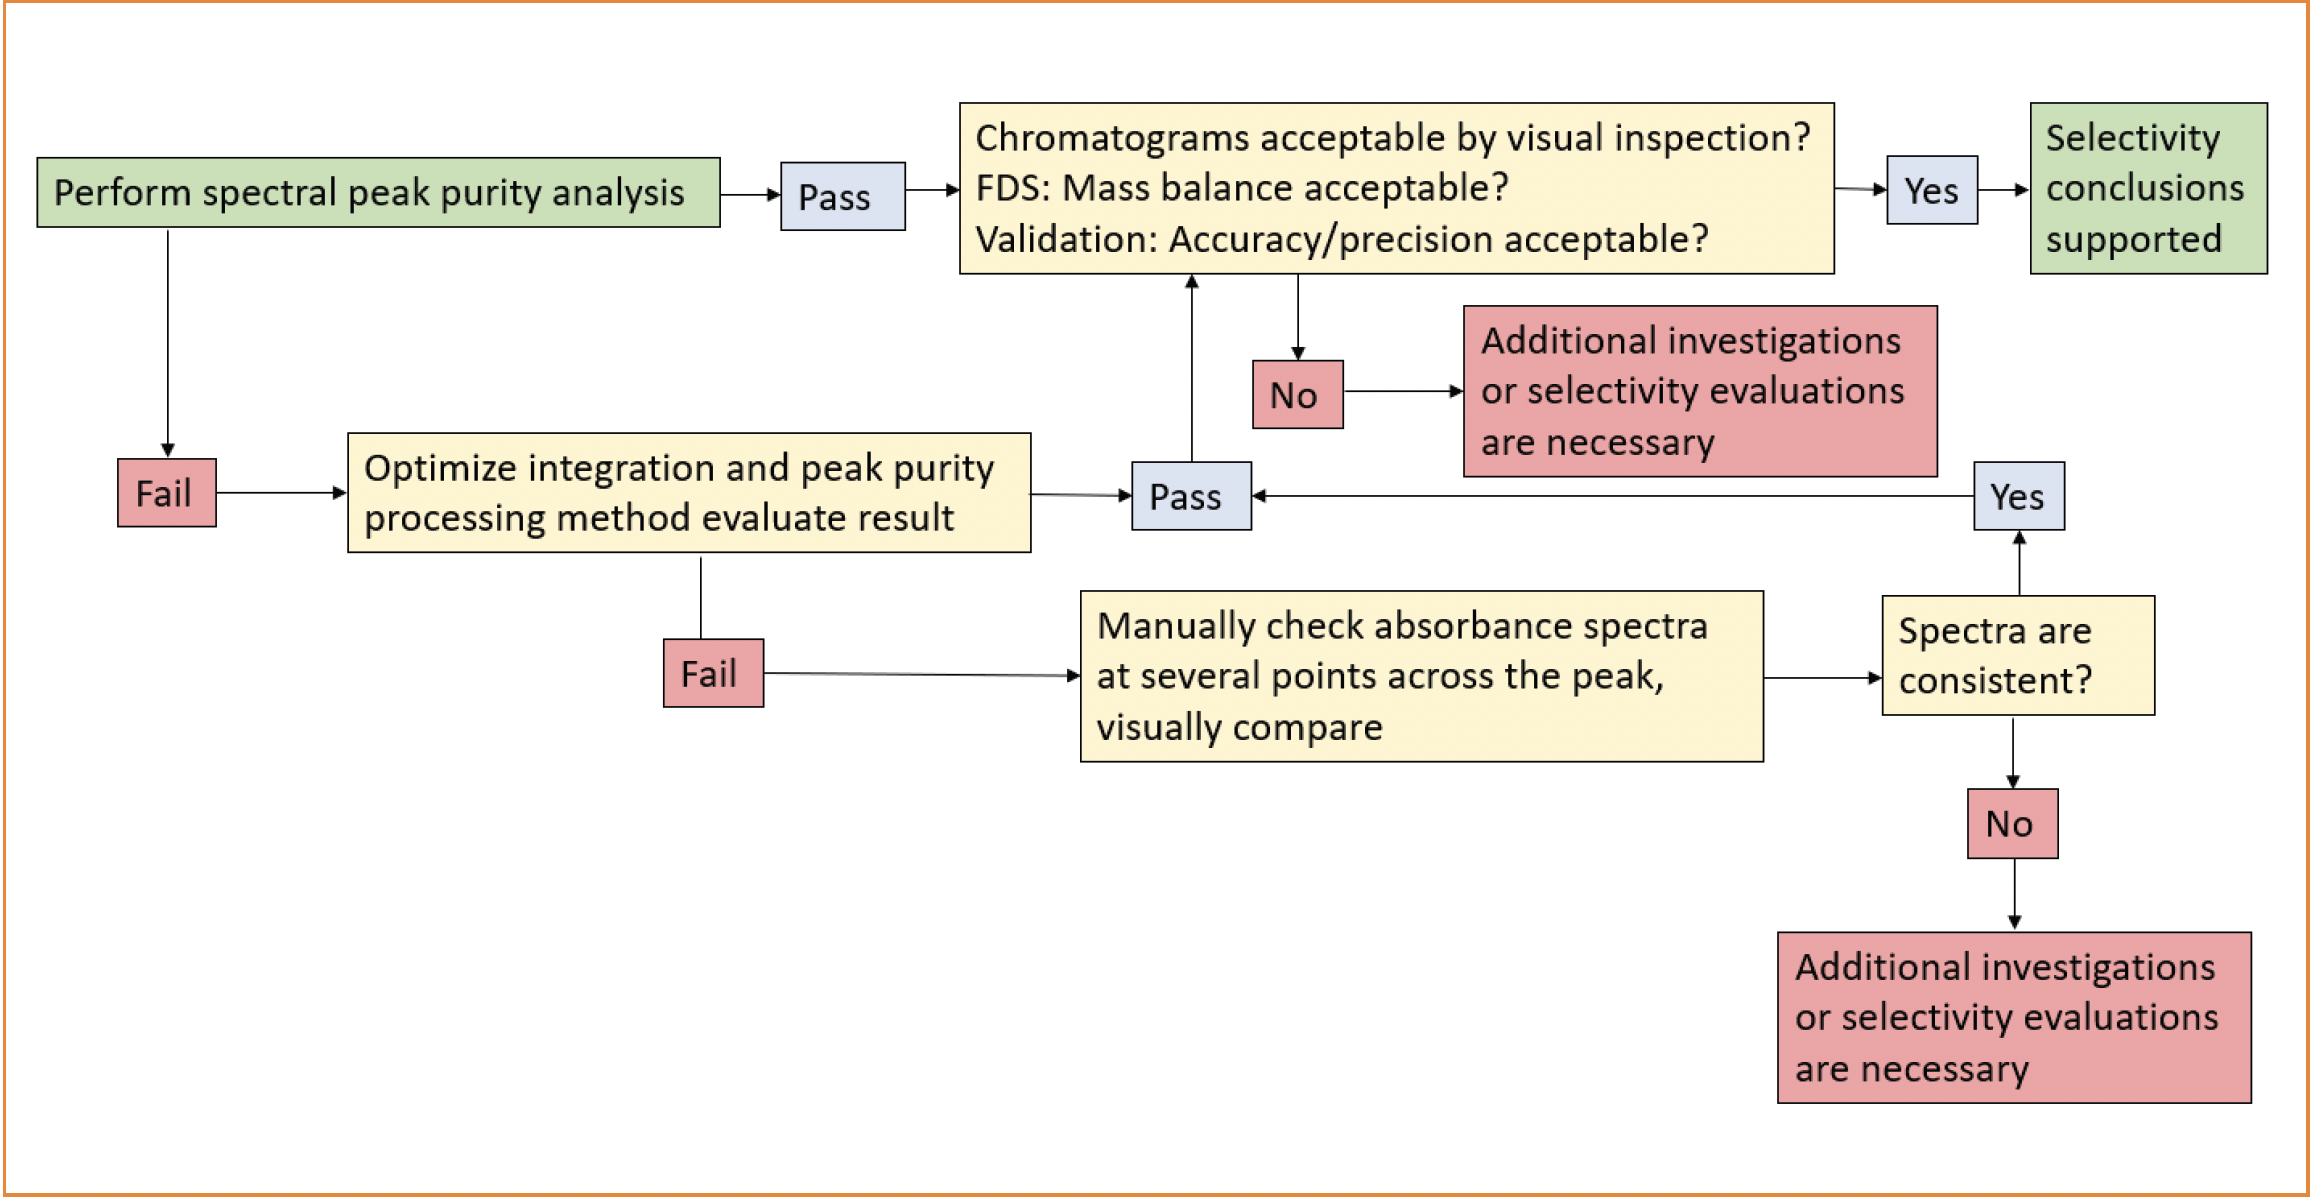
Multiple factors should be considered when interpreting the results of parent peak purity assessment. The execution of appropriate FDS conditions to reach target degradation levels or scientifically justified endpoints (24) is essential to obtain meaningful PPA results. In determining the purity of a parent peak, along with obtaining acceptable PPA data, other information such as mass balance and response factors of expected degradants should be assessed to mitigate the risk of false negative results. When PPA results do not meet purity criteria, precautions should also be taken to avoid false positive results because of inappropriate data processing and interpretation. Figure 4 displays a flow chart that summarizes a suggested approach to interpreting PPA results and the circumstances under which further investigation may be appropriate.
FIGURE 4: PDA (UV) PPA suggested decision tree for determining whether additional investigation by other techniques is necessary for establishing peak purity.
After obtaining evidence that the parent peak in a partially degraded or stressed sample is spectrally impure, assuming the stress condition is pharmaceutically relevant (24) for the API or drug substance (DS) and/or drug product (DP), further investigation to understand the nature and origin of the coeluted species should be considered. Such an investigation may include assessments of known impurities and/or excipients, orthogonal detection techniques, and/or orthogonal methods such as 2D-LC. Ultimately, it may be necessary to redevelop the analytical method to ensure the method is stability indicating. However, if suitable justification can be provided (such as evidence that the coeluted impurity is not relevant to long-term stability), redevelopment of the method may not be required. These types of circumstances should be addressed on a case-by-case basis using sound scientific reasoning and approaches.
Final Recommendations to Guide PPA
It is recommended that PPA be performed as part of a FDS using the commercial software as a part of stability-indicating method development and validation activities that support regulatory submissions (that is, marketing applications) of pharmaceutical data. Software-calculated spectral PPAs are widely used in the analytical community within the pharmaceutical industry. In FDSs, such PPA techniques are an efficient and robust means to demonstrate spectral homogeneity of the parent peaks in stressed DS or DP sample chromatograms.
PPAs facilitated by PDA detection are most used and are applicable to most small molecule APIs. Under the circumstances when UV spectral PPA information are unavailable or unobtainable, PPA results obtained by other techniques, such as MS, are equally valid provided that appropriate peak purity criteria are met. Questionable or aberrant PPA data, including false negative or positive results, may be obtained in borderline circumstances or due to suboptimal data processing and result interpretation.
Because of these limitations, a PPA cannot prove unequivocally that a peak is pure; a PPA can only conclude that no coeluted compounds were detected. However, potential selectivity issues of a stability-indicating method should not be evaluated with peak purity results alone. Indeed, PPA issues often coincide with other readily observable analytical and chromatographic concerns such as poor mass balance, poor resolution and column efficiency, or matrix interference. As such, other chromatographic elements that affect method selectivity should be evaluated in conjunction with PPA, even when PPA result acceptance criteria are met. If the data indicate that the parent peak is spectrally impure, orthogonal detection, orthogonal methods, and/or 2D-LC are potential supplementary options for further investigation.
The authors hope that this review serves a useful overview and resource for analytical scientists, both inside and outside the pharmaceutical industry, as well as for associated pharmaceutical HA representatives and reviewers.
Disclaimer
Employers of the authors of this article, and any other companies noted herein, did not contribute to this article or any of the articles referenced, nor did they provide funding support for any part of this paper. Contributions by authors are limited to time spent writing, editing, performing literature research, discussing, and sharing expert insights gleaned over the course of their respective careers.
Acknowledgement
The authors gratefully acknowledge the following individuals for their technical assistance and support: Paul Gerst, Scott Jennings, and Flavia Firmino.
References
(1) Baertschi, S. W.; Alsante, K. M.; Reed, R. A., eds. Pharmaceutical Stress Testing: Predicting Drug Degradation, 2nd ed.; Informa Healthcare; 2011.
(2) Reynolds, D. W.; Facchine, K. L.; Mullaney, J. F.; Alsante, K. M.; Hatajik, T. D.; Motto, M. G. Available Guidance and Best Practices for Conducting Forced Degradation Studies. Pharm Technol. 2002, 26, 48–56.
(3) Aubry, A.- F.; Tattersall, P.; Ruan, J. “Development of Stability Indicating Methods." In: Huynh-Ba. K., ed., Handbook of Stability Testing in Pharmaceutical Development; Springer, 2009; 139–161.
(4) Campbell, J. M.; Foti, C.; Wang, C.; et al. Assessing the Relevance of Solution Phase Stress Testing of Solid Dosage Form Drug Products: A Cross-Industry Benchmarking Study. J. Pharm. Sci. 2022, 111, 298–305. DOI: 10.1016/j.xphs.2021.06.012
(5) Papadoyannis, N.; Gika, H. G. Peak Purity Determination with a Diode Array Detector. J. Liq. Chrom. Rel. Tech. 2004, 27, 1083–1092. DOI: 10.1081/JLC-120030180
(6) Brazilian Ministry of Health, National Health Surveillance Agency (ANVISA): Regulation on Report, Identification and Qualification of Degradation Products, Resolution RDC 53, 2015.
(7) Brazilian Ministry of Health, National Health Surveillance Agency (ANVISA): Analytical Validation Parameters. Chapter IV, Resolution RDC 166, 2017.
(8) International Council for Harmonisation of Technical Requirements for Pharmaceuticals for Human Use (ICH), Validation of Analytical Procedures: Text and Methodology, Q2A(R1), 2005.
(9) International Council for Harmonisation of Technical Requirements for Pharmaceuticals for Human Use (ICH), Validation of Analytical Procedures, Q2A(R2), Draft version, 2022.
(10) Stoll, D. R.; Rutan, S. C.; Venkatramani, C. J. Peak Purity in Liquid Chromatography, Part I: Basic Concepts, Commercial Software, and Limitations. LCGC N. Am. 2018, 36 (2), 100–110.
(11) Waters Knowledge Base, Empower 3 PDA: What is Purity 1 Angle, Purity 1 Threshold (How is the peak purity determined) – WKB85832, support.waters.com, Dec. 20, 2021; https://support.waters.com/KB_Inf/Empower_Breeze/WKB85832_Empower_3_PDA_What_is_Purity_1_Angle_Purity_1_Threshold_How_is_the_peak_purity_determined
(12) Maziarz, M.; Verifying Spectral Purity of a Chromatographic Peak Using Empower CDS Software. Waters Appl. Note. May 2019; https://www.waters.com/content/dam/waters/en/app-notes/2019/720006582/720006582-en.pdf
(13) Bylund, D.; Danielsson, R. Peak Purity Assessment in Liquid Chromatography–Mass Spectrometry. J. Chromatogr. A 2001, 915, 43–52. DOI: 10.1016/s0021-9673(01)00543-x
(14) Waters Knowledge Base, Empower 3 PDA: PDA and QDa Peak Purity – Processing and Reviewing Results – Tip257, support.waters.com, Dec. 28, 2021; https://support.waters.com/KB_Inf/Empower_Tips_of_the_Week/WKB225233_PDA_and_QDa_Peak_Purity_-_Processing_and_Reviewing_Results
(15) Ahmad, I. A.; Blasko, A.; Clarke, A.; Fakih, S. Two-Dimensional Liquid Chromatography (2D-LC) in Pharmaceutical Analysis: Applications Beyond Increasing Peak Capacity. Chromatographia 2018, 81, 401–418. DOI: 10.1007/s10337-018-3474-8
(16) Stoll, D. R.; Rutan, S. C.; Venkatramani, C. J. Peak Purity in Liquid Chromatography, Part III: Using Two-Dimensional Liquid Chromatography. LCGC N. Am. 2018, 36 (6), 356–361.
(17) Lee, C.; Zang, J.; Cuff, J.; et al. Application of Heart-Cutting 2D-LC for the Determination of Peak Purity for a Chiral Pharmaceutical Compound by HPLC. Chromatographia 2013, 76, 5–11. DOI: 10.1007/s10337-012-2367-5
(18) Carr, P. W.; Stoll, D. R. Two-Dimensional Liquid Chromatography – Principle, Practical Implementation and Applications. Agilent Technology Primer, May 2015, https://www.agilent.com/cs/library/primers/public/5991-2359EN.pdf
(19) Stoll, D. R.; Rutan, S. C.; Venkatramani, C. J.; Cook, D. W. Peak Purity in Liquid Chromatography, Part II: Potential of Curve Resolution Techniques. LCGC N. Am. 2018, 36 (4), 248–255.
(20) Brerenton, R. G., “Principal Component Analysis and Unsupervised Pattern Recognition," in Chemometrics: Data Driven Extraction for Science, 2nd ed.; John Wiley & Sons, 2018.
(21) Maeder, M. Evolving Factor Analysis for the Resolution of Overlapping Chromatographic Peaks. Anal. Chem. 1987, 59, 527–530.
(22) Juan, A.; Rutan, S. C.; Tauler, R.; Massart, D. L. Comparison Between the Direct Trilinear Decomposition and the Multivariate Curve Resolution-Alternating Least Squares Methods for the Resolution of Three-Way Data Sets. Chemometrics Intel. Lab. Sys. 1998, 40, 19–32.
(23) Alsante, K. M.; Ando, A.; Brown, R.; et al. The Role of Degradant Profiling in Active Pharmaceutical Ingredients and Drug Products. Adv. Drug Deliv. Rev. 2007, 59, 29-37. DOI: 10.1016/j.addr.2006.10.006
(24) Zelesky, T.; Baertschi, S. W.; Foti, C.; et al. Pharmaceutical Forced Degradation (Stress Testing) Endpoints: A Scientific Rationale and Industry Perspective. J. Pharm. Sci. 2023, 112 (12), 2948–2964. DOI: 10.1016/j.xphs.2023.09.003
ABOUT THE AUTHORS
Pascal Marillier and Neal Adams are with Scientific and Laboratory Services – Analytical Sciences at Pfizer Inc, in Kalamazoo, MI.
Steven W. Baertschi is with Baertschi Consulting LLC, in Carmel, Indiana.
John M. Campbell is with Analytical Development at GlaxoSmithKline, in Upper Providence, PA.
Chris Foti and Liping Meng are with Analytical Development and Operations at Gilead Sciences Inc., in Foster City, CA.
Juçara Ribeiro Franca is with the Brazilian Health Regulatory Agency (ANVISA), in Brasilia, Brazil.
Simon Hicks is with Analytical Development, at GlaxoSmithKline in Stevenage, UK.
Dorina Kotoni is with Chemical & Analytical Development at Novartis Pharma AG, in Basel, Switzerland.
Christian Laue is with Chemical & Pharmaceutical Development at Merck Healthcare KGaA, in Darmstadt, Germany.
Stacey Marden is with Advanced Drug Delivery, Pharmaceutical Sciences, R&D, at AstraZeneca, in Boston, MA.
Ana Claudia de Oliveira Santos is with Global Analytical Technology at Merck Brazil, in São Paulo, Brazil.
Mariah Ultramari is with Spektra Soluções Científico-Regulatórias Ltda, in São Paulo, Brazil.
An Van Cleempoel is with Small Molecule Method Development at Janssen Pharmaceutica, Johnson & Johnson, in Beerse, Belgium.
Chloe Wang is with Analytical Development at Jazz Pharmaceutical, in Palo Alto, CA.
Todd Zelesky is with Analytical Research & Development at Pfizer Inc., in Groton, CT.
Zongyun Huang is with Drug Product Development at Bristol-Myers Squibb Co., in New Brunswick, NJ.
Direct correspondence to Zongyun Huang at zongyun.huang@bms.com
Silvia Radenkovic on Building Connections in the Scientific Community
April 11th 2025In the second part of our conversation with Silvia Radenkovic, she shares insights into her involvement in scientific organizations and offers advice for young scientists looking to engage more in scientific organizations.
Polysorbate Quantification and Degradation Analysis via LC and Charged Aerosol Detection
April 9th 2025Scientists from ThermoFisher Scientific published a review article in the Journal of Chromatography A that provided an overview of HPLC analysis using charged aerosol detection can help with polysorbate quantification.


