Letting the Chromatograph Talk, Part I–Looking for Troubleshooting Clues in Unexpected Places
LCGC North America
Is an ultraviolet (UV) detector signal good for anything if the analyst is using a mass spectrometer?
Although I continue to be impressed with the capabilities of modern instrumentation for chromatography, my experience over many years has been that, if I put enough instruments in a laboratory and mix them with students, I am confronted daily with opportunities to hone my troubleshooting skills. In other words, things can and do go wrong even when working with the latest, greatest instruments.
“The peaks are not coming out.” “The pressure is too high.” “The pressure is too low.” “The UV detector signal looks weird.” This is an assortment of the kinds of observations I hear from researchers in my lab across all experience levels. What I have come to learn is that in almost every case of something not working correctly there are good clues laying around that can lead us quickly to the cause of the problem. The trick then is more about finding or paying attention to these clues – letting the chromatograph talk – than it is about anything else. Sometimes the clue is a colored residue under a pump head. Other times it is a bottle of solvent on the instrument that does not look well mixed (ask me about the time a pump ran backwards – literally). This month I will discuss two places to find clues that are easily overlooked – the pressure trace recorded by the LC pump, and UV detector signals at low wavelengths.
I vividly recall a conversation I had as a graduate student with a field specialist for a major instrument vendor who had been working with chromatography and mass spectrometry equipment in laboratories all over the world for three decades. I was describing to him that I was having trouble with an LC instrument that was not delivering flow to the column at the expected flow rate. I had looked carefully at the pump and concluded that the pump was delivering the correct flow at the pump outlet. And yet, I did not observe the expected flow rate at the column exit. He said to me pointedly – “If the pump is working correctly, then you must have a leak somewhere.” I was baffled by this, because there was no obvious leak anywhere in the system. But, taking his point to heart, I began digging deeper and found that the rotor seal of the injector valve was so badly worn that some mobile phase was leaking out to the waste port of the valve. This was not immediately evident, because we had the waste port connected to a waste container instead of running it to a tray with a leak sensor. The point that I took away from the interaction with the specialist is that chromatographs are not mysterious black boxes that have magic happen inside of them. They are instruments built by humans, that abide by classical physical laws (such as conservation of mass, for example). And so, if we take the time to understand how they work, we will have a better chance of interpreting the many clues in and around the instrument and data system that can help us solve the problem at hand, and get back to acquiring good data.
The Pump Pressure Trace as a Source of Clues
Most modern LC systems record the system pressure measured at the pump outlet as part of the datafile associated with an analysis. Obviously, the pump has to be functioning reliably for the recorded pressure data to be a useful source of clues to support troubleshooting. If the pump itself is not working properly, that raises a different set of questions that John Dolan has written about extensively in the past (1). If the pump does appear to be working properly, then there are at least two important ways that the pressure trace can be useful. For liquid flowing through an open tube (such as a connecting tube in an LC system), the pressure drop across the tube (that is, the difference between the inlet and outlet pressures) is given by the Hagen-Poiseuille law:

[1]
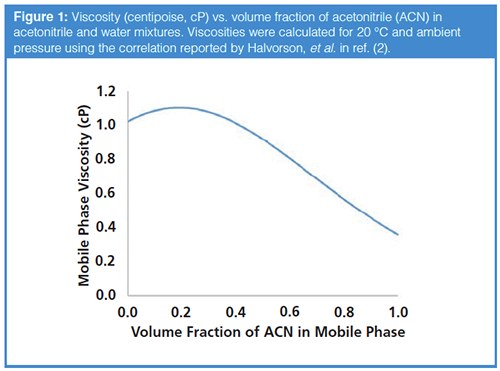
Where µ is the dynamic viscosity of the fluid moving through the tube, L is the tube length, r is the tube radius, and F is the flow rate of the liquid. In this equation, we see two things of practical significance to the discussion here. First, any increase in the length of the tube, or decrease in the radius of the tube (such as when a tube is partially blocked, reducing the effective radius), will result in an increase in the pressure drop measured at the pump. Second, any change in the viscosity of the mobile phase will result in a corresponding change in the pressure drop. The dependence of the viscosity of acetonitrile and water mixtures on the fraction of acetonitrile in the mixture is shown in Figure 1. If we were to execute a solvent gradient running from 0 (100% water) to 1 (100% acetonitrile (ACN)), then we would expect the pressure trace measured over the course of the gradient to have the same shape.
Case Study #1 - Are you sure the gradient was 90% to 50% ACN?
This case study comes straight out of some work in my laboratory that we have been doing to develop a method for a hydrophilic interaction liquid chromatography (HILIC) separation. Early on in the work, I asked a student to do some scouting gradients starting at 90:10 acetonitrile–aqueous buffer and running to 50:50 acetonitrile–buffer at the end of the gradient. After some time, the student reported to me that the peak for acenaphthene, which can be used as a dead time marker for HILIC separations, looked unusually small. One of the first things I did in troubleshooting this unexpected result was to look at the pressure trace, which is shown in Figure 2.
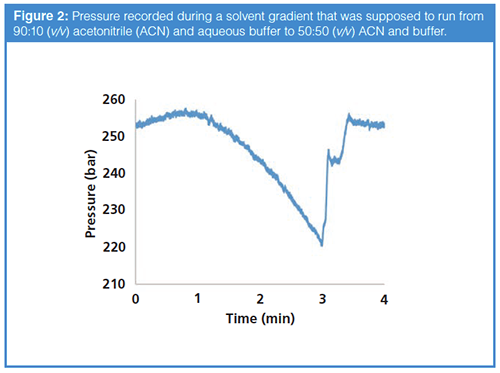
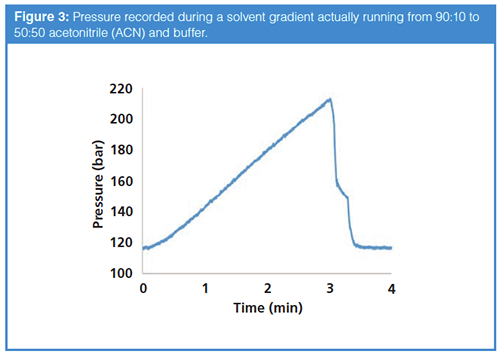
Given the shape of the viscosity curve in Figure 1, for a gradient running from 90% to 50% acetonitrile, we would expect the pressure trace to start low and steadily increase toward the end of the gradient. This is clearly not what we see in this case. Figure 3 shows the pressure trace for a separation where the gradient was actually 90% to 50% acetonitrile. Upon looking further into the method that was used for this analysis, it became evident that indeed the gradient that was used was set to 10% to 50% acetonitrile by mistake. The reason the acenaphthene peak was small is because it was actually never eluting in the relatively water-rich mobile phase (the observed peak was probably an impurity). In this case, simply looking at the pressure trace provided a good clue that something probably was not right about the method, and that we should look into this more closely rather than pursuing other possible problems, such as the sample itself.
Case Study #2 - Something does not look right about this picture.
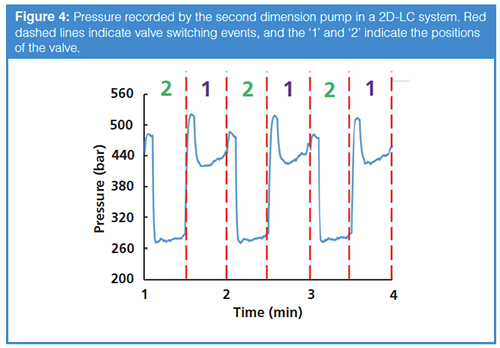
The data for this second case study comes from work in my laboratory a few months ago that was focused on two-dimensional liquid chromatography (2D-LC) separations of peptides. Upon review of chromatograms from the previous night’s analyses, the data did not look right at all. Turning to the pressure trace for the second dimension of the 2D-LC system, it was obvious that something was not right with this part of the system. Figure 4 shows the pressure trace from the second dimension pump, where I have layered on red dashed lines, and the 1/2 pattern that shows when valve switches occurred to transfer mobile phase from the first to the second dimension column. Looking at the data this way makes it clear that the system was working properly in position #1 of the valve, but then in position #2 the pressure suddenly dropped several hundred bar, and in a reproducible way. With this clue in mind, I visually inspected the valve itself, and found that there was a major leak at one of the capillary connections to the valve that only had liquid flow through it when the valve was in position #1. Keeping in mind the Hagen-Poiseuille law above, a leak in the system is like effectively shortening the length of the flow path (L). After tightening the suspect capillary connection the 1/2 pattern went away, and subsequent 2D chromatograms returned to normal. Here again, a quick look at the pressure trace from the pump yielded a clue that was used to quickly isolate the likely source of the problem in this system, and avoided the time-consuming pursuit of other potential causes of the problem.
Using a UV Detector Signal as a Source of Clues (even when MS is the detector you care about)
One of the interesting dilemmas we face in coupling liquid chromatography (LC) separations to ultraviolet (UV) and mass spectrometry (MS) detection is that the aqueous buffers most suitable to UV detection (for example, phosphate buffers for their transparency) are terrible for MS detection, and vice versa. For example, formic acid is volatile and great for MS, but terrible for UV because it absorbs strongly at low wavelengths. This tendency of formic acid and other volatile buffering agents to absorb at low wavelengths is indeed annoying, and it is tempting to avoid using the UV detector in cases where we are most interested in data from a MS detector. Nevertheless, in my laboratory we routinely use both UV and MS detectors at the same time, because our experience has been that the UV data has been very useful for troubleshooting purposes on many, many occasions. Using the two detectors together can be done either by running LC column effluent through the UV detector first and on to the MS detector, or by splitting the column effluent so that part of it goes to the UV detector and part of it goes to the MS. There are advantages and disadvantages associated with each of these approaches, but we’ll leave the substance of that comparison for a different day.
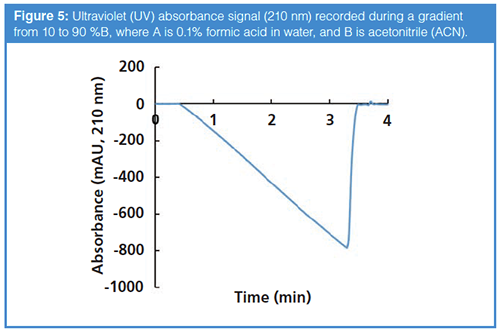
In any situation where we are mixing two or more solvents to prepare the mobile phase, and one of the components absorbs more strongly at a particular wavelength, then we will see that the UV detector baseline changes during a solvent gradient elution program. A common example of this is illustrated in Figure 5, where I have recorded the absorbance at 210 nm during a gradient from 10% to 90% B over 4 minutes, where A is 0.1% formic acid in water and B is acetonitrile. Here, the A solvent absorbs much more strongly than the B solvent (acetonitrile is very transparent at 210 nm), so we see that the measured absorbance decreases as the fraction of A solvent in the mobile phases decreases.
Case Study #1 (Revisited) - Are you sure the gradient was 90% to 50% acetonitrile?
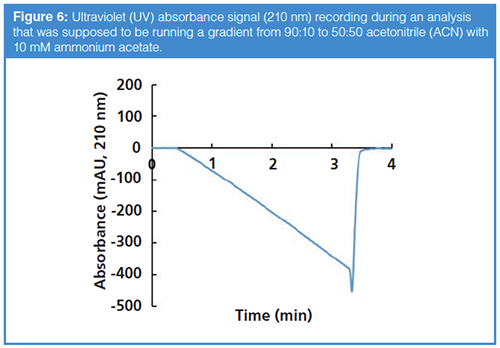
Going back to our first case study, the pressure trace provided a good troubleshooting clue as discussed above. But, if this were inconclusive, we could also have looked at the UV detector signal. Recall that our intended gradient in this work was 90% to 50% B, where A was 10 mM ammonium acetate, and B was acetonitrile. The UV absorbance signal at 210 nm from the experiment is shown in Figure 6. Clearly this signal is headed in the wrong direction for a gradient of 90% to 50 %B, where we would expect to see an increase in absorbance as the fraction of the absorbing ammonium acetate in the mobile phase increases over the course of the gradient. This again confirms that the gradient had mistakenly been programmed as 10% to 50% B.
Closing Remarks
Modern chromatographs and data system have the ability to record and store a variety of data streams (for example, column temperature, pump pressure, pump piston position, etc.). In some cases, these streams are not recorded by default, but can be selected for recording by the user. My experience has been that these data can be rich sources of information to support troubleshooting. I encourage you to get to know your chromatograph a little better, and listen when it wants to talk to you!
Interested in a Troubleshooting Topic?
Is there a troubleshooting topic that you are interested in, but have not seen discussed in this column? I am particularly interested to hear what you, as a regular reader of the column, have to say about topics you would like to see addressed here. Are there topics that are emerging challenges that you have not seen addressed in the past? Are there “old” topics that you would like to see addressed in more depth? I’d love to hear your topic suggestions! Please send them along to LCGCedit@ubm.com.
References
- J.W. Dolan, LCGC North Am.24, 132–135 (2006).
- J. Halvorson, A.M. Lenhoff, M. Dittmann, and D.R. Stoll, J. Chromatogr. A1536, 185–194 (2016). doi:10.1016/j.chroma.2016.12.084.
Dwight R. Stoll is the editor of “LC Troubleshooting.” Stoll is a professor and co-chair of chemistry at Gustavus Adolphus College in St. Peter, Minnesota. His primary research focus is the development of 2D-LC for both targeted and untargeted analyses. He has authored or coauthored more than 50 peer-reviewed publications and three book chapters in separation science and more than 100 conference presentations. He is also a member of LCGC’s editorial advisory board. Direct correspondence to: LCGCedit@ubm.com

Polysorbate Quantification and Degradation Analysis via LC and Charged Aerosol Detection
April 9th 2025Scientists from ThermoFisher Scientific published a review article in the Journal of Chromatography A that provided an overview of HPLC analysis using charged aerosol detection can help with polysorbate quantification.
Removing Double-Stranded RNA Impurities Using Chromatography
April 8th 2025Researchers from Agency for Science, Technology and Research in Singapore recently published a review article exploring how chromatography can be used to remove double-stranded RNA impurities during mRNA therapeutics production.


