LCxLC: Comprehensive Two-Dimensional Liquid Chromatography
LCGC North America
Guest Editor Peter Schoenmakers provides an introduction to LCxLC, and then goes on to talk about peak capacity, sample dimensionality, phase orthogonality, and some of the successes of the technique and the obstacles yet to be overcome.
Comprehensive two-dimensional separations are a definite trend in chromatography today. Comprehensive two-dimensional gas chromatography (GC×GC) emerged some 15 years ago (1). After a sluggish start — arguably attributable to a limited availability of instrumentation and software — this is now a widely accepted and commonly used technique for the separation of complex mixtures of volatile analytes. The roots of comprehensive two-dimensional liquid chromatography (LC×LC ) are older. Two-dimensional thin-layer chromatography can be considered a form of LC×LC, dating the technique back at least some 50 years. The contemporary version of LC×LC — based upon two columns and an elegant valve-switching concept — was first demonstrated by Erni and Frei (2) and it, too, preceded GC×GC by a considerable period of time.
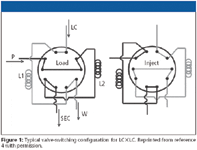
The common way to perform LC×LC involves a first-dimension separation that is relatively slow, with a typical analysis time of 1 h or longer. Fractions of the effluent from this first-dimension column are collected in a loop of a switching valve. When this valve is switched, the fraction is injected onto a second column, which provides a much faster separation, typically with an analysis time of a minute or less. While one fraction is being analyzed on the second-dimension column, a new fraction is being collected in another loop connected to the same valve (or by using a second valve). One popular configuration employs a two-way 10-port switching valve, as illustrated in Figure 1. To construct an LC×LC system requires (at least) two columns and two pumping systems. Detection typically takes place after the second-dimension column (and not after the first dimension), so that "one-and-a-half" liquid chromatographs are needed to assemble one comprehensive two-dimensional one.

Figure 1
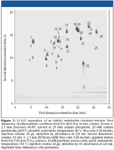
The result of a comprehensive two-dimensional separation is a series of many (for example, 100) fast second-dimension chromatograms. These usually are combined into a data matrix, which then can be displayed as a contour plot (see Figure 2) or color plot that displays peak intensity as a function of the retention times in the first and second dimensions (3). In truly comprehensive separations, such a two-dimensional chromatogram is representative for the entire sample.

Figure 2
There are two criteria for calling a two-dimensional separation "comprehensive" (4). One is that every bit of the sample is being analyzed in both dimensions, without anything going to waste. The second is that the resolution obtained in the first dimension be maintained, despite cutting the chromatogram in a limited number of fractions. The first criterion is met by using a valve-switching system like that shown in Figure 1 (5). The second criterion is more difficult to meet. It has long been assumed (6) that about four "cuts" would need to be taken along every first-dimension peak. Recent results from Tanaka's group (7) suggest that two cuts per peak can be optimal.
The questions that will be addressed in this communication involve the value of LC×LC in practice. Why would one want to employ the technique, given that the equipment is more complicated (an additional LC pumping system is required) and that a valve-switching system and dedicated software are needed? The answer is twofold, and it will be provided in the next two sections. One deals with the peak capacity that can be obtained from comprehensive two-dimensional chromatographic separations. In the second one, the concept of sample dimensionality will be discussed and we will see how structured, readily interpretable two-dimensional chromatograms can be obtained.
Peak Capacity in LC×LC
The peak capacity of any separation can be defined as the number of peaks that can be separated with a specific resolution. The assumption is that the peaks are spread equally throughout the chromatogram. While this is quite feasible (for example, the separation of a homologous series in one-dimensional chromatography), it is usually not realistic when the separation of very complex mixtures with GC×GC or LC×LC is considered. Nevertheless, peak capacity is a very useful measure to indicate the quality of a separation system. The higher the peak capacity, the greater the separation potential.
The peak capacity in isocratic and in gradient-elution liquid chromatography can be estimated using conventional and more-original concepts (8–10). As a rough summary, one-dimensional LC allows the separation of 50 or perhaps 100 (equally resolved) peaks in one experiment. Using gradient elution this number might be increased to hundreds and it can even exceed 500 (11). To get to these high numbers, (very) slow gradients are used. Working at very high pressures, elevated temperatures, or with the best available (long and efficient) monolithic columns all help (12). For example, raising the maximum pressure from 400 to 1000 bar (from 40 to 100 MPa) can enhance the peak capacity by some 20%. However, all these important (and welcome) developments in LC do not result in a quantum leap in the available peak capacity.
In contrast, such a great leap forward can be realistically expected from LC×LC. Key to this treasure is that the peak capacities in the two dimensions can be multiplied (Figure 3). A realistic estimate for the peak capacity in the first dimension (slow separation) is a few hundred; a realistic number for the (fast) second dimension is between 10 and 20. The result is a peak capacity in the thousands, which can be achieved with standard commercially available columns and instruments (13).

Figure 3
Sample Dimensionality: Structured Chromatograms
Although we mortals are in no position to dictate the exact positioning of all peaks in very complex two-dimensional chromatograms, we do have significant possibilities to set the separations to our hands. The concept of sample dimensionality (14) is extremely useful in this context. A dimension of a sample can be seen as a property that sets the molecules apart from each other. For example, in a homologous series, the number of methylene groups would be the unique feature differentiating between molecules, and a solution of n-alkanes can be seen as a one-dimensional sample. In triglycerides, the number of unsaturations might be another dimension. However, to uniquely define a molecule the position of the double bond is relevant also, so that a sample of triglycerides can be more than two-dimensional. If we manage to align the most important dimensions of the sample with the separation mechanisms, we can obtain structured separations. For triglycerides, this has been well demonstrated by Dugo and colleagues (15).
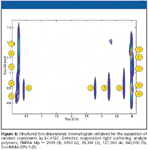
A field in which the concept of sample dimensionality can be applied elegantly is that of synthetic polymers. The dimensionality of a sample of a homopolymer with fixed end-groups is one (molecular weight or degree of polymerization). If the end groups vary, the dimensionality can be seen as two (it could be higher, depending upon the variability between the different end groups). In random copolymers (with fixed end-groups), the sample dimension is two. In the latter case, highly structured chromatograms can be obtained if we can separate the sample according to chemical composition in one dimension and according to molecular weight in the other dimension. This is demonstrated in Figure 4, where gradient-elution LC and size-exclusion chromatography (SEC) have been used as the separation mechanisms for the respective purposes.

Figure 4
Orthogonality
In the specific case of Figure 4, the separation dimensions are truly orthogonal. The positioning of the peaks along the horizontal axis is only affected by the chemical composition; the positioning along the vertical axis is determined by the size of the molecules. Such orthogonal separations are the best one can hope for in LC×LC. They allow the entire "separation plane" to be filed with peaks, implying that the entire peak capacity can — in principle — be used. Also, the interpretation of comprehensive two-dimensional chromatograms is much easier if the separation dimensions are well defined and orthogonal, as is demonstrated clearly by Figure 4. However, orthogonal separation mechanisms — while highly desirable — are not a prerequisite for performing successful two-dimensional separations. In many cases, the mechanisms might not be orthogonal, but well-structured two-dimensional separations can be obtained that cannot be separated in one dimension.
Obstacles and Outlook
One of the main limitations of LC×LC is the availability of suitable detectors. To some extent, this problem is the same as that encountered in one-dimensional LC. Liquid chromatographers have learned to deal with this problem over the years. However, the problems are aggravated in LC×LC, because the sample is diluted twice (in each column) (13) and because the peaks are eluted quickly. The sensitivity of UV detection is highly dependent upon the nature of the analytes, which makes it difficult to interpret two-dimensional chromatograms of very complex samples. The response of an evaporative light scattering detector is more universal, but the inherent nonlinearity of this detector is a severe complicating factor. The charged-aerosol detector appears promising.
The detection problem can be reduced if we are able to effectively focus the analytes between the first- and second-dimension separations. In GC×GC, this is achieved easily by creating (and moving) a cold spot ("cryogenic modulation"). In LC×LC, we have nothing with the same elegance, effectiveness, and universal applicability. However, in a number of cases effective focusing can be achieved. For example, proteins or peptides can be separated with SEC in the first dimension and reversed-phase LC in the second. The aqueous mobile phase used in the first dimension is a very weak eluent in reversed-phase LC, causing effective focusing at the top of the second-dimension column.
The availability of suitable software for data acquisition, data manipulation ("demodulation"), display, and quantitative analysis is still a bit of a bottleneck, but one that now appears to be fading rapidly. Several vendors now offer software packages that perform the most important tasks adequately. This allows scientists to focus on the more important data-interpretation aspects. A good deal of effort is now being devoted to the development and application of advanced data-analysis strategies ("chemometrics") to comprehensive two-dimensional chromatography. One eye-catching example is the quality control of natural products, such as traditional Chinese medicines, using fingerprints obtained by LC×LC.
Another important application of LC×LC can be in the search for biomarkers, based upon approaches from systems biology. This is one example in which LC×LC–MS is obviously needed. There are no fundamental problems associated with the realization of such advanced systems. However, practical problems emerge from the required (scanning) speed and from the sheer amounts of data generated during each run.
Finally, having mentioned systems biology, it is worth mentioning that despite the great potential of LC×LC separating, for example, all proteins in the human proteome is still not within our grasp. We are starting to play with ideas for realizing comprehensive three-dimensional LC (LC×LC×LC). It is good to know that liquid chromatographers still have major challenges ahead of them.

Ronald E. Majors
Ronald E. Majors
"Sample Prep Perspectives" Editor Ronald E. Majors is business development manager, Consumables and Accessories Business Unit, Agilent Technologies, Wilmington, Delaware, and is a member of LCGC's editorial advisory board. Direct correspondence about this column to "Sample Prep Perspectives,"LCGC, Woodbridge Corporate Plaza, 485 Route 1 South, Building F, First Floor, Iselin, NJ 08830, e-mail lcgcedit@lcgc-mag.com
References
(1) J.B. Philillips, J. Xu, J.Chromatogr. 703, 327 (1995).
(2) F. Erni and R.W. Frei, J.Chromatogr. 149, 561 (1978).
(3) D.R. Stoll, J.D. Cohen, and P.W. Carr, J.Chromatogr., A 1122, 123 (2006).
(4) P.J. Schoenmakers and P. Marriott, J. Beens, LCGC Eur. 16, 335 (2003).
(5) A. van der Horst and P.J. Schoenmakers, J.Chromatogr., A 1000, 693 (2003).
(6) M.R. Schure, Anal.Chem. 71, 1645 (1999).
(7) K. Horie, H. Kimura, T. Ikegami, A. Iwatsuka, N. Saad, N., O. Fiehn, and N. Tanaka, Anal.Chem. 79, 3764 (2007).
(8) D.R. Stoll, X. Li, X. Wang, P.W. Carr, S.E.G. Porter, and S. C. Rutan, J.Chromatogr., A 1168, 3 (2007).
(9) U.D. Neue, J.Chromatogr., A, in press.
(10) X. Wang, D.R. Stoll, P.W. Carr, and P.J. Schoenmakers, J.Chromatogr., A 1125, 177 (2006).
(11) Q. Luo, Y. Shen, K.K. Hixson, R. Zhao, F. Yang, and R.J. Moore, Anal.Chem. 77, 5028 (2005).
(12) J. Billen and G. Desmet, J. Chromatogr., A 1168, 73 (2007).
(13) P.J. Schoenmakers, G. Vivoì-Truyols and W.M.C. Decrop, J.Chromatogr., A 1120, 282 (2006).
(14) J.C. Giddings, J.Chromatogr., A 703, 3 (1995).
(15) P. Dugo, F. Cacciola, Tiina Kumm, G. Dugo, and L. Mondello, J.Chromatogr., A, in press.

Study Explores Thin-Film Extraction of Biogenic Amines via HPLC-MS/MS
March 27th 2025Scientists from Tabriz University and the University of Tabriz explored cellulose acetate-UiO-66-COOH as an affordable coating sorbent for thin film extraction of biogenic amines from cheese and alcohol-free beverages using HPLC-MS/MS.
Quantifying Microplastics in Meconium Samples Using Pyrolysis–GC-MS
March 26th 2025Using pyrolysis-gas chromatography and mass spectrometry, scientists from Fudan University and the Putuo District Center for Disease Control and Prevention detected and quantified microplastics in newborn stool samples.
Multi-Step Preparative LC–MS Workflow for Peptide Purification
March 21st 2025This article introduces a multi-step preparative purification workflow for synthetic peptides using liquid chromatography–mass spectrometry (LC–MS). The process involves optimizing separation conditions, scaling-up, fractionating, and confirming purity and recovery, using a single LC–MS system. High purity and recovery rates for synthetic peptides such as parathormone (PTH) are achieved. The method allows efficient purification and accurate confirmation of peptide synthesis and is suitable for handling complex preparative purification tasks.


