LC–MS/MS Techniques for Environmental Concerns
You don’t have to look far to find headlines such as “PFAS Chemicals in Drinking Water Prompts Restrictions” (1) or “Toxic Algae Discovered in Waterways off Lake Tahoe” (2). These two examples highlight key environmental concerns, and laboratories are feeling the demands to perform more of these tests. The first headline relates to the pollution from per- and polyfluorinated alkyl substances (PFASs) and the latter is attributed to the problems of microcystins and nodularins in water. This article will look into analytical workflows that can be applied to the testing of these “in demand” compounds.
Photo Credit: artjazz/Shutterstock.com

Phil Taylor, Sciex, Framingham, USA
You don’t have to look far to find headlines such as “PFAS Chemicals in Drinking Water Prompts Restrictions” (1) or “Toxic Algae Discovered in Waterways off Lake Tahoe” (2). These two examples highlight key environmental concerns, and laboratories are feeling the demands to perform more of these tests. The first headline relates to the pollution from per- and polyfluorinated alkyl substances (PFASs) and the latter is attributed to the problems of microcystins and nodularins in water. This article will look into analytical workflows that can be applied to the testing of these “in demand” compounds.
Per- and polyfluorinated alkyl substances (PFASs) (3) are used in a wide variety of industrial and household consumer products, such as carpets and furniture, food packaging, cookware, and in the suppression of fire. PFASs are aliphatic in their structure, containing one or more carbon atoms and with fluorine atoms in place of the hydrogen substituents. They are used in a vast number of products and industrial applications because their chemical stability and low reactivity properties make them highly resistant to degradation in aquatic environments.
Exposure (4) to PFASs can have adverse effects on humans and animals (5–6). Human exposure to PFAS residues has been implicated in the incidence of cancer, obesity, endocrine system disruption, and other adverse health effects. The high aqueous solubility of PFASs enables them to be easily transported and to bioaccumulate from a contaminated water source. The US Environmental Protection Agency (EPA) has established health advisory limits for selected PFASs in water; for example, perfluorooctanoic acid (PFOA) is limited to a presence of 70 ng/L (7). However, this limit is being challenged by environmental groups where there is a demand to lower the level, as concerns about PFASs become more prevalent in the public domain (1,2,7).
As there is an abundance of PFASs in the environment and humans are at risk of consuming them using contaminated drinking water, there is a requirement for accurate and precise low-level quantitation of these substances in the environment. A primary analytical challenge to this assay is the prevention and reduction of background PFASs originating from the LC system and contamination during sample collection and preparation.
Analysis of PFASs
A robust quantitative analytical method has recently been developed for the quantitation of PFASs in water samples, using liquid chromatography tandem mass spectrometry (LC–MS/MS) with largeâvolume direct injection and solidâphase extraction (SPE) (8).
Experimental: The first stage in this workflow was for all fluoroethylene polymer (FEP) tubing on the LC pumps and degasser to be replaced with PEEK tubing with similar internal and external dimensions as a means of reducing the background contamination of any PFASs present. This was followed by installing a 30 × 2 mm, 5-μm Luna C18(2) column (Phenomenex) between the pump mixing chamber and the column. This column served as a delay or hold-up column to isolate PFAS contamination originating from the pumps and eluents.
Chromatographic separation was performed using a 100 × 3 mm, 3-μm Gemini C18 HPLC column (Phenomenex) with a flow rate of 0.6 mL/min. The column was heated to 40 °C. A PALâHTCâxt autosampler (CTC Analytics) with dynamic load-wash (DLW) was modified by replacing all FEP tubing from the rinse solvent lines, the needle seal, and the sample holding loop with PEEK or stainless steel. The autosampler syringe and sample holding loop were rinsed with methanol and 1:1 methanol–acetonitrile between samples.
A 1-mL aliquot of a water sample was added to a 2-mL clear glass autosampler vial with a polyethylene septum cap containing 0.65 mL of methanol and a mix of surrogate standards at a final concentration of 50 ng/L. The final concentration of methanol in the diluted sample was 40%, and standards, blanks, and quality control samples were all prepared at the same concentration. The autosampler was modified to inject 950 μL of the diluted samples and standards. The gradient for the large volume injection method was run at a flow rate of 0.6 mL/min and was as follows: step 0: 0.00 min, 90% A, 10% B; step 1: 1.50 min, 35% A, 65% B; step 2: 8.00 min, 5% A, 95% B; step 3: 8.10 min, 1% A, 99% B; step 4: 12.00 min, 1% A, 99% B; step 5: 12.50 min, 90% A, 10% B; end: 15.50 min. Water with 20 mM ammonium acetate was used as the “A” solvent, and methanol was the “B” solvent.
After the addition of surrogate standards and a simple dilution with methanol, 950 μL of the sample was injected directly onto the C18 column. For MS/MS detection a Triple Quad 5500 system (Sciex) with a Turbo V source and ESI probe was used for analysis in negative polarity. The calibration range for the majority of PFASs using this LVI method was 1–200 ng/L.
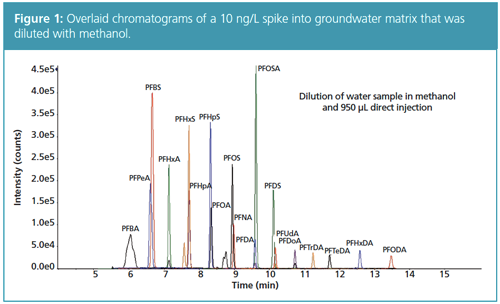
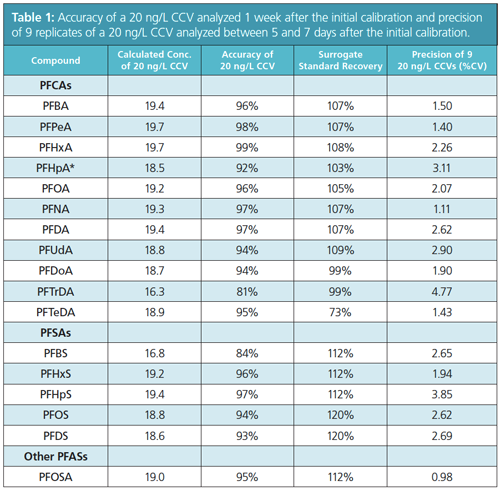
Results: Figure 1 shows the chromatographic performance for this method in groundwater. This direct aqueous method delivered good precision and reproducibility, which is reflected in the %CV values in Table 1. The %CV of
all the PFASs was <5% and the recovery of the surrogate was within 73–120%.


This LVI direct injection method has the advantages of minimal sample preparation and fewer steps to introduce lab-based PFAS contamination. With the growing need for PFAS analysis of environmental samples, this versatile method will be useful for laboratories aiming to evaluate growing lists of PFASs.
Microcystins and Nodularins
Microcystins (MC) and nodularins (NOD) are toxins produced by cyanobacteria in saline and fresh waters. MC and NOD can be produced in vast quantities during algal blooms, causing widespread and hazardous contamination to drinking water and surface water, including water used in farming practices (9). They are released into the aquatic environment during the cell death process and this occasionally leads to water consumption advice from the authorities (10). MC and NOD are primarily liver toxicants and toxicity varies by isoform with the MicrocystinâLR (leucine–arginine variant) thought to be the most harmful. Therefore, the quantification of individual isoforms is necessary to ensure safe drinking water. A new practical method for analysis of MC and NOD was recently released that enables comprehensive analysis in just 11 min. The workflow delivers the low levels of sensitivity required in the water matrices typical of MC and NOD testing.
Analysis of MC and NOD
Experimental: A highly sensitive, accurate, and precise LC–MS/MS method was developed for the analysis of eight MC and two NOD isoforms in water using a QTRAP 4500 system (Sciex) with Turbo V source and an ExionLC AC system (Sciex). Chromatographic separation was achieved under gradient conditions using a 100 × 2.1 mm, 2.6-μm Kinetex C8 column (Phenomenex) and flow rate of 0.500 mL/min. The mobile phases were water (“A”) and acetonitrile (“B”), both modified with 0.1% formic acid. The gradient used to achieve separation was as follows: step 0: 0.00 min, 95% A, 5% B; step 1: 0.5 min, 95% A, 5% B; step 2: 6.0 min, 40% A, 60% B; step 3: 7.0 min, 5% A, 95% B; step 4: 9.0 min, 5% A, 95% B; step 5: 9.1 min, 95% A, 15% B; end: 11 min. The column oven was set to 40 °C and the injection volume was 20 μL. The autosampler rinse program was modified to reduce sample carryover; rinse solvent was 60:20:20 isopropanol–methanol–acetonitrile using a rinse volume of 2 mL and dip time of 8 s.
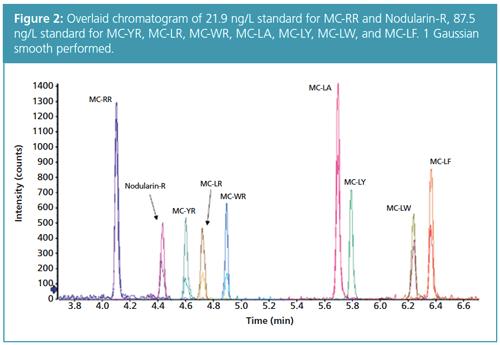
Using the developed gradient program, baseline separation was achieved for all compounds with excellent peak shape (Figure 2).

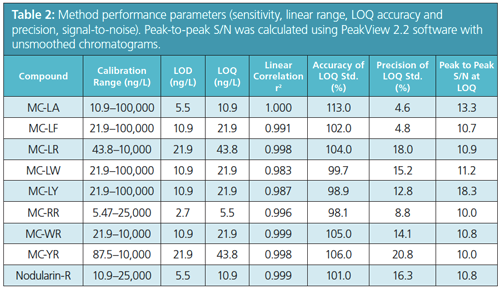
The gradient is 15 min shorter than the program described in EPA Method 544, resulting in considerable time saving, but still maintaining baseline separation. The method showed approximately three orders of linear dynamic range for all compounds with linearity maintained up to 25,000 ng/L for MC-RR and Nodularin-R, and up to 100,000 ng/L for MC-LA, MCâLF, MCâLW, and MC-LY. Previous analysis showed that MC-LR and MC-YR were linear up to 40,000 ng/L.
Baseline chromatographic separation was achieved during an 11 min gradient run. Analysis of standard samples showed LOQ values from 5.5–44 ng/L. These LOQ values were significantly below the US EPA drinking water advisory levels, suggesting that the direct analysis of water samples is practical.
Conclusions
The development of new methods with robust LC–MS/MS systems has brought highly sensitive and accurate assays to routine water testing laboratories for analyzing PFASs, microcystins, and nodularins. The requirement to analyze environmental samples for these compounds is, for the foreseeable future, likely to increase for routine testing laboratories. Furthermore, as more instances of contamination occur, there will be a growing awareness of these environmental concerns, which may lead to a review of acceptable presence levels for PFASs, microcystins, and nodularins.
References
- http://www.abc.net.au/news/2017-08-09/katherine-to-face-water-restrictions-due-to-pfas-chemicals/8789576
- https://www.usnews.com/news/best-states/california/articles/2017-08-31/toxic-algae-discovered-in-waterways-off-lake-tahoe
- R.C. Buck et al., Integr. Environ. Assess. Manag.7(4), 513–541 (2011).
- https://www.epa.gov/pfas/basic-information-about-and-polyfluoroalkyl-substances-pfass
- J.M. Braun, A. Chen, M.E. Romano, A.M. Calafat, G.M. Webster, K. Yolton, and B.P. Lanphear, Obesity 24, 231−237 (2016).
- V. Barry, A. Winquist, and K. Steenland, Environ. Health Perspect. 121(11–12), 1313–1318 (2013).
- https://stateimpact.npr.org/pennsylvania/2017/08/17/pa-environmental-regulators-to-consider-health-limits-for-pfoa/
- S. Roberts, K.C. Hyland, C. Butt, S. Krepitch, and E. Redman, Sciex technical note, document no RUO-MKT-02-4707-A (2017). Available from: https://sciex.com/Documents/tech%20notes/PFAS-water-samples.pdf
- J.C. Makarewicz, L. Boyer, T.W. Lewis, W. Guenther, J. Atkindson, and M. Arnold, J. Great Lakes Res.35, 83–89 (2009).
- K.A. Loftin, J.L. Graham, E.D. Hilborn, S.C. Lehmann, M.T. Meyer, J.E. Dietze, and C.B. Griffith, Harmful Algae56, 77–90 (2007).
Phil Taylor is the Global Marketing Manager, Food, Environment, and Forensic at Sciex, Framingham, USA.
E-mail:Philip.Taylor@sciex.comWebsite: www.sciex.com

New Method Explored for the Detection of CECs in Crops Irrigated with Contaminated Water
April 30th 2025This new study presents a validated QuEChERS–LC-MS/MS method for detecting eight persistent, mobile, and toxic substances in escarole, tomatoes, and tomato leaves irrigated with contaminated water.
University of Tasmania Researchers Explore Haloacetic Acid Determiniation in Water with capLC–MS
April 29th 2025Haloacetic acid detection has become important when analyzing drinking and swimming pool water. University of Tasmania researchers have begun applying capillary liquid chromatography as a means of detecting these substances.

.png&w=3840&q=75)

.png&w=3840&q=75)


.png&w=3840&q=75)


.png&w=3840&q=75)


