LC–MS Sensitivity: Practical Strategies to Boost Your Signal and Lower Your Noise
LCGC Europe
Liquid chromatography–mass spectrometry (LC–MS) has become the preferred analytical technique for many challenging assays based on its selectivity, sensitivity, and broad applicability to compounds of varying polarity. Despite its advantages, the complexity of LC–MS systems often leaves analysts struggling to meet method detection limits. In this instalment of “Column Watch”, several strategies will be discussed to improve method sensitivity through the reduction of contaminants, the careful selection of LC method conditions, and the optimization of MS interface settings. By understanding the relationship between these parameters and ionization efficiency, analysts can enhance their signal-to-noise ratio and realize the hidden potential of their LC–MS.
Liquid chromatography–mass spectrometry (LC–MS) has become the preferred analytical technique for many challenging assays based on its selectivity, sensitivity, and broad applicability to compounds of varying polarity. Despite its advantages, the complexity of LC–MS systems often leaves analysts struggling to meet method detection limits. In this instalment of “Column Watch”, several strategies will be discussed to improve method sensitivity through the reduction of contaminants, the careful selection of LC method conditions, and the optimization of MS interface settings. By understanding the relationship between these parameters and ionization efficiency, analysts can enhance their signal-to-noise ratio and realize the hidden potential of their LC–MS.
The term “sensitivity” can have several meanings in mass spectrometry (MS) that are often used interchangeably. Sensitivity may be defined as the change in signal for unit change in concentration of an analyte (such as the slope of the calibration curve) (1). More commonly, it is used to reference the magnitude of the signal produced by the analyte in the MS detector. In this latter usage, MS sensitivity is often used to compare detectors.
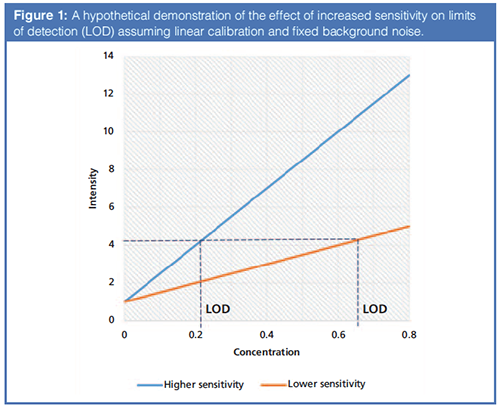
Fundamentally, the ability of a detector to provide quantitative data is a function of the signal-to-noise ratio (S/N) for an analyte. The limit of detection (LOD) is determined from the analyte S/N and is the lowest concentration of a substance where its signal can be distinguished from system noise (2). As shown in Figure 1, the higher the sensitivity of the MS system, the greater the value of S/N for a given method LOD if background noise remains constant. Therefore, improvements in sensitivity can occur through manipulation of S/N. MS optimization, sample pretreatment strategies, mobile-phase composition, and LC column characteristics are all integral to ionization efficiency and will improve analyte signal when optimized. Likewise, limiting contaminants that contribute to signal suppression or adduct formation may also enhance response.
MS Optimization
In liquid chromatography–mass spectrometry (LC–MS), sensitivity directly relates to the effectiveness of producing gas-phase ions from analytes in solution (ionization efficiency) and the ability to transfer them from atmospheric pressure to the low pressure zone of the MS system (transmission efficiency) (3). The optimization of ionization and transmission efficiency is dependent on the LC method parameters and the target analyte or analytes. To make the appropriate adjustments, it is necessary to have a basic understanding of the mechanisms taking place within the MS source.
Electrospray ionization (ESI) is one of the most popular ionization techniques; therefore, it will be the focus of this column instalment. It is important to note, however, that optimization of the source parameters is necessary regardless of the ionization mode selected. As the LC mobile phase flows into the sample capillary, positive and negative ions are separated based on the polarity chosen. In positive ESI, the negative ions are neutralized on the capillary wall, and the positive ions continue with the mobile phase to the capillary tip where the charged analytes accumulate into a droplet. Under the influence of an applied voltage, a Taylor cone is formed (4). Electrostatic repulsion causes the cone to break up into small, electrically charged droplets, which then travel towards the sampling orifice under the guidance of the applied potential difference between the capillary tip and the sampling plate. As the tiny droplets progress towards the orifice, the solvent evaporates with the aid of drying gas and heat, causing the droplet surface area to decrease and an increase in charge density. Ultimately, repulsive forces overcome the droplet surface tension and it explodes into even smaller droplets. The process repeats itself until the droplets are so small that gas-phase ions are emitted (5). The cloud of ions formed is known as the ion plume.
Choosing the appropriate polarity is the first step in developing a sensitive LC–MS method. The capillary polarity is selected to match the charge of the analytes of interest. Typically, basic analytes will ionize most efficiently in positive ion mode by accepting a proton (M+H)+, while acidic analytes will produce the strongest signal in negative ion mode by donating a proton (M-H)-. However, it can be difficult to predict the best polarity mode for more-complex molecules. In addition, analyte behaviour and response varies by instrument platform. Therefore, it is beneficial to screen analytes using both polarity modes during initial method development or when transferring an existing method to a new instrument (6).
Ionization efficiency is strongly influenced by flow rate, mobile-phase composition, and the physicochemical properties of the target analytes. The capillary voltage setting is dependent on the analytes, eluent, and flow rate and can have a significant impact on method reproducibility. The applied potential difference between the capillary tip and sampling plate is responsible for maintaining a stable and reproducible spray (7). Problems with variable ionization and precision can arise if the capillary voltage is set incorrectly. Optimal nebulizing gas flow and temperature are also eluent dependent. The nebulizing gas constrains the growth of the droplet while charge accumulates and also affects the size of the droplets emitted from the capillary. The nebulizing gas flow and temperature should be increased for faster LC flow rates or when using highly aqueous mobile phases. Similarly, drying gas flow and temperature can be critical for effective desolvation of the LC eluent and the successful production of gas-phase ions. As a caution, when analyzing thermally labile analytes, care must be exercised to prevent their degradation in the source.
The location at which gas-phase ions are produced within the ionization source is important for optimal transmission into the MS system. The size of the ion plume is dependent on the number of fission events required to emit gas-phase ions and its distance from the sampling orifice. Sampling of the ion plume can be optimized by adjusting the position of the capillary tip in relation to the orifice based on the LC flow rate. At faster flow rates, the capillary tip should be placed further from the sampling orifice to allow for adequate desolvation and an increased number of fission events. Although extending the distance will allow for an increased number of gas-phase ions to be produced, repulsive forces will also increase proportionally, causing the size of the ion plume to expand and the density of gas-phase ions to be reduced. As a result, the number of ions entering the sampling orifice could decrease, causing a drop in signal intensity (3). At slower flow rates, smaller droplets are formed, allowing the capillary tip to be placed closer to the sampling orifice. Smaller droplets desolvate more easily and require fewer fission events, reducing the impact of repulsive forces and inhibiting the size of the ion plume. The decreased distance between the capillary tip and sampling orifice increases ion plume density and improves analyte ionization efficiency and transmission (3).
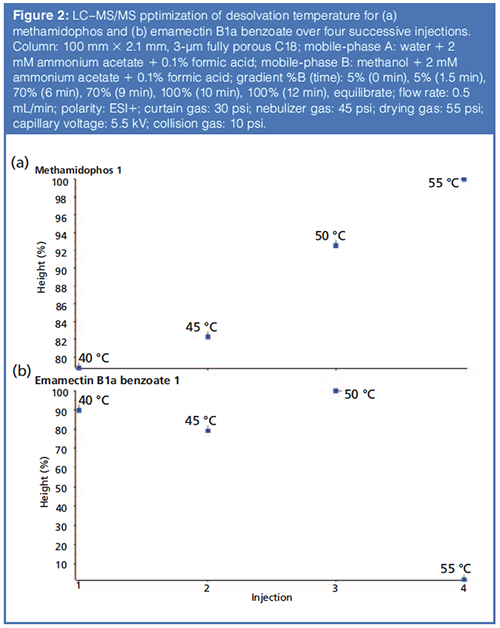
Optimization of the ionization source parameters described above could potentially bring sensitivity gains of two- to threefold as demonstrated by Szerkus and colleagues for the analysis of 7-methylguanine and glucuronic acid in urine (8). When optimizing the source conditions, it is important to use the intended LC mobile phase and flow rate. One method of optimization is to inject a standard solution several times and alter a specific source parameter stepwise with each injection. Figure 2 demonstrates this process for the evaluation of optimal desolvation temperature for two pesticides: methamidophos and emamectin B1a benzoate. A 20% increase in response for methamidophos was achieved by increasing the desolvation temperature from 400 °C to 550 °C. In contrast, emamectin benzoate B1a experiences complete signal loss if the desolvation temperature is increased beyond 500 °C because of the thermal lability of that compound. Alternatively, source conditions may be optimized by teeing a constant flow of analyte into the LC eluent and monitoring the analyte TIC. This technique allows for adjustments to be made on the fly. Methods using gradient elution of multiple compounds should be optimized by estimating the organic concentration at the time of elution. Although this step can be overwhelming, the process can be simplified by concentrating efforts on only critical or low intensity analytes.
Sample Pretreatment
Sample pretreatment is an essential part of the LC–MS analytical workflow, particularly when analyzing complex samples containing target analytes at low concentrations. Removal of nontarget sample components can minimize matrix interferences and improve the S/N ratio for the analytes of interest. Matrix compounds coeluted with a target analyte may cause suppression or enhancement of the analyte signal; these interferences are known as matrix effects. Matrix effects often manifest as a loss in MS sensitivity or specificity and are prevalent in ESI because of the potential for charge competition on the droplet surface prior to emitting gas-phase ions. As an alternative, atmospheric pressure chemical ionization (APCI) may be employed if the analytes of interest are thermally stabile and of moderate polarity (1). In APCI, the LC eluent is completely evaporated into a gas before ionization by the applied voltage of the corona needle. The ionized mobile-phase vapour then reacts with the analyte molecules to produce charged ions. Matrix effects tend to be less extensive in APCI since ions are produced through gas-phase reactions instead of liquid-phase reactions (9).
Various sample preparation strategies are available to extract target analytes from potential interfering matrix components. The appropriate technique is dependent on the sample matrix, sample volume, target analyte concentration, and analyte physicochemical properties. If the sample is clean and known to contain high concentrations of the target analyte, simple filtration and dilution is a quick and convenient way to reduce the concentration of potential interferences. On the other hand, complex samples known to contain low target analyte concentrations will require a more rigorous extraction procedure to improve signal intensity. Although more stringent sample preparation procedures may not be desirable because of the cost and time investment required, injecting cleaner samples will decrease the likelihood of matrix effects from endogenous interferences while simultaneously increasing analyte response and instrument reproducibility.
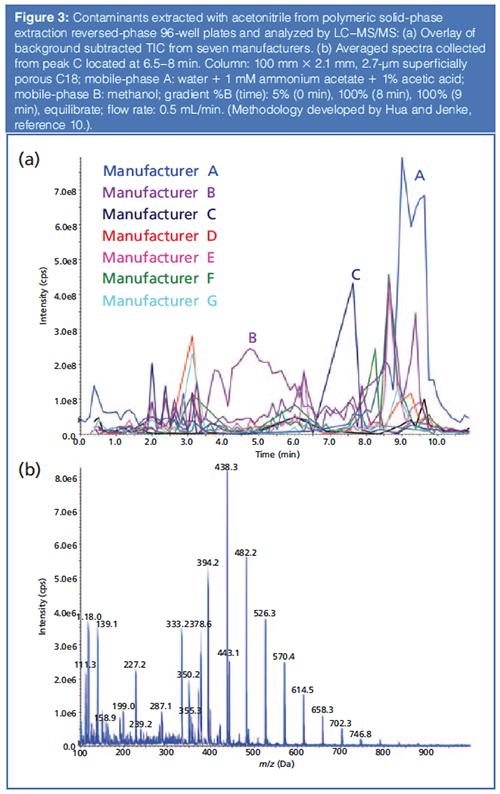
Regardless of the sample preparation technique chosen, it is important to consider that matrix effects can result from the presence of endogenous or exogenous substances. Whereas endogenous constituents are already present in the sample (proteins, lipids, pigments, and so forth), exogenous compounds are introduced into the sample during the sample pretreatment process. These compounds can leach from plastics used in centrifuge tubes, well plates, and pipette tips and may include by-products and residues from the manufacturing processes (for example, molding agents, plasticizers, stabilizers, and releasing agents). The amount and type of contaminants varies from manufacturer to manufacturer, as shown in Figure 3(a). In this experiment, contaminants extracted from polymeric solid-phase extraction (SPE) reversed-phase 96-well plates were compared for seven manufacturers. The extracts were analyzed by LC–MS, and the resulting data were background subtracted to remove contributions from the solvent and the analytical column. An overlay of the resulting chromatograms shows the presence of multiple chemical contaminants between the various manufacturers. The spectra for polyethylene glycol (PEG) was clearly identified in manufacturer C based on the series of repeating ions separated by 44 Da (Figure 3[b]).
Other sources of exogenous chemicals include glassware (especially when cleaned with detergents), the use of non-MS-grade solvents and additives, or careless work practices that can introduce chemicals from the skin or surrounding environment. Without appropriate laboratory procedures and careful screening of sample pretreatment products, it is possible to inadvertently introduce contaminants into a sample. If samples are subjected to a concentration step, a decrease in S/N ratio may be observed, because both analytes and contaminants will be concentrated (9).
Mobile-Phase Composition
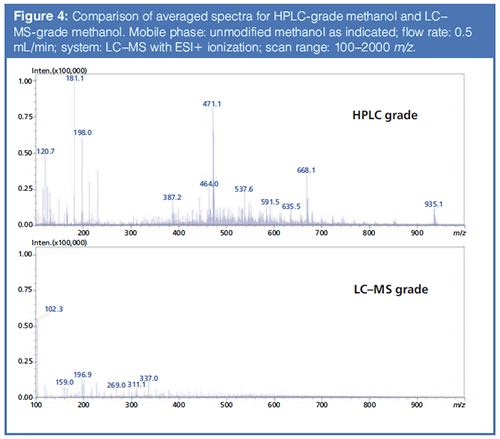
The mobile phase plays a key role in LC–MS sensitivity by influencing the retention and ionization of target analytes. The use of high-purity solvents and additives is of utmost importance to prevent unwanted adduct formation and increased MS background. Similarly, only ultrapure water from a water purification system or bottled water suitable for LC–MS should be used for mobile-phase preparation. LC–MS spectra collected for MS-grade and HPLC-grade methanol showed significantly increased impurities in the HPLC-grade methanol, particularly in the low-molecular-weight ranges common for small-molecule analysis (Figure 4). It is apparent from this data how the use of lower grade solvents could contribute to reduced sensitivity and convoluted spectra, making accurate quantitation or spectra interpretation difficult. Mobile phases should be stored in borosilicate glass containers and “topping off” solvents should be avoided to prevent the accumulation of contaminants.
The incorporation of volatile buffers and acids into the mobile phase enables control over the ionization state of the target analytes so that retention can be manipulated. Analyte retention affords the LC–MS analyst several advantages. First, increased retention of analytes means a higher organic solvent concentration is required to elute the analyte from the column during gradient LC. It has been shown that droplets with a higher organic concentration are desolvated more efficiently in the MS source, leading to improved MS sensitivity (11). Second, greater chromatographic selectivity makes it possible to avoid coeluted matrix effects that can be detrimental to analyte response. Areas of retention and matrix suppression can be monitored chromatographically by simultaneously infusing the analyte post column while performing an LC injection of an extracted blank matrix sample through the analytical column (12). Areas of matrix suppression are characterized by a decrease in analyte signal. In this way, analyte retention can be adjusted to avoid zones of significant suppression in the chromatogram.
Mobile-phase buffers and acids also affect ionization efficiency. This statement is especially true for ESI because it is susceptible to the reduction of detector response because of competition for ionization. To reduce the likelihood of buffer-induced suppression, concentrations should generally be kept to a minimum. Alternatively, mobile phases containing formic acid can minimize unwanted metal adducts. The excess in protons provided by the acid drives the majority of ion formation to the protonated molecule [M+H]+, resulting in an overall improvement in response since it would no longer be distributed across multiple charged species (13).
Enhancements in ionization efficiency have been observed by donating protons in the case of an acid modifier in positive-ion mode or by accepting protons in the case of a basic modifier in negative-ion mode. The latter was demonstrated for the negative ionization of two neutral estrogens, estrone and estriol, where their response triples when they are prepared in diluent containing 0.2% ammonium hydroxide compared to one that contains 0.2% acetic acid (14). Buffer salts containing ammonia (for example, ammonium formate or ammonium acetate) can increase the ionization efficiency of polar neutral compounds that cannot be ionized on their own by forming ammonium adducts. Ammonium salts can be used to prevent the formation of unwanted adducts by providing a constant supply of ammonium. For example, the LC–MS analysis of two cardiac glycosides, digoxin and digitoxin, is performed almost exclusively with ammonium formate modified mobile phases. Without ammonium formate, these compounds tend to form sodium adducts, which are difficult to fragment when analyzed by tandem MS (15).
LC Column Characteristics
The desire for increased LC–MS sensitivity has trended towards the implementation of highly efficient LC columns using smaller particles (sub-2 µm) in combination with reduced column diameters (≤ 2.1 mm). The introduction of superficially porous particles (SPPs) has allowed for increased efficiency while reducing system pressure when compared to fully porous particles (FPPs). High efficiency columns theoretically translate to improved sensitivity; however, LC–MS system extracolumn volume, ionization efficiency, and data sampling rates must be considered to fully realize the benefits.
The ability of a column to provide narrow chromatographic peaks is characterized as its efficiency (N), and is defined by its plate height (H). The efficiency of a peak is a function of its width and retention time. There are several processes that contribute to peak broadening inside and outside of the column. The injector, connecting tubing, and detector are all sources of extracolumn peak broadening.
Inside the column, eddy diffusion (A), longitudinal mass transfer (B), and mobile-phase and stationary-phase mass transfer (C) all contribute to peak dispersion. Collectively, these terms make up the van Deemter equation:
h = A + B/v + Cu [1]
where h is reduce plate height and v is the mobile-phase linear velocity (2). The van Deemter equation serves as a basis from which column performance is compared.
One way to increase column efficiency is by decreasing the particle size. Decreasing the overall peak width will cause an overall increase in peak height. Assuming that detector noise remains constant, taller peaks result in improvements in S/N and a boost in sensitivity. Additionally, highly efficient peaks are likely to be more resolved, reducing the likelihood that matrix interferences will impact ionization efficiency.
Smaller-particle columns also allow for the use of faster optimal linear velocities, and by extension, faster flow rates-without experiencing significant losses in efficiency. Unfortunately, because of the mechanisms that govern ESI, faster flow rates are generally a detriment to sensitivity since all eluent must be removed for successful formation of gas-phase ions. Although some manufacturers claim instrument compatibility with eluent flow rates up to 1 mL/min, the best performance for standard flow LC–ESI–MS systems has been reported to occur in the range of 10–300 µL/min (16). To accommodate small particles and their associated high linear velocities, 2.1-mm i.d. columns have become the preferred size for standard-flow LC–ESI–MS systems with optimal flow rates of 200–300 µL/min.
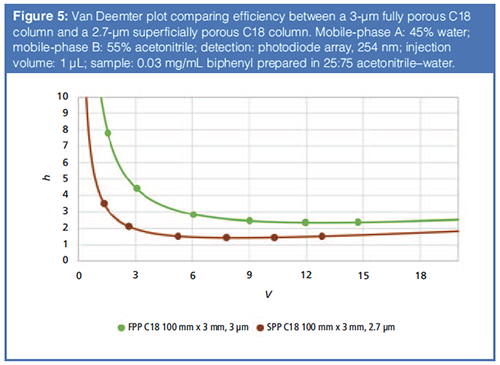
Changing the particle morphology is yet another way to improve column efficiency. Superficially porous particles are different from fully porous particles in that they have a thin porous shell surrounding a solid core. They are able to provide a significant increase in efficiency because of decreases in longitudinal diffusion (B) and eddy diffusion (A) that result from their narrow particle size distribution, reduced permeability, and rough surface exterior (17). Figure 5 compares the kinetic performance of a fully porous 3-µm C18 column to a superficially porous 2.7-µm C18 column of the same dimension using a van Deemter plot. The superficially porous column displays up to a 60% increase in efficiency over the fully porous particle.
Utilizing columns with narrow inner diameters minimizes analyte dilution, which takes place during the chromatographic separation. Because of on-column dilution, analyte sensitivity is inversely proportional to the square of the column inner diameter for concentration dependent detectors (18). Therefore, switching from a 2.1âmm i.d. column to a 0.3-mm i.d. column would theoretically increase sensitivity by a factor of 50, assuming the same volume of sample can be injected in both cases (19). Likewise, smaller inner diameter columns maintain the same linear velocity with reduced flow rates, which is beneficial in terms of ionization efficiency. The use of very slow flow rates (nanolitres per minute) has gained popularity for applications that require high sensitivity with limited sample amounts. At these flow rates, desolvation becomes so efficient that matrix effects actually cease to be a concern (1).
There are several implications when coupling high-efficiency, narrow-bore columns with mass spectrometry. The decrease in column inner diameter in conjunction with increased efficiency leads to substantial decreases in peak volume. Without minimizing extracolumn volume in the instrument, column performance will be compromised, making it difficult to realize any significant gains in sensitivity. Most extracolumn-volume contributions can be attributed to the LC system with MS contributions being negligible. However, the tubing used to interface the LC column to the MS system was found to be critical since this tubing is located post-column, where the focusing effects that compensate for band broadening do not occur (20). As a rule of thumb, the extracolumn volume should not exceed one-third of the peak volume of the narrowest peak in the chromatogram (21). For example, a 1.8-µm, 100 mm × 2.1 mm column produces a peak volume of approximately 8 µL (16). Therefore, the maximum extracolumn volume should be <3 µL to negate system related losses to efficiency.
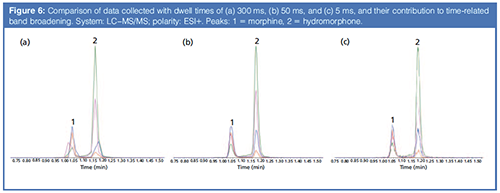
Smaller peak volumes also imply a fast acquisition rate is required to collect the minimum 15–20 data points across a peak needed for quantitative data. Time-related band broadening effects can result from insufficient dwell times and excessive data smoothing. In Figure 6, morphine and hydromorphone were analyzed using three scan rates (300 ms, 50 ms, and 5 ms). Artificial broadening is apparent for the 300-ms data whereas the 5-ms data show excessive noise that is characteristic of over sampling. Improper dwell time settings can have a profound impact on data quality and S/N ratios. When analyzing a large number of compounds, increased cycle times can be achieved by collecting data in selected-ion monitoring (SIM) or multiple reaction monitoring (MRM) mode to reduce the occurrence of time-related band broadening effects. In addition, most software allows for timed data collection, enabling data to be collected for a particular compound over a predefined window of time, extending the cycle time of a system.
Conclusion
Developing a sensitive and robust LC–MS method is a difficult task. Equipped with an understanding of the physicochemical properties of their target analytes, as well as the mechanisms and limitations of MS ionization and transmission efficiency, analysts can begin to make educated decisions to optimize overall response. The easiest and most effective way to improve sensitivity is through optimization of the ionization source conditions to ensure maximum production and transfer of gas-phase ions into the MS system. Careful selection of sample pretreatment procedures can reduce limits of detection by improving response and reducing interferences that could contribute to matrix effects and baseline noise. The use of efficient, narrow-bore LC columns, slower LC flow rates, and logical mobile phases can facilitate gains in signal intensity assuming extracolumn volumes are minimized and the data acquisition rates are appropriately set.
References
- R.K. Boyd, C. Basic, and R.A. Bethem, Trace Quantitative Analysis by Mass Spectrometry, 1st Edition (John Wiley & Sons Ltd, West Sussex, UK, 2008), pp. 242, 249.
- L.R. Snyder, J.J. Kirkland, and J.W. Dolan, Introduction to Modern Liquid Chromatography, 3rd Edition (John Wiley & Sons, Hoboken, New Jersey, USA, 2010), pp. 39–45, 157.
- J.S. Page, R.T. Kelly, K. Tang, and R.D. Smith, J. Am. Soc. Mass Spectrom.18, 1582–1590 (2007).
- G.I. Taylor, Proc. R. Soc. Lond. A.280, 383 (1964).
- M. Wilm, Mol Cell Proteomics10, 1–8 (2011).
- A. Kiontke, A. Oliveira-Birkmeier, A. Opitz, and C. Birkemeyer, PLoS One11, 1–16 (2016).
- T. Taylor, The LCGC Blog (7 November 2017).
- O. Szerkus, A.Y. Mpanga, M.J. Markuszewski, R. Kaliszan, and D. Siluk, Spectroscopy14, 8–16 (2016).
- R. Dams, M.A. Huestis, W.E. Lambert, and C.M. Murphy, J. Am. Soc. Mass Spectrom.14, 190–1294 (2003).
- Y. Hua and D. Jenke, J. of Chromatogr. Sci.50, 213–227 (2012).
- S.R. Needham, P.R. Brown, K. Duff, and D. Bell, J. Chromatogr. A869, 159–170 (2000).
- R. Bonfiglio, R.C. King, T.V. Olah, and K. Merkle, Rapid Commun. Mass Spectrom.13, 1175–1185 (1999).
- F. Klink, MS Solutions #3, Sepscience.com/Information/Archive/MS-Solutions.
- S. Lupo and T. Kahler, LCGC North America35, 424–433 (2017).
- J. Boertz, X. Lu, H. Brandes, S. Squillario, D. Bell, and W. Way, Poster Session presented at the Annual Meeting of the German Society for Mass Spectrometry (DGMS), Wuppertal, Germany (2015).
- S. Buckenmaier, C.A. Miller, T. van de Goor, and M.M. Dittman, J. Chromatogr. A 1377, 64–74 (2015).
- G. Guiochon and F. Gritti, J. Chromatogr. A1218, 1915–1938 (2011).
- J.P.C. Vissers, H.A. Classens, and C.A. Cramers, J. Chromatogr. A779, 1–28 (1997).
- J. Abian, A.J. Oosterkamp and E. Gelpi, J. Mass. Spectrom.34, 244–254 (1999).
- D. Spaggiari, S. Fekete, P.J. Eugster, J. Veuthey, L. Geiser, S. Rudaz, and D. Guillarme, J. Chromatogr. A1310, 45–55 (2013).
- A.J. Alexander, T.J. Waeghe, K.W. Himes, F.P. Tomasella, and T.F. Hooker, J. Chromatogr. A1218, 5456–5469 (2011).
Sharon Lupo joined Restek in 2010 as an LC Applications Chemist. While in this position, she focused on developing LC–MS/MS applications and providing LC technical support for the environmental, food safety, and clinical markets. Currently, Sharon is a Senior Scientist for the LC Product Development group and uses her market knowledge and analytical skills to develop new and innovative LC products. Sharon has nearly 20 years of experience in the field of liquid chromatography. Prior to joining Restek, she was a principal investigator, study director, and analytical chemist for good laboratory practice (GLP) and good manufacturing practice (GMP) regulated environmental, bioanalytical, and pharmaceutical studies.
David S. Bell is a director of Research and Development at Restek. He also serves on the Editorial Advisory Board for LCGC and is the Editor for “Column Watch”. Over the past 20 years, he has worked directly in the chromatography industry, focusing his efforts on the design, development, and application of chromatographic stationary phases to advance gas chromatography, liquid chromatography, and related hyphenated techniques. His undergraduate studies in chemistry were completed at the State University of New York at Plattsburgh (SUNY Plattsburgh). He received his Ph.D. in analytical chemistry from The Pennsylvania State University and spent the first decade of his career in the pharmaceutical industry performing analytical method development and validation using various forms of chromatography and electrophoresis. His main objectives have been to create and promote novel separation technologies and to conduct research on molecular interactions that contribute to retention and selectivity in an array of chromatographic processes. His research results have been presented in symposia worldwide, and have resulted in numerous peer-reviewed journal and trade magazine articles. Direct correspondence to: LCGCedit@ubm.com

Polysorbate Quantification and Degradation Analysis via LC and Charged Aerosol Detection
April 9th 2025Scientists from ThermoFisher Scientific published a review article in the Journal of Chromatography A that provided an overview of HPLC analysis using charged aerosol detection can help with polysorbate quantification.
Analyzing Vitamin K1 Levels in Vegetables Eaten by Warfarin Patients Using HPLC UV–vis
April 9th 2025Research conducted by the Universitas Padjadjaran (Sumedang, Indonesia) focused on the measurement of vitamin K1 in various vegetables (specifically lettuce, cabbage, napa cabbage, and spinach) that were ingested by patients using warfarin. High performance liquid chromatography (HPLC) equipped with an ultraviolet detector set at 245 nm was used as the analytical technique.
Removing Double-Stranded RNA Impurities Using Chromatography
April 8th 2025Researchers from Agency for Science, Technology and Research in Singapore recently published a review article exploring how chromatography can be used to remove double-stranded RNA impurities during mRNA therapeutics production.


