Know Your Sample: Size Matters
LCGC Asia Pacific
The past couple instalments of “Sample Preparation Perspectives” have looked at current trends in the field. Another recent trend is dried blood spot analysis and other analysis methods using minute sample amounts. This month we take a quick look at the role of sample homogeneity and the determination of sample size. Microsampling approaches, including dried blood spots, are discussed.
Douglas E. Raynie, Sample Preparation Perspectives Editor
The past couple instalments of “Sample Preparation Perspectives” have looked at current trends in the field. Another recent trend is dried blood spot analysis and other analysis methods using minute sample amounts. This month we take a quick look at the role of sample homogeneity and the determination of sample size. Microsampling approaches, including dried blood spots, are discussed.
Over the past several years, there has been a trend towards preparing increasingly smaller samples. In many cases, this approach was taken to demonstrate that extractions and sample handling procedures at the microscale and smaller is possible. With the current emphasis on bioanalytical and related technologies, even greater legitimacy is given to these approaches. Hence, the advent of dried-blood spot (DBS) analyses and other approaches. One approach to microsampling for bioanalyis is solid-phase microextraction (SPME), also referred to as bio-SPME, which is discussed here.
Sampling and Sample Heterogeneity
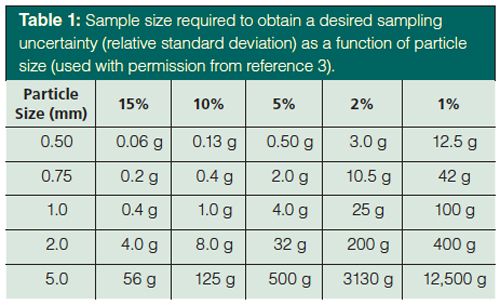
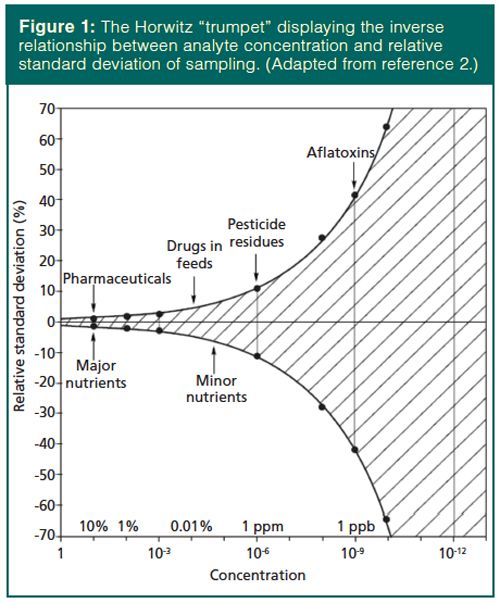
My thoughts as I heard of recent, somewhat controversial, developments in finger-prick sampling for blood tests were concern over the statistics of sample size and homogeneity. Most analysts are widely aware that the standard deviation of sampling and analysis increases with decreasing analyte concentration. Horwitz (1) evaluated interlaboratory validation studies and developed the “trumpet” shown in Figure 1. Although some bias is evident in every sampling protocol, when Meyer (2) presented the relationship between sampling and measurement uncertainty in 2002, she claimed that deviations from the Horwitz curve were caused by the sample matrix and the sample preparation procedure. Meyer provided the following advice: avoid all possible sources of contamination with trace analysis; use large volumes when possible since smaller volumes are difficult to handle and loss of sample material is less severe; mass-based measurements are often more reproducible than volumetric measurements; and use minimal sample handling steps with small-volume samples. Others have also demonstrated the relationship between sampling precision and sampling size. For example, Thiex and colleagues (3) reported the expected relative standard deviation from laboratory subsampling as a function of maximum particle size within the sample. As presented in Table 1 and substantiated by the Horwitz relationship, one cannot simultaneously have good sampling precision and small samples.


Moving beyond sample homogeneity concerns, the Royal Society of Chemistry’s Analytical Methods Committee explored representative sampling from an analytical and statistical viewpoint (4). They prefer the term “appropriate sampling” to “representative sampling”. They made this distinction because of the survey statistics definition of representative sample as “a sample for which the observed values have the same distribution as that in the population”, while the analytical definition states “a sample resulting from a sampling plan that can be expected to reflect adequately the properties of interest in the parent population”. This concept of adequacy in the analytical definition implies an inherent sampling bias and recognizes that in many, especially regulatory, cases analytical results are compared with a limit value. This limit value is often a “fitness for purpose”, which allows the use of analytical results to be used in decision making. Appropriateness of sampling can be improved by increasing the sample size or the number of samples.
Note that these relationships between sample size and heterogeneity are primarily derived from investigations of solid samples, including food and feeds. However, most microsampling applications are used in bioanalysis, especially those involving blood samples. For reasons of diffusion and turbulent flow, liquid samples can be assumed to be considerably more homogeneous than solid samples.
Overview of Microsampling in Bioanalysis, Including BioSPME
Along with analysis of DBS, paperâbased and more-conventional microfluidic approaches are gaining popularity. Such procedures are simple, inexpensive, and easy to use. A balance of hydrophobic and hydrophilic treatments controls fluid movement in these devices, resulting in their claimed reliability. One significant advantage of these approaches is their applicability outside of the laboratory, including nonclinical settings, though sample drying of blood spots can present a concern. Capillary microsampling allows collection of microlitre sample volumes along with subsequent steps such as separating plasma and serum. These approaches will be the subject of a future “Sample Preparation Perspectives” column.
Another sample preparation trend we’ve noticed is interest in SPME, especially since the lapse of patent protection of the initial products. In the case of conventional SPME, a stationary phase, usually a gas chromatography (GC)-type phase, is coated onto a fusedâsilica fibre encased in a syringe-needle device. The coated fibre is exposed to the sample by either immersion in a liquid sample or exposure to a vapour sample. The adsorbed sample is then desorbed either thermally in a GC inlet or via solvent rinsing into a liquid chromatograph.
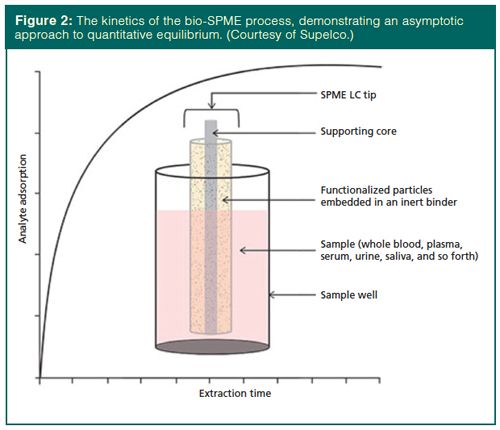
Biocompatible SPME (bio-SPME) is a microsampling approach for bioanalysis based on SPME, but featuring some key differences. With bio-SPME, functionalized silica particles are embedded in an inert binder that is coated or bonded onto metal fibres. The use of the binder minimizes interferences from biomacromolecules. BioâSPME is available in hypodermic needle and pipette tip formats. Like conventional SPME, the approach is not exhaustive and relies on an equilibrium between the analyte in the biofluid and the fibre materials. Figure 2 displays the kinetics of bioâSPME sampling, which are similar to conventional SPME. Initially, a rapid adsorption of the analyte onto the functionalized silica is observed, followed by an asymptotic approach to the equilibrium amount of analyte isolated.

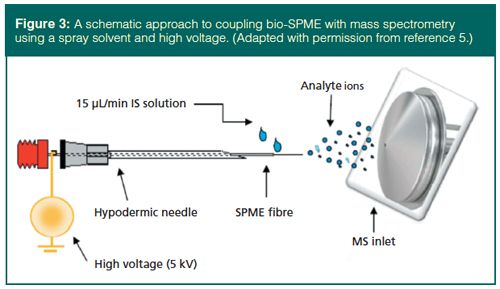
Two particular advantages of bioâSPME are of special interest. First, the device can be directly inserted into small animals for sampling at or near the point of interaction during physiological studies. This allows multiple analyses per animal, since the animal is not sacrificed, leading to more cost-effective studies and more reliable results since there are multiple analyses per animal. Relative standard deviations around 30% demonstrate the need to strongly consider the uncertainty considerations presented by Horwitz and discussed earlier. The second major advantage is the direct ionization of analytes on the bioâSPME fibres for mass spectrometry, as demonstrated in Figure 3 (5). This schematic shows the ionization occurring when the fibre and spray tip are sharp and a spray solvent carries the analyte into a high-voltage region to create an electric field between the bio-SPME device and the inlet to the mass spectrometer. Quantitative results are similar to other reports of bio-SPME and are 5–10× better than with DBS analysis. Spray solvent flow rates, positioning of the fibre, and other parameters are being optimized.

Conclusions
Microsampling for bioanalysis and other applications is gaining in popularity. One new technique in this area is the reapplication of the SPME approach, designed for biological applications. However, in all microsampling approaches, measurement uncertainty and sample homogeneity concerns must always be considered.
References
- W. Horwitz, L.R. Kamps, and K.W. Boyer, J. Assoc. Off. Anal. Chem.63, 1344–1354 (1980).
- V. Meyer, LCGC North Am. 20(2), 106–112 (2002).
- N. Thiex, L. Novotny, C. Ramsey, G. Latimer, L. Torma, and R. Beine, Guidelines for Preparing Laboratory Samples (Association of American Feed Association Officials, 2008).
- M.H. Ramsey and B. Barnes, Anal. Methods8, 4783–4784 (2016).
- S. Ahmad, M. Tucker, N. Spooner, D. Murnane, and U. Gerhard, Anal. Chem.87, 754–759 (2015).
“Sample Prep Perspectives” editor Douglas E. Raynie is an Associate Research Professor at South Dakota State University. His research interests include green chemistry, alternative solvents, sample preparation, high resolution chromatography, and bioprocessing in supercritical fluids. He earned his PhD in 1990 at Brigham Young University under the direction of Milton L. Lee.

Regulatory Deadlines and Supply Chain Challenges Take Center Stage in Nitrosamine Discussion
April 10th 2025During an LCGC International peer exchange, Aloka Srinivasan, Mayank Bhanti, and Amber Burch discussed the regulatory deadlines and supply chain challenges that come with nitrosamine analysis.
Polysorbate Quantification and Degradation Analysis via LC and Charged Aerosol Detection
April 9th 2025Scientists from ThermoFisher Scientific published a review article in the Journal of Chromatography A that provided an overview of HPLC analysis using charged aerosol detection can help with polysorbate quantification.


