It's All About Selectivity
LCGC North America
Learn how to use selectivity throughout the sample analysis cycle, from the sampling stage through data analysis and report generation.
In gas chromatography, selectivity is commonly thought about exclusively in the column stationary phase and sometimes extended to the detector. This installment of "Column Watch" explains how to incorporate selectivity throughout the sample analysis cycle, from the sampling stage through data analysis and report generation.
Many samples to be analyzed using gas chromatography (GC) are complex. There may be many analytes of interest to be separated, possibly at very low concentrations. Some of the analytes may be difficult compounds, meaning they may be thermally labile, active, or of too high molecular weight for analysis by GC. There also may be a high loading of matrix and the presence of matrix interferents. From sample collection to data analysis, there are many steps in the process. Of course, the final step is the reporting of the required information about a sample. To get reproducible and accurate results, it is important to think about and understand the sample first, and then to identify the steps to select the best techniques for the analysis.
In chromatography, when selectivity or being selective is mentioned, first thoughts are always directed toward the analytical column's stationary phase, especially in GC where this parameter has the biggest effect on the separation of analytes. In GC, the mobile phase, a gas, has little interaction with analytes, the matrix, or the stationary phase, and mainly serves to transport compounds down the column. However, each of the steps identified in the collection, analysis, and reporting of a sample can have selectivity applied to it. Figure 1 identifies some of these key steps. Although some of the steps involved in selectivity enhancement are often the same for gas and liquid chromatography, I will focus this discussion on considerations in GC.
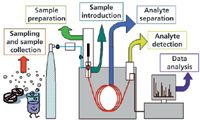
Figure 1: Steps in sample collection, preparation, and analysis.
Step 1: Sampling
The first and most important step in any separation is to determine how to collect a representative sample, enough for the analysis. One must consider the nature of the sample (gas, liquid, solid, or something in-between); the analytes (volatility, stability); and the location of the sample. It may be relatively easy to collect and return some samples to the laboratory for analysis, while in other cases, sample changes (such as oxidation, chemical breakdown, or chemisorption) can occur during the transport or storage process. It may be the case that the analysis needs to be performed in situ.
Selectivity can be considered in this first step — to selectively collect only the portion of the sample of interest with as little matrix as possible. Selectivity can be based on volatility, where only analytes within a certain volatility range are sampled, or on the nature of the analyte, where only target analytes with certain characteristics like polarity are collected. In a case where there is a high level of matrix interferents, a technique may be selected to avoid these; for example, a reversed-phase solid-phase extraction (SPE) sorbent may be used to concentrate organics and to avoid trapping water.
One technique for selectively sampling on site is thermal desorption; the thermal desorption tube packing material is selected to retain the target analytes and not the matrix. Solid-phase microextraction (SPME) and stir-bar sorptive extraction (SBSE) are other techniques where the phase can be selected for the analytes and not the matrix, and can be used on site.
Step 2: Sample Preparation
The aims of sample preparation can be to make the analytes of interest amenable to GC; to concentrate the analytes; and to remove matrix (if possible). Selectivity also can be considered at this step, to extract only the analytes and not the matrix. Again, selectivity can be based on volatility or the nature of the analytes.
For example, when using SPE, analysts can choose a phase that is selective for either the analytes or the matrix by thinking about the chemistry of the analytes and selecting a sorbent stationary phase that provides the best interaction to enable extraction of the analytes from the sample. Likewise, in SPME, SBSE, and liquid–liquid extraction (LLE), the solvent can be selective. Techniques like headspace and purge-and-trap sampling use volatility to selectively extract the analytes from the sample. Whereas parameters such as temperature are important to ensure the best extraction efficiency of target analytes, their effect on the coextraction of matrix components also must be considered. With dynamic headspace and purge-and-trap sampling, the selectivity of the trap also can be chosen to reduce the trapping of matrix coextractives.
Unfortunately, during sample preparation often there is the potential for the loss of analytes and the concentration of unwanted matrix. Given that there are many steps in the analysis of the sample where we can be selective for one over the other, it is important not to lose analytes at this step for the purpose of removing matrix; the latter can be examined again later on in the process. One important factor to consider in sample preparation is that the more individual steps used to isolate or concentrate the analytes of interest, the bigger the chance for analyte loss.
Step 3: Analyte Derivatization
Although not as popular as it once was, chemical derivatization of analytes (or perhaps the matrix) can be used to achieve additional selectivity. By adding new functional groups or eliminating "old" functional groups, chromatographic selectivity changes can be dramatic and may sometimes allow analytes to be completely resolved from interferences. Derivatization can enhance selectivity by introducing functional groups that allow the use of a selective detector (as discussed later). In addition, derivatization can be used to enhance volatility such that nonvolatile high-molecular-weight compounds that ordinarily couldn't be passed through a GC column can be separated by GC. The downside to analyte derivatization is that it adds an extra step, sometimes lengthy, to the overall analysis.
Step 4: Sample Introduction
Steps 1–3 may be automated or manual, but with step 4, we are now entering the instrumentation, and most modern GC instruments utilize automation exclusively.
The aim of sample introduction is to repeatably and reproducibly introduce a representative portion of the sample onto the analytical column in a narrow sample band with no chemical change. Usually, the analytes are dissolved into a liquid solvent that requires evaporation in the GC inlet; this liquid expands into a large vapor volume that then must be squeezed into a narrow column. Analytes already in the vapor phase have to be quickly flushed onto the column to ensure a narrow sample band and hence produce sharp peaks. Sample introduction is often the trickiest part of the process, with problems such as mass discrimination, activity, and breakdown frequently occurring in the inlet. However, discrimination doesn't have to be all bad; selective discrimination based on Grob-type principles uses the volatility of the sample components to selectively transfer analytes into the analytical column from the GC inlet. There are two main areas where this principle can be applied. At the front-end of the chromatogram, it can be used to eliminate major components. An example of this is large volume injection (LVI), where the solvent is evaporated out of the split exit before it is closed and the concentrated analytes are transferred onto the column. The principle also can be applied to the back-end of the chromatogram, to leave nonvolatile material within the inlet liner, protecting both the column and detector as well as reducing run times.
Frequently, the temperature of a hot GC inlet is not optimized, leading to unnecessary problems for sample analysis results and maintenance of the instrument. When selecting the inlet temperature, the default seems to be 250 °C, which may be too hot or too cold for certain analyses. Frequently, a temperature is chosen that is too high, because the analyst considered the boiling points of the components rather than thinking about their volatility. Figure 2 shows a plot of the literature boiling point of a hydrocarbon mixture against the effective boiling point — the temperature at which 100% of the analyte is vaporized and transferred onto the column. To vaporize the analytes, the inlet temperature is important, but so is the flow through the liner, which is dependent on column flow and split flow. As Figure 2 shows, the inlet temperature for this particular inlet type, an Atas Optic 2 (Atas GL, Eindhoven, The Netherlands) and liner flow, only needs to be a maximum of half of the boiling point for total transfer of the analyte onto the column.
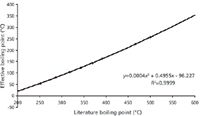
Figure 2: Literature boiling point vs. effective boiling point.
Figure 3 shows an example, for a hydrocarbon mixture, of profiling the inlet temperature required to transfer components out of the inlet while retaining others within the inlet liner. For example, at an inlet temperature of only 80 °C, the C18 hydrocarbon and those above are retained within the inlet liner, while 80% of C16 is vaporized and swept out and 100% of C14 and below are vaporized. To vaporize 100% of C18, an inlet temperature of 130 °C is required, but this is much lower than its boiling point of around 320 °C.
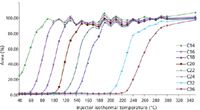
Figure 3: C14âC36 hydrocarbon vaporization efficiency plotted as a function of temperature.
As mentioned, this information is very useful when considering selectivity within the sample introduction step of the analysis. Here, selectivity is based on the volatility of the analytes; the control of the inlet temperature can be used to selectively transfer or exclude sample components from the analytical column. Figure 4 shows the discrimination envelope, where again for this inlet the temperature can be selected to either transfer an analyte or retain it within the inlet liner, with knowledge of the literature boiling point.
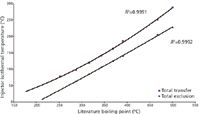
Figure 4: Temperature discrimination envelope: upper curve = the total transfer of analyte; lower curve = total exclusion of analyte.
For example, the least volatile analyte of interest in a sample has a literature boiling point of around 350 °C, which means the inlet temperature must be at least 140 °C (upper curve) for total transfer from the inlet onto the column. However, a large matrix peak with a literature boiling point of around 430 °C is preferred to be retained within the liner rather than being transferred onto the column, where it will potentially damage the stationary phase, dirty the detector, and lengthen the run time to elute it from the column. An inlet temperature of 170 °C (lower curve) or higher would mean transfer of this component onto the column. Therefore, an inlet temperature of at least 140 °C would mean all of the compounds of interest would be transferred to the column, but a higher inlet temperature, especially around 170 °C, would also mean transfer of less-volatile matrix components, an undesirable result.
Selectivity within the inlet also can be used for the concentration of analytes with LVI. The volume of solvent injected into a GC inlet is limited by its vapor volume; if the volume is too large, the capacity of the liner can be exceeded, causing contamination of the inlet, septum purge, split, and even the carrier gas inlet lines. Transferring too large a volume of solvent onto the column can result in distorted peaks because of the long solvent band. An LVI approach with a programmable temperature vaporizer (PTV) enables the evaporation of the majority of the solvent before the analytes are vaporized and transferred onto the column. The inlet temperature is chosen to enable the evaporation of the solvent while retaining the analytes within the inlet liner; usually this is 30 °C below the boiling point of the solvent. The discrimination envelope can be used here, but this time in reverse. The solvent boiling point is put into the upper curve for total transfer out of the split exit, although a slightly lower temperature is preferable to increase the solvent evaporation time so that it is more controlled. The boiling point of the most volatile analyte of interest is put into the lower curve. This temperature shouldn't be exceeded; otherwise loss out of the split exit can occur. This procedure can be used to eliminate any major component at the front end of the chromatogram, not just solvents.
Figure 5 shows the power of selectivity within the GC inlet to selectively take a volatility cut of a petrochemical sample and transfer it onto the column for separation while flushing the unwanted parts out of the split exit. The upper trace (Figure 5a) shows the entire sample transferred and separated on the column. If the less-volatile components were not of interest, as in the example discussed above, up to 100% of C20 can be transferred and separated on the column, as shown in Figure 5b, which shows the front end of the chromatogram. If only the less volatile components were of interest, only 100% of C40 and above can be transferred to the column, as shown in Figure 5c. Figure 5d shows a volatility cut, where only 100% of C30 is transferred with the minimum of more- and less-volatile analytes. In all of these traces, the unwanted components are flushed out of the split exit rather than being retained in the liner. Hence, traces of unwanted components are seen, the amount depending on the split ratio. Figure 5b can be achieved with any GC inlet type, selecting the correct inlet temperature to get 100% transfer of all analytes of interest; retaining unwanted less-volatile matrix components in the inlet liner is important for reproducibility of the target compounds while minimizing column and detector maintenance and GC run times. This approach also has the advantage of vaporizing the sample at the lowest possible temperature, hence causing fewer problems for thermally labile analytes. Figures 5c and 5d can only be achieved in cases where the inlet temperature can be varied during the sample introduction, with inlets such as PTV inlets.
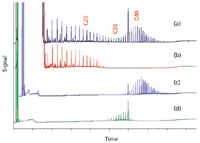
Figure 5: GC analysis of a petrochemical sample: (a) entire sample transferred and separated; (b) transfer of only 100% of C20 and earlier; (c) transfer of only 100% of C40 and later; (d) transfer of only 100% of C30.
Step 5: Analyte Separation
The separation of analytes and any transferred matrix on the analytical column is the main area where selectivity is considered in the GC analysis of a sample. By thinking about selectivity in steps 1–4, and finding ways to collect, extract, and transfer only the analytes of interest and not matrix, we can have fewer peaks to separate in the fifth step. In addition, less instrument and column maintenance may be required.
When selecting the GC column stationary phase, phrases such as "like separates like" or "polar separates polar" are useful. It is important to consider the chemical composition of the whole sample — both analytes and matrix — in separating them all from each other. Volatility as well as the functional groups present also must be considered when choosing the stationary phase, because very polar columns often are not able to reach the temperatures required to elute high-molecular-weight analytes. Stationary phase film thickness, column length, and internal diameter should be just enough to separate the components while minimizing band broadening and run times.
Sometimes, however, even if an analyst is very selective in the choice of analytical column as well as in steps 1–4, there just aren't enough theoretical plates for acceptable separation of the large number of analytes and matrix peaks transferred onto the column. Or, the components of the sample might have mixed characteristics in terms of polarity to make selection of the proper stationary phase difficult, resulting in good separation of some compound classes but not others. Introducing further selectivity approaches can help with these problems.
Heart cutting. Heart cutting transfers a "cut" of the remaining coeluted peaks from the separation on one stationary phase onto a secondary column containing a different, more selective stationary phase. Several cuts can be performed across a chromatogram.
Comprehensive two-dimensional gas chromatography (GC×GC). This method transfers many smaller cuts, usually 1–10 s long, onto a second column with a different stationary phase throughout the whole analysis; therefore every peak is separated on two different stationary phases. This separation enhancement is achieved by having the separation on the second column take no longer than the cut from the first column; for example, if the cuts from the first column are 4-s long, the separation on the second column takes no longer than 4 s.
LC–GC. Another method of introducing more selectivity is to hyphenate a different chromatographic technique to GC. For example, the sample might be first analyzed by liquid chromatography (LC), where selectivity in the mobile and stationary phases are very different, followed by analysis using GC. This is sometimes referred to as LC–GC.
Step 6: Analyte Detection
There are more than 20 detectors for GC on the market, many using quite different chemical or physical principles. When choosing a detector for a GC method, the aim is to select one that has adequate sensitivity with a linear response over the concentration range and is stable, reproducible, and gives the required information to confirm the presence or absence of the target analytes, along with a response for quantitation if required. By introducing selectivity in this detection step, we can improve sensitivity or make it much easier to observe the target analyte among coeluted analytes and matrix components.
Certain detectors respond only to certain compound classes; for example, an electron-capture detector only responds to analytes capable of capturing an electron. Other detectors only respond to certain atoms; for example, a sulfur chemiluminescence detector is used for sulfur-containing molecules, and a nitrogen–phosphorus detector is used for nitrogen- or phosphorus-containing molecules. A mass-selective detector adds another dimension of information and selectivity by providing a full mass spectrum, where a single ion or ions can be chosen that are unique to that molecule but not the coeluted peaks; the accurate mass of a molecule; or an MS-MS product ion spectrum. A detailed discussion of GC detectors is beyond the scope of this paper. It suffices to say that detection selectivity can be another addition to our "spectrum" of selectivity enhancements.
Step 7: Data Analysis
Unfortunately, data analysis sometimes takes just as long if not longer than the whole sample collection, preparation, and analysis. Properly understanding the problem and the questions to be answered is the starting point. Then, introducing selectivity at each of the steps discussed above to obtain high quality data showing the analytes of interest with as little interference as possible helps reduce the data analysis time as well as improve the quality of the results. Unfortunately, even after carefully optimizing each of the previous steps to be as selective as possible, there can still be some coelutions between analytes and matrix that cause problems, especially if very low-concentration analytes are being analyzed in dirty or complex samples.
If the sample has been analyzed with a detector that generates another dimension of data, more selectivity can be introduced at this step, too. With full scan data from a mass spectrometer, ions can be selected for qualitative and quantitative analysis that are unique to that analyte, which means the ions are not present in coeluted peaks, ion ratios show little variation, and integration is much easier baseline-to-baseline, reducing manual data analysis time.
Failing that, advanced techniques like deconvolution automatically unknit coeluted mass spectra for confirmation or identification of an analyte. The deconvoluted ions can then be used for accurate quantitation. Statistical analyses of the data using chemometric techniques like principal component analysis (PCA) are also helpful when analyzing complex data sets. PCA can assist with method development, the identification of outliers, determining patterns of association and variability, applying confidence intervals to determine the reproducibility of data, and determining mass spectral match coefficients. Even simple analyses can benefit from this automated approach.
Yet however good these advanced data analysis techniques are, they will always work best on high quality data, generated from a fully optimized sample collection, preparation, and analysis method where the techniques are selected to fit the analysis.
Like all parts of a method, optimization of the data analysis step takes time but is crucial to getting accurate results with as little manual input as possible, resulting in less data analysis time overall.
Where to Start?
Before determining which techniques to use at each step of the analysis, here are some factors that should be considered:
- The sample phase. Is it a gas, a liquid, a solid, or something in between?
- The analytes, including their volatility, nature, and concentration. Are very low detection limits needed? Are they thermally labile, active, or high-molecular-weight compounds?
- The matrix (volatility and nature). What proportion of the total sample is the matrix?
- The sample location. Can a representative portion be taken back to the laboratory easily without the sample changing? Is sampling in situ needed? Does the analysis need to be performed on site?
- Can the number of sample preparation steps be minimized?
- How many samples are there? Is it necessary or even possible to automate the sampling or extraction technique?
- Is the purpose of the sample analysis to identify the presence or absence of target analytes or to identify unknowns?
- Is quantitation needed? If so, across what concentration range? Are standards available?
Then, break the system down into steps, determine where to start, and put together a plan for the development and optimization. As discussed, take selectivity into consideration for the following steps:
- Sampling: Selectively extract the analytes of interest in situ.
- Sample preparation: Selectively extract or concentrate the analytes from the sample matrix.
- Analyte derivatization: It can affect chromatographic and detection selectivity.
- Sample introduction: Selectively transfer the analytes onto the column.
- Analyte separation: Selectivity of the stationary phase to separate analytes and matrix components.
- Analyte detection: Selectively "see" only the analytes of interest.
- Data analysis: Select unique masses rather than coeluted ones.
Summary
In gas chromatography, selectivity is commonly thought about exclusively in the column stationary phase and sometimes extended to the detector. However, selectivity (or being selective) can be applied throughout the whole sample analysis cycle from the sampling stage, through sample preparation, sample introduction, analyte separation, analyte detection, data analysis, and report generation. To gain full benefits and achieve a truly robust method that is fit for purpose, every step in this cycle must be considered, including choosing the correct technique for each step, optimizing the experimental parameters, and properly applying the method to the analysis.
Diane Turner is the director of Anthias Consulting Ltd., Papworth Everard, Cambridgeshire, United Kingdom. She consults in analytical chemistry with expertise in GC, GC–MS, and related techniques such as GC×GC.

Diane Turner
Ronald E. Majors "Column Watch" Editor Ronald E. Majors is Senior Scientist, Columns and Supplies Division, Agilent Technologies, Wilmington, Delaware, and is a member of LCGC's editorial advisory board. Direct correspondence about this column via e-mail to lcgcedit@lcgcmag.com.

Ronald E. Majors

Perspectives in Hydrophobic Interaction Temperature- Responsive Liquid Chromatography (TRLC)
TRLC can obtain separations similar to those of reversed-phase LC while using only water as the mobile phase.

.png&w=3840&q=75)

.png&w=3840&q=75)


.png&w=3840&q=75)


.png&w=3840&q=75)


