Ion Mobility–Mass Spectrometry for Food Analysis: An Update
Special Issues
In food analysis, many different biological matrices are investigated containing numerous compounds that can interfere with liquid chromatographyÐmass spectrometry (LC–MS) analysis. To overcome the challenges that arise with these highly complex matrices, the additional separation of analytes and matrix compounds complementing chromatographic separation is becoming more significant. In this article, the potential of IM-MS to increase selectivity and for additional identity confirmation is investigated. An extensive evaluation of IM-MS instruments was performed on a broad test set of food safety contaminants. The tested IM-MS platforms were DMS, TWIMS, low field DTIMS, and TIMS. CCS data were determined using the different instruments, and the ability to separate isomers and compounds of interest from sample matrix in the IM dimension was explored.
In food analysis, many different biological matrices are investigated containing numerous compounds that can interfere with liquid chromatography–mass spectrometry (LC–MS) analysis. To overcome the challenges that arise with these highly complex matrices, the additional separation of analytes and matrix compounds complementing chromatographic separation is becoming more significant. In this article, the potential of ion mobility–mass spectrometry (IM-MS) to increase selectivity and for additional identity confirmation is investigated. An extensive evaluation of IM-MS instruments was performed on a broad test set of food safety contaminants. The tested IM-MS platforms were differential ion mobility spectrometry (DMS), travelling-wave ion mobility spectrometry (TWIMS), low field drift tube ion mobility spectrometry (DTIMS), and trapped ion mobility spectrometry (TIMS). Collision cross section (CCS) data were determined using the different instruments, and the ability to separate isomers and compounds of interest from sample matrix in the IM dimension was explored.
The field of food quality and safety analysis deals with many different biological samples, such as feed, urine, milk, and tissue. These complex matrices contain compounds that interfere with the analysis and cause challenges for identification and quantification of regulated compounds. The effect of interfering compounds can be minimized by application of highly selective separation techniques, such as gas chromatography (GC) and liquid chromatography (LC) (1,2). Nevertheless, the influence of the matrix may not be completely removed by the chromatographic separation when complex samples are considered.
A non-chromatographic technique offering possibilities for additional separation is ion mobility (IM). Ion mobility has also been coupled to, or fully integrated in, mass spectrometry (MS) instrumentation. The resulting ion mobility–mass spectrometry (IM-MS) instruments enable more in-depth investigation of ions using both ion mobility and mass spectrometric data. Ion mobility spectroscopy (IMS) has been used since the 1950s to study the mobility of ions in the gas phase and to investigate ion–molecule reactions of volatile compounds (3). A typical, drift tube-like, ion mobility system consists of a drift tube through which ions are transported using a weak electric field while a so-called drift gas is effectively static or flows in the opposite direction of ion transport. The mobility (K) of an ion can be determined by measuring the residence time of an ion in the drift tube (referred to as a drift time) and relating this to the applied field strength (V/m). The drift time is influenced by the shape, size, and charge of an ion, and also the interaction potential with the buffer gas. The more compact the shape and size of an ion is, the shorter the drift time (4). An experimentally obtained drift time of a compound can be used to calculate the rotationally averaged collision cross section (CCS, Ω), which is a two-dimensional (2D) representation of the ion’s three-dimensional (3D) structure (5). While drift times are instrument- and condition-dependent, CCS values should be intrinsic properties of ions in a given buffer gas. Thus, when comparing the same ion species and confirmation, agreement across different IM techniques and conditions should be possible (6). The CCS of an ion of known mass-to-charge can be calculated using drift-tube ion mobility spectrometry (DTIMS) following the Mason-Schamp equation (7):

in which z is the charge state of the analyte ion, e is the charge of an electron (fundamental charge), N is the number density of the drift gas, µ is the reduced mass of the ion-neutral pair, kB is the Boltzmann constant, T is the absolute gas temperature, and K0 is the reduced mobility (the mobility normalized to NIST standard temperature and pressure) (7,8). Structural isomers can have different CCS values and are therefore amenable for separation using IMS (9–12). Furthermore, confidence in analyte characterization can be increased by adding CCS as an additional identification point to support other identification points as retention time and MS parameters (13).
The IM principles can be subdivided into selective, separationâinâspace, techniques; differential mobility spectrometry (DMS) and fieldâasymmetric ion mobility spectrometry (FAIMS), and dispersive, separation-in-time, techniques; DTIMS, travelling-wave ion mobility spectrometry (TWIMS), and trapped ion mobility spectrometry (TIMS) (8,12,14). While previous limitations have included the confinement of IM-MS instruments to research environments, recent developments of instruments has opened up possibilities to support applications involving analysis of small molecules in real samples. IM-MS can, for example, be used to separate analytes from isobaric interferences and thus decrease the limit of detection by improving the signal-to-noise (S/N) ratio (15–18,14).
Recently, a review article by Hernández-Mesa et al. (14) was published highlighting the most important developments, achievements, and limitations of IM-MS in food safety research. However, no current, experimental evaluation of the possibilities of IM-MS instruments has been published until now. This article strives to show both the potential of IM-MS in food safety and the limitations of IM-MS instruments in terms of analytical performance. Several mass spectrometers with ion mobility cells have therefore been evaluated for their ability to separate isomers and reduce matrix interferences.
Experimental Conditions
DIMS: MS Settings: A QTRAP 6500 MS/MS system (Sciex) equipped with an electrospray ionization (ESI) source and a SelexION ion mobility cell was used in selected ion monitoring (SIM) mode at the specific mass-toâcharge ratio (m/z) of each investigated compound. The heater gas temperature was 500 °C and the ion spray voltage was 5500 V. Regarding the mobility cell, the compensation voltage (COV) was scanned to obtain COV scans while different settings were varied to study the effect on the mobility separation: separation voltages (SV) ranged from 0 up to 4500; DIMS resolution enhancement (DR) was set to either off, low, medium, or high; and the use of 2-propanol as modifier with modifier composition (MDC) set to low or high.
DTIMS: MS Settings: Measurements were made using an Agilent 6560 IMSâQTOF mass spectrometer using ESI (Agilent G1607A dual Jetstream) and with electronic drift gas pressure control. Nitrogen was used as drying gas at a temperature of 360 °C, and a sheath gas flow rate of 13 L/min at a temperature of 225 °C. The MS capillary voltage was 3500 V, the nozzle voltage was 500 V with the nebulizer gas pressure set to 30 psi, and the fragmentor was set to 275 V. The scanned mass range was m/z 50 to 1700. The instrument was calibrated prior to measurements using the supplied tune mixture of the manufacturer and the mass spectrometer was tuned in the 2 GHz extended dynamic range mode. A trapping time of 10,000 µs was used for the IM separation with packages of ions released every 60 ms using a trap release time of 150 µs. The drift tube was filled with nitrogen and operated with an absolute entrance voltage of 1574 V and an exit voltage of 224 V with a drift tube pressure of 3.95 Torr and a temperature of 25 °C. CCS calibration was performed in the single field mode using established conditional reference values from a recent interlaboratory study (19).
TIMS: MS Settings: A TIMS-TOF (Bruker Daltonics) equipped with ESI was used to obtain full scan measurements in positive and negative mode with a scan range of m/z 100–1000. The capillary voltage was 3200 V, the end plate offset was -500 V, the dry gas flow was 3.0 L/min, the dry heater was set to 200 °C, the nebulizer was at 0.3 bar, and the collision energy was 5.0 eV. The TIMS operation mode was set initially to survey mode where after TIMS settings (TIMS voltage range and accumulation time) were optimized for each ion to obtain optimal resolution in a narrow 1/K0 range. CCS calibration and calculation was performed using Compass data analysis with Agilent tuning mix as calibrant (m/z 322.0481 reference mobility 0.737; m/z 622.0290 reference mobility 0.994; m/z 922.0098 reference mobility 1.212).
TWIMS: MS Settings: A Synapt G2-S MS system (Waters) equipped with ESI was used to obtain full scan measurements in positive and negative mode with a scan range of m/z 200–900 in resolution mode. The source temperature was 150 °C, the capillary voltage was 3.0 kV, and the cone voltage was 20 V. The TWIMS cell was operated at a nitrogen gas flow of 90 mL/min, a wave velocity of 650 m/s, and a wave height of 40 V. CCS calibration and calculation was performed using DriftScope v2.7 (Waters) with polyalanine as calibrant.
LC–MS Method: For the implementation of IM into an LC–MS method, an Acquity ultra-performance liquid chromatography (UPLC) system (Waters) was coupled to a Synapt G2-S MS (Waters). A 4.6 mm × 150 mm, 5-µm Zorbax Eclipse XBD-C8 column (Agilent Technologies) was used for separation. Mobile phase A consisted of 0.2% formic acid in purified water, and mobile phase B of 0.2% formic acid in methanol. The column temperature was 50 °C, the flow rate 0.4 mL/min and an injection volume of 10 µL was used. Gradient elution was as follows: 0.5 min of isocratic elution at 100% A, followed by a gradient to 80% B in 1 min, to 90% B in the next 8.5 min, and finally to 100% B in 3 min. After 5 min at this state, the system was re-equilibrated for 5 min at 100% A. Full scan IM-MS measurements with a scan range of m/z 200–900 in resolution mode were performed using a source temperature of 120 °C, capillary voltage 3.5 kV, and cone setting 30.
Results and Discussion
Test Set: To be able to assess the performance of IM-MS instruments for food safety applications, a test set of over 20 compounds was prepared. The test set of compounds represent a wide range of contaminants, toxins, and veterinary drugs that can be present in food or be used in the food industry, with low molecular weights (<1000 Da). Depending on their characteristics and availability of isomers, not all compounds in the test set were used for every aspect of this research: some compounds were mainly used for assessment of CCS determination under repeatability conditions of measurement, while others were used to determine isomer separation efficiency.
CCS Determination: Experimental CCS values of individual compounds can be determined using different strategies, such as using a primary method of measurement (stepped-field DTIM-MS), or using a secondary method following external calibration of the IM-MS instrument using a calibration mixture with best estimates of CCS values. In this research, only secondary approaches were used; CCS values were determined using a single-field DTIMS instrument and using a TWIMS instrument. Primary measurement of CCS values is only possible on a static drift tube instrument when all experimental parameters are well characterized, allowing the propagation of arrival times at different field strengths to be converted to CCS values (20). Previous work has shown excellent agreement (average bias <1%) between a primary stepped-field and a secondary single-field DTIM-MS method based on a derivation of the Mason Schamp equation (19). Indirect measurement is also performed using TWIMS or TIMS instruments using CCS values from DTIM-MS instruments as calibrants. However, unlike DTIMS, drift times obtained from TWIMS instruments cannot be directly converted into CCS values since the electric field in the TWIMS cell is constantly changing and thus no direct relationship between the obtained drift time and CCS can be made (21). The TWIMS drift times are therefore very much instrument- and parameterâdependent, making calibration of TWIMS instruments using a mixture containing calibrants with consensus CCS values crucial to obtain reliable CCS values (6).
It should be noted that no CCS calculation was performed using the TIMS and DIMS instruments. At the time when the TIMS instrument was used, CCS values could not yet be routinely obtained. This feature was only added in later software versions (22), and so could not be tested in this research. The correlation between CCS and K0, and thus the possibility to calculate CCS from drift times, is only valid when the ratio between electric field strength and buffer gas density is small. In DIMS and FAIMS instruments, however, the electric field strength is larger, making it not possible to calculate CCS from experimental drift times. For this reason, the ion mobility cell in DIMS and FAIMS instruments is mainly used as a filter to separate analytes or remove undesirable interferences (8).
Accuracy of CCS Determination: CCS values for 22 compounds were obtained using both DTIMS and TWIMS instruments. The experimental CCS values are listed in Table 1. Compounds were measured in both positive and negative mode, and some compounds were additionally detected as sodium adduct.
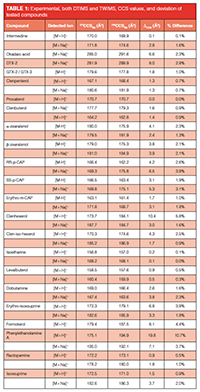
As can be noted from Table 1, the difference in experimental CCS values obtained using instruments from different IM principles is generally lower than 3% for the large majority (82%) of the detected ions. The obtained CCS values differed by more than 10% for only one compound (phenylethanolamine A). The correlation found between DTIMS and TWIMS experimental CCS values is also in good agreement with literature reports. In several publications (11,23,24,21), deviations between DTIMS and TWIMS CCS values in the order of a few percent have been reported. In individual cases, however, larger differences could occur, as observed both in previous literature (23,21) and in this study. Possible explanations for this phenomenon is the occurrence of different ion conformations or even ion species in DTIMS and TWIMS experiments caused by protonation site isomers (“protomers”) (25), or the mismatching of calibrants with the investigated structures in the case of TWIMS. The latter issue is described by Hines et al., who demonstrated that selecting a suitable calibrant for the compounds of interest can be significant because the use of mismatched calibrants can result in larger CCS errors (26). The observation that not all compounds yield similar CCS values in DTIMS and TWIMS instruments shows that care has to be taken when identity confirmation of a compound relies on CCS data obtained using a different type of IM-MS instrument than the reference value.
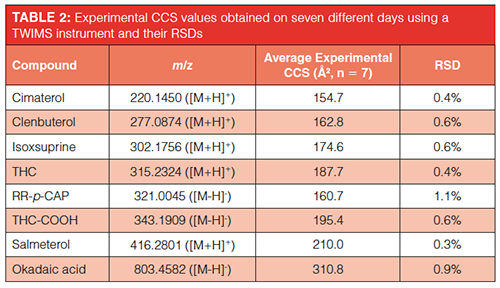
Precision of CCS Determination Under Intermediate Precision Conditions of Measurement Using TWIMS: The precision of CCS determination under intermediate precision conditions of measurement was also explored. A smaller test set comprised of eight compounds with m/z ranging from 220 up to 803 was measured on seven different days using a TWIMS instrument. The instrument was CCS calibrated using polyalanine at the start of each day, polyalanine was also used as reference calibrant for CCS calculation using reference nitrogen CCS values. The resulting CCS values and relative standard deviations (RSDs) can be found in Table 2.
All CCS values could be determined with a repeatability precision below 1%, with the exception of RR-p-CAP (1.1%). The found repeatability was in good consensus with the literature with several studies reporting CCS repeatability precision below 2% (27–29,6,30). While not investigated in this research, several other studies have reported CCS data on different instrument classes to be highly reproducible on instruments located in different laboratories, with interlaboratory relative standard deviations (RSDs) below 3% (31,19). The excellent repeatability of the CCS values obtained using TWIMS in this study support the notion that CCS can be used as a reliable identification point for the investigated compounds.
Isomer Separation: To evaluate the separation power of the different IM-MS concepts, several compounds were selected from the test set based on the availability of isomers and structural differences between those isomers. Even though most of these isomers can be separated using chromatography, the rise of ambient and direct ionization techniques, capable of high-throughput screening without chromatography, has evoked an interest in non-chromatographic separation of isomers. The isomers were first analyzed by IM-MS separately to determine the drift times and separation potential. When a notable difference was observed between the drift times of the isomers, the isomers were measured as mixtures to investigate the separation.
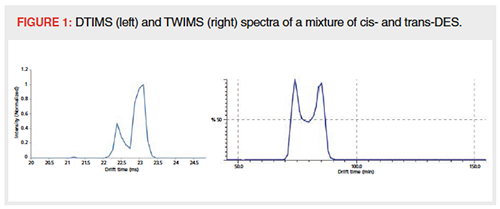
The separation of cis- and trans-di-ethylstilbestrol (DES) was investigated. Benigni et al. reported a CCS difference of 3 to 5 Å2, and separation of the two isomers on a TIMS instrument with an ion mobility resolution of 70–120 (32). DES isomers were analyzed on the DTIMS, TWIMS, and DIMS instruments, where the latter did not result in any separation. DES isomers are preferably analyzed in negative mode and were thus not analyzed on the TIMS instrument since it could only be used in positive mode at that time. Using DTIMS and TWIMS, the DES isomers were clearly separated (Figure 1). The observed peak-toâpeak resolution was below 1 for both DTIMS and TWIMS measurements, which is in good correspondence with the reports of Causon et al. stating that for a peakâtoâpeak resolution of 0.6, at which two components can be reliably determined, a CCS difference of 1.5–1.8% is needed. To obtain baseline separation with a peak-to-peak resolution of 1.5, a CCS difference of at least 3.7–4.4% is required (33), as previously described by Dodds et al. (34).
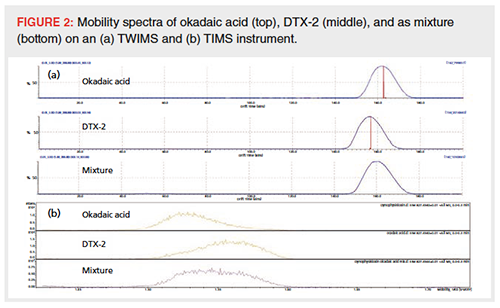
The necessity of a CCS difference of more than just a few percent to separate isomers on current IM-MS instruments was confirmed when analyzing compounds with limited structural differences, such as pyrrolizidine alkaloids and the marine toxins okadaic acid and DTX-2. No significant CCS difference was observed between the investigated pyrrolizidine alkaloids, while okadaic acid and DTX-2 yielded a minor difference of around 2.5% (310.8 and 303.2, respectively). Figure 2 shows okadaic acid and DTX-2 analyzed separately and as a mixture. While some difference in drift times could be noticed between the individual compounds, the mixture yielded only one coalesced peak in the ion mobility dimension.
While limited fine-tuning of the IM parameters was possible in the DTIMS, TWIMS, and TIMS instruments (at the time of this study), fine-tuning was possible with the DIMS instrument. While the other investigated techniques are incorporated into the MS instrument ion pathway, the DIMS mobility cell is placed in the ion source before the MS inlet and works as a filter based on mobility. The amplitude of the separation voltage waveform, the residence time of the ions in the mobility cell, and the use of a modifier were most effective to achieve better separation. Higher separation voltages resulted in the somewhat increased separation of a mixture of four β-agonists with m/z varying from 220 to 416, mainly between the lowest mass compound, cimaterol, and the other three compounds (clenbuterol, isoxsuprine, and salmeterol). Longer residence time of the ions in the mobility cell resulted in narrower peaks, and thus an increase in IM resolution. The isobaric β-agonists clenpenterol and procaterol were used to test the separation power of the DIMS mobility cell. Although these isobars can be separated on a high-resolution MS instrument, mass separation is not possible on lower resolution MS instruments since their m/z difference is only 0.067 Da. While no separation was achieved using standard IM settings, the combination of a high separation voltage, 4000 V, and use of 2-propanol as modifier resulted in an almost baseline separation. Since clenpenterol contains two chlorine atoms, it has a 35Cl37Cl-peak (m/z 293) at 65% of the 35Cl2-peak (m/z 291). This phenomenon is clearly visible in the resulting scan: m/z 291 shows two peaks (both clenpenterol and procaterol), while m/z 293 shows only one major peak (clenpenterol). While these results look very promising, it should be noted that a more than 100-fold reduction of signal intensity was observed when applying these radical settings, thus hampering practical use of DIMS when high sensitivity is required.
Even though mobility spectra of structurally very similar isomers can show a detectable difference when analyzed separately, a mixture will often yield a single peak only as a result of the insufficient separation power of the IM-MS instrument. At this time, stateâofâthe-art chromatography is still a better option in most cases for separation of compounds with a small CCS difference. The investigated pyrrolizidine alkaloids, for example, could all be resolved using a 2D-LC method (35). Nevertheless, recent publications about novel highâresolution IM-MS designs showed very impressive preliminary results regarding mobility separations by use of structures for lossless ion manipulations (SLIM) (36) or a multi-pass cyclic ion mobility separator instrument (37). Here, very long ion pathways are created, raising the ion mobility resolution to such a degree that could be the key to lifting IM-MS to even higher levels, opening up the ability to separate isomers with very small CCS differences.
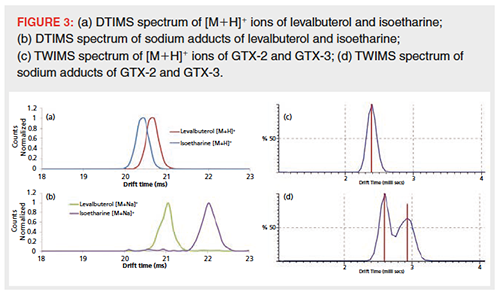
Another possibility to increase IM separation is the promotion of adduct formation. From the literature it is known that cationic adduct formation has the potential to improve the separation of isomers that are otherwise not separated (38–42). In this study, the effect of sodium cationization on IM separation was further investigated with the same isobaric β-agonists as described above: clenpenterol and procaterol. While protonated ions did not show any separation in the ion mobility dimension, sodium adducts showed a clear difference in drift time and were almost baseline separated. The effect of increased separation using sodium cationization was further observed for several other isomer pairs. The β-agonist isomers, levalbuterol and isoetharine, showed minor separation in their protonated form, but baseline separation as sodium cations (Figure 3[a] and 3[b]). Attempts to separate stereo-isomers gonyautoxin-2 (GTX-2) and gonyautoxin-3 (GTX-3), two marine neurotoxins, were previously described by Poyer et al. (5). While nonâsulfated saxitoxin analogues could be separated on a TWIMS instrument, no separation was observed for GTX-2 and GTX-3. This finding was confirmed in this study, where no separation of the marine toxins was detected when analyzed as protonated molecules (Figure 3[c]). Promotion of sodium adduct formation by the addition of sodium acetate to the sample, however, resulted in separation of GTX-2 and GTX-3 as [M+Na]+ ions (Figure 3[d]). Since these isomers were only available as mixture, it was not possible to assign the two peaks. Although no baseline separation was achieved, observed peakâtoâpeak resolution was approximately 0.8, with the obtained separation a huge improvement compared to the unseparated [M+H]+ ions. Both from the literature (41) and from the data presented here, no general trend or rule for whether or not adduct formation will result in additional IM separation could be derived. The investigation of individual isomer pairs of interest is therefore inevitable but can result in the extra separation needed.
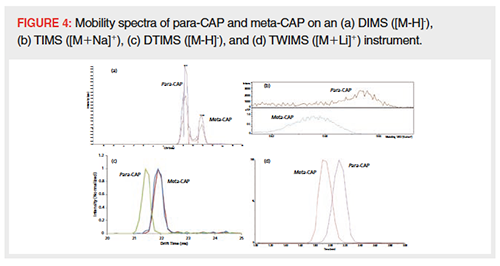
An interesting test case for IMâMS from food safety practice was the separation of different CAP isomers. Eight isomers of CAP exist, two positional isomers (para- and metaâCAP) with four stereoisomers each (RR-, SR-, RS-, and SS-CAP), but only one of those isomers has antimicrobial activity (RR-p-CAP) (43,44). In line with the findings presented above, no separation was observed between the stereoisomers (see Table 1) because their structural differences are very minor. Para- and meta-CAP, however, could be separated to a certain extent on each IM-MS instrument tested (Figure 4). Where the DTIMS instrument was able to separate the structural isomers ([M-H]-, Figure 4[c]), a high separation voltage was needed on the DIMS instrument (Figure 4[a]). The TIMS instrument was, as mentioned before, only used in positive mode and thus the separation of sodium adducts is shown in Figure 4(b). TIMS works with 1/K0 spectra, meaning that the spectra are reversed compared to direct drift time spectra, and sodium cationized paraâCAP therefore had a shorter drift time than sodium cationized meta-CAP. On the TWIMS instrument, only separation for lithium adducts was observed (Figure 4[d]). Lithium cationized meta-CAP exhibited a shorter drift time compared to para-CAP, which is most likely caused by lithium forming a more compact adduct with meta-CAP.
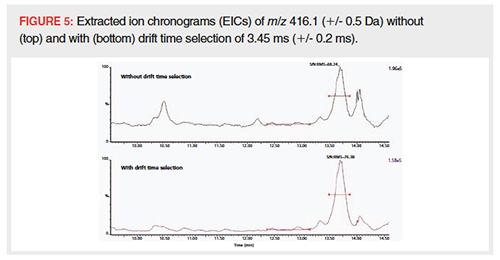
Value of Additional IM Separation of Signal from Matrix: LC–MS: The additional value of IM to existing methods was investigated by adding IM to an LC–MS method. Extracted animal feed samples were analyzed on the TWIMS-MS instrument in full scan mode. The obtained data was afterwards evaluated with only m/z selection, and after additional drift time selection. The m/z window was set at 1 Da to mimic precursor ion selection in a triple quadrupole MS instrument, since these MS instruments are most commonly used for quantitative LC–MS analysis. As shown in Figure 5, selection of the drift time of an analyte can reduce the noise and filter interfering peaks from isobaric matrix compounds. The signal intensity of the peak of interest at 13.7 min decreased somewhat when drift time selection was applied: from 1.96 × 10⁵ to 1.58 × 10⁵ (19%). The S/N ratio, however, increased by 12% (from 68 to 76) yielding a higher sensitivity when drift time selection was used. A similar decrease of matrix interference by drift time selection was noted during a previous study (16) and the increased S/N ratio was also described in the literature (17,18,45,36). Next to the increased S/N, the other peaks at this specific m/z, most likely interfering compounds from the matrix, decrease to a much larger extent than the peak of interest and therefore the interference of these peaks during quantification of the targeted peak was reduced.
Conclusion
CCS values could be obtained from DTIMS and TWIMS instruments with good agreement and repeatability, even over extended periods of time and between the IM-MS instruments utilizing different IM principles. However, not all compounds yielded the same CCS values when analyzed on the different instruments, implying that caution has to be taken when experimental data are compared without analysis of reference compounds.
The IM-MS instruments offer somewhat limited possibilities for isomer separation when the CCS difference between the isomers is small. IM separation of stereoisomers was therefore found to be challenging, while positional isomers are more amendable for IM separation. Cationic adduct formation may offer a solution for nonâseparated isomers, since it was found that some isomers showed larger CCS differences when analyzed as sodium cations. Furthermore, it was shown that implementation of IM into existing LC–MS analysis can be a solution to reduce interferences from isobaric matrix components. By using drift time selection, additional selectivity can be obtained without large sensitivity losses, or even sensitivity gains due to increased S/N. This approach may therefore be promising for data-independent screening approaches for food analysis.
In summary, IM can be a valuable addition to current food safety analysis in terms of the separation of isomeric and isobaric compounds. However, to truly resolve closely related compounds, such as diastereomers, further advances in instrumentation with higher mobility resolution are required. This might be already on its way with the development of techniques such as SLIM and multi-pass cyclic IM (37,36).
Acknowledgements
This research was funded by the Dutch Ministry of Agriculture, Nature, and Food Quality, project number 126.73337.01.
References
- A. Masia, M.M. Suarez-Varela, A. Llopis-Gonzalez, and Y. Pico, Anal. Chim. Acta 936, 40–61 (2016).
- L. Mainero Rocca, A. Gentili, V. PerezâFernandez, and P. Tomai, Food Addit. Contam. Part A Chem. Anal. Control Expo. Risk Assess. 34, 766–784 (2017).
- E.W. McDaniel, D.W. Martin, and W.S. Barnes, Review of Scientific Instruments33, 2–7 (1962).
- C. Lapthorn, F. Pullen, and B.Z. Chowdhry, Mass Spectrom. Rev. 32, 43–71 (2013).
- S. Poyer, C. Loutelier-Bourhis, G. Coadou, F. Mondeguer, J. Enche, A. Bossee, P. Hess, and C. Afonso, J. Mass Spectrom.50, 175–181 (2015).
- J. Regueiro, N. Negreira, and M.H. Berntssen, Anal. Chem. 88, 11169–11177 (2016).
- E.A. Mason and H.W. Schamp Jr, Annals of Physics 4, 233–270 (1958).
- F. Lanucara, S.W. Holman, C.J. Gray, and C.E. Eyers, Nat. Chem. 6, 281–294 (2014).
- B.M. Kolakowski and Z. Mester, Analyst132, 842–864 (2007).
- P. Martinez-Lozano and J. Rus, J. Am. Soc. Mass Spectrom.21, 1129–1132 (2010).
- J.P. Williams, M. Grabenauer, R.J. Holland, C.J. Carpenter, M.R. Wormald, K. Giles, D.J. Harvey, R.H. Bateman, J.H. Scrivens, and M.T. Bowers, International Journal of Mass Spectrometry298, 119–127 (2010).
- R. Cumeras, E. Figueras, C.E. Davis, J.I. Baumbach, and I. Gracia, Analyst 140, 1376–1390 (2015).
- M. Hernandez-Mesa, B. Le Bizec, F. Monteau, A.M. Garcia-Campana, and G. DervillyâPinel, Anal. Chem. 90, 4616–4625 (2018).
- M. Hernández-Mesa, A. Escourrou, F. Monteau, B. Le Bizec, and G. Dervilly-Pinel, TrAC Trends in Analytical Chemistry94, 39–53 (2017).
- H.S. Jonasdottir, C. Papan, S. Fabritz, L. Balas, T. Durand, I. Hardardottir, J. Freysdottir, and M. Giera, Anal. Chem.87, 5036–5040 (2015).
- W.F. Duvivier, T.A. van Beek, and M.W. Nielen, Rapid Commun. Mass Spectrom. 30, 2331–2340 (2016).
- K.L. Arthur, M.A. Turner, A.D. Brailsford, A.T. Kicman, D.A. Cowan, J.C. Reynolds, and C.S. Creaser, Anal. Chem.89, 7431–7437 (2017).
- K.L. Arthur, M.A. Turner, J.C. Reynolds, and C.S. Creaser, Anal. Chem. 89, 3452–3459 (2017).
- S.M. Stow, T.J. Causon, X. Zheng, R.T. Kurulugama, T. Mairinger, J.C. May, E.E. Rennie, E.S. Baker, R.D. Smith, J.A. McLean, S. Hann, and J.C. Fjeldsted, Anal. Chem.89, 9048–9055 (2017).
- D.N. Mortensen, A.C. Susa, and E.R. Williams, J. Am. Soc. Mass Spectrom.28, 1282–1292 (2017).
- L. Fiebig and R. Laux, International Journal for Ion Mobility Spectrometry19, 131–137 (2016).
- M. Chai, M.N. Young, F.C. Liu, and C. Bleiholder, Anal. Chem.90, 9040–9047 (2018).
- M.F. Bush, I.D. Campuzano and C.V. Robinson, Anal. Chem.84, 7124–7130 (2012).
- J.G. Forsythe, S.M. Stow, H. Nefzger, N.W. Kwiecien, J.C. May, J.A. McLean, and D.M. Hercules, Anal. Chem.86, 436–4370 (2014).
- J. Boschmans, S. Jacobs, J.P. Williams, M. Palmer, K. Richardson, K. Giles, C. Lapthorn, W.A. Herrebout, F. Lemiere, and F. Sobott, Analyst 141, 4044–4054 (2016).
- K.M. Hines, J.C. May, J.A. McLean, and L. Xu, Anal. Chem.88, 7329–7336 (2016).
- J.C. May, C.R. Goodwin, N.M. Lareau, K.L. Leaptrot, C.B. Morris, R.T. Kurulugama, A. Mordehai, C. Klein, W. Barry, E. Darland, G. Overney, K. Imatani, G.C. Stafford, J.C. Fjeldsted, and J.A. McLean, Anal. Chem.86, 2107–2116 (2014).
- G. Paglia, J.P. Williams, L. Menikarachchi, J.W. Thompson, R. Tyldesley-Worster, S. Halldorsson, O. Rolfsson, A. Moseley, D. Grant, J. Langridge, B.O. Palsson, and G. Astarita, Anal. Chem.86, 3985–3993 (2014).
- L. Beucher, G. Dervilly-Pinel, S. Prevost, F. Monteau, and B. Le Bizec, Anal. Chem.87, 9234–9242 (2015).
- J. Hofmann, A. Stuckmann, M. Crispin, D. J. Harvey, K. Pagel, and W.B. Struwe, Anal. Chem.89, 2318–2325 (2017).
- G. Paglia, P. Angel, J.P. Williams, K. Richardson, H.J. Olivos, J.W. Thompson, L. Menikarachchi, S. Lai, C. Walsh, A. Moseley, R.S. Plumb, D.F. Grant, B.O. Palsson, J. Langridge, S. Geromanos, and G. Astarita, Anal. Chem. 87, 1137–1144 (2015).
- P. Benigni, C.J. Thompson, M.E. Ridgeway, M.A. Park, and F. Fernandez-Lima, Anal. Chem.87, 4321–4325 (2015).
- T.J. Causon and S. Hann, J. Chromatogr. A1416, 47–56 (2015).
- J.N. Dodds, J.C. May, and J.A. McLean, Anal. Chem.89, 952–959 (2017).
- M.G.M. van de Schans, M.H. Blokland, P.W. Zoontjes, P.P.J. Mulder, and M.W.F. Nielen, J. Chromatogr. A 1503, 38–48 (2017).
- Y.M. Ibrahim, A.M. Hamid, L. Deng, S.V. Garimella, I.K. Webb, E.S. Baker, and R.D. Smith, Analyst 142, 1010–1021 (2017).
- K. Giles, J.L. Wildgoose, S. Pringle, D. Langridge, P. Nixon, J. Garside, and P. Carney, Proceedings of the American Society for Mass Spectrometry and Allied Topics (St. Louis, Missouri, USA, 2015).
- Y. Huang and E.D. Dodds, Anal Chem 85, 9728–9735 (2013).
- T.G. Flick, I.D. Campuzano, and M.D. Bartberger, Anal. Chem. 87, 3300–3307 (2015).
- A. Troc, M. Zimnicka, M. Kolinski and W. Danikiewicz, J. Mass Spectrom.51, 282–290 (2016).
- K.A. Morrison, B.K. Bendiak, and B.H. Clowers, J. Am. Soc. Mass Spectrom.28, 664–677 (2017).
- X. Zheng, X. Zhang, N.S. Schocker, R.S. Renslow, D.J. Orton, J. Khamsi, R.A. Ashmus, I.C. Almeida, K. Tang, C.E. Costello, R.D. Smith, K. Michael, and E.S. Baker, Anal. Bioanal. Chem.409, 467–476 (2017).
- L.M. Shabad, T.A. Bogush, I.A. Konopleva, and G.A. Belitsky, Neoplasma. 24, 147–150 (1977).
- B.J. Berendsen, M.L. Essers, L.A. Stolker, and M.W. Nielen, J. Chromatogr. A1218, 7331–7340 (2011).
- A. Cohen, N.W. Ross, P.M. Smith, and J.P. Fawcett, Rapid Commun. Mass Spectrom.31, 842–850 (2017).
Wilco Duvivier obtained his M.Sc. degree in analytical sciences in 2011 and afterwards worked at DSM prior to becoming a PhD student in 2012. After obtaining his Ph.D., he worked as an analytical scientist at RIKILT Wageningen UR (now WFSR) and Cosun R&D and now works as an analytical research chemist at Dow in Terneuzen, The Netherlands.
Marco Blokland obtained his M.Sc. degree in analytical sciences in 2002. He worked at the National Institute of Public Health and the Environment as a study director for various projects related to food safety up until 2010. Since 2010 he has worked as a scientist at the WFSR. His research is focused on the detection of food contaminants using different advanced mass spectrometric techniques.
Jan Jordens obtained his M.Sc. degree in biochemistry in 2001 and obtained his Ph.D. in medicine in 2007. His Ph.D. research focused on unravelling the activation mechanism of PTPA on PP2A using different analytical techniques. Up until 2010 he performed a postdoc at Janssen pharmaceutica focused on the use of mass spectrometry to determine the structures of small molecules and peptides. Since 2010 he has worked as a scientist at DSM in Geleen, The Netherlands.
Tim Causon obtained his Ph.D. in 2012 at the University of Tasmania, Australia, and is now an assistant professor at the University of Natural Resources and Life Sciences, Vienna. His research interests are focused on organic mass spectrometry, ion mobility-mass spectrometry, and related separation science technologies, covering fundamental aspects and analytical method development for metabolomics and related small molecule applications.
Stephan Hann heads the group of Instrumental Analytical Chemistry and Metabolomics at the University of Natural Resources and Life Sciences, in Vienna. The research of his group aims at the development and application of analytical methods in mass spectrometry-based metabolomics and ultra-trace analysis applied to a broad range of research topics.
Michel Nielen is principal scientist at WFSR and professor of analytical chemistry at Wageningen University. He obtained his doctorate in analytical chemistry at the Free University of Amsterdam. He is co-founder and co-chairman of the symposium series on Recent Advances in Food Analysis (RAFA) and coordinator of the H2020 project FoodSmartphone. He is (co)author of more than 180 peer-reviewed publications and book chapters.

New Study Reviews Chromatography Methods for Flavonoid Analysis
April 21st 2025Flavonoids are widely used metabolites that carry out various functions in different industries, such as food and cosmetics. Detecting, separating, and quantifying them in fruit species can be a complicated process.
Analytical Challenges in Measuring Migration from Food Contact Materials
November 2nd 2015Food contact materials contain low molecular weight additives and processing aids which can migrate into foods leading to trace levels of contamination. Food safety is ensured through regulations, comprising compositional controls and migration limits, which present a significant analytical challenge to the food industry to ensure compliance and demonstrate due diligence. Of the various analytical approaches, LC-MS/MS has proved to be an essential tool in monitoring migration of target compounds into foods, and more sophisticated approaches such as LC-high resolution MS (Orbitrap) are being increasingly used for untargeted analysis to monitor non-intentionally added substances. This podcast will provide an overview to this area, illustrated with various applications showing current approaches being employed.

.png&w=3840&q=75)

.png&w=3840&q=75)


.png&w=3840&q=75)


.png&w=3840&q=75)


