Integration Errors in Chromatographic Analysis, Part I: Peaks of Approximately Equal Size
LCGC North America
In part I of a two-part series, the author introduces several methods to reduce error in your chromatographic analyses.
Chromatographic situations are created for varying peak resolution and relative peak size. In this case, the peak size of the smaller peak is always at least 5% of the larger peak, and resolution is varied from 4.0 to 1.0. All separations are then integrated, using both area and height, by four different baseline methods: drop, valley, exponential skim, and Gaussian skim. Integration errors are calculated using reference calibration injections. The results demonstrate that the drop and Gaussian skim methods produce the least error in all situations. The valley method consistently produces negative errors for both peaks, and the skim method generates a significant negative error for the shoulder peak. Peak height is also shown to be more accurate than peak area. As the relative peak size increases, resolution below 1.0 will generate unacceptable errors, and resolution greater than 1.5 is necessary to minimize integration errors.
Integration of chromatographic peaks (determination of height, area, and retention time) is the first and most important step in the data analysis part of all chromatography-based analytical methods. This information is used for all subsequent calculations, including construction of calibration curves and calculation of unknown concentrations. Clearly, any error in measurement of peak size will produce a subsequent error in the reported result.
Analysts have several choices for integrating peaks. Figure 1 illustrates the four most common options for drawing the baseline between two peaks: drop, valley, exponential skim, and Gaussian skim. The drop method (Figure 1a) involves addition of a vertical line from the valley between the peaks to the horizontal baseline, which is drawn between the start and stop points of the peak group. The valley method (Figure 1b) sets start and stop points at the valley between the peaks, thus, integrating each peak separately. Skim procedures separate the small peak from the larger parent with separate baselines. The parent peak is integrated from its starting point to the apparent end of the peak group. The small peak's baseline starts at the valley between the peaks, and ends when the signal nears the baseline. The area "under" the skimmed peak is added to the parent peak, not the skimmed peak. This approach has been described also as a tangent integration method, and the small peak variously labeled a skim, shoulder, or rider peak.

Figure 1
Several variations of the skim procedure are possible. Early integration algorithms drew a straight line from the valley to the end of the peak. Figure 1c shows an exponential skim baseline. An exponential function is used to create curvature in the skim line, in an attempt to approximate the underlying baseline of the parent peak. While the exact procedures used to construct this line are a proprietary part of modern software algorithms, they all employ the same basic approach — use an exponential function to draw a curved baseline under the skimmed peak. More recently, another skim procedure has been developed, as shown in Figure 1d. Although referred to as a new exponential skim method, it will be described here as a "Gaussian" skim, because the intent is to more accurately reproduce the Gaussian shape of the parent peak.
For any of these methods, analysts must also choose between measuring peak size by either area or height. It is clear that these integration options are likely to generate significantly different analytical results, and analysts must decide which approach provides better accuracy.
Despite the importance of this issue, clear guidelines are difficult to find in the published literature. Snyder and Kirkland (1) discussed the relative quantitative errors for symmetrical peaks, suggesting that peak height with the drop method was more accurate for poorly resolved peaks, but area measurements were more precise. These recommendations seem to have been ignored largely by the chromatography community, as the drop method with area is used almost exclusively today. Foley (2) published correction factors for pairs of tailed peaks, allowing estimation of their true areas. More recently, Meyer published a series of papers (3–7) dealing with several integration issues. Peaks of varying symmetries, resolutions, and size ratios of as much as 10:1 were prepared by calculation, and integrated using the drop method and area (3), resulting in errors of 40% in some cases. In another study of 10:1 peak ratios, the height method was more accurate if the small peak was eluted first. However, when the small peak is eluted second, the drop method produced a large positive error and the skim method produced a large negative error (4). These general recommendations were extended to even smaller peaks (that is, 1000:1 ratios), although the better integration method for a small second peak varied with the relative peak widths (5). The effects on enantiomeric analysis and calibration curves were reported (6), and a mathematical procedure for quantification of shoulder peaks was developed (7). Again, the recommendation that peak height is more accurate than area has not been put into general practice.
Although these studies provided some excellent general guidance, they only considered the drop method when the first peak was small, and only added straight skimming as an option for a second small peak. The valley and skim methods were not evaluated. When significant errors were noted, explanations for the errors were incomplete or missing, especially for the skim method.
This study seeks to provide some guidelines for analysts by creating several peak resolution situations. The resolution between two peaks is varied from 4.0 to 1.0 through changes in operating conditions. The relative size of the two peaks also is changed from nearly equal size to approximately 5% of the other peak. Each peak pair is then integrated using each of the four baseline options, using both area and height, and integration errors are calculated through the use of reference calibration injections. This study is concerned with situations in which the size of one peak is at least 5% of the other peak. A separate study will report results when one peak is significantly smaller than the other (8).
Finally, all resolution situations described here were created using a liquid chromatography (LC) system. However, the peak shape observed is typical for any well-behaved chromatographic system, so application to gas chromatography (GC) separations should be valid. Although only one data system was used for this study, the author believes that all modern chromatography data systems process data using similar procedures, and only minor differences would be produced by other software packages. The general conclusions still should be valid.
Experimental
Equipment: All chromatographic experiments were performed using a model 1100 HPLC, equipped with a binary pump and degasser, autosampler, column heating compartment, and diode array detector (Agilent Technologies, Wilmington, Delaware). The system was controlled by ChemStation software (Agilent Technologies, Palo Alto, California, Version B.01.03). A 100 mm × 4.6 mm Hypersil C18 column, packed with 5-μm particles, was used for this study.
Reagents: Solutions of nitrobenzene (Sigma Aldrich [St. Louis, Missouri], 99+%, ACS grade) and dimethyl phthalate (Acros [Geel, Belgium], 99%) were diluted in high performance liquid chromatography (HPLC) grade acetonitrile. HPLC grade acetonitrile and water were used for mobile-phase components.
Preparation of test solutions: Individual stock solutions of dimethyl phthalate and nitrobenzene were prepared in acetonitrile, so that when diluted, the maximum peak height observed was near 1 absorbance unit (AU). This situation minimized errors due to detector and solution absorbance nonlinearity.
A solution of both components at approximately equal peak area responses was prepared by appropriate dilution. This mixture was then diluted, first, with a solution of dimethyl phthalate only in acetonitrile at the same concentration as the mixture. A combination of serial and parallel dilutions with these two solutions resulted in a series of test samples with a constant concentration of dimethyl phthalate and varying concentrations of nitrobenzene. These solutions are referred to in the text as "Second Peak Small," because nitrobenzene is eluted after dimethyl phthalate. Similarly, the initial mixture was diluted with a solution of nitrobenzene only in acetonitrile, producing another series of test samples with a constant concentration of nitrobenzene and varying concentrations of dimethyl phthalate. These solutions are labeled "First Peak Small."
Operating conditions: All experiments were conducted at 1.50 mL/min. with an injection volume of 5 μL and a column temperature of 40 °C. Absorbance was monitored at 250 nm, with a bandwidth of 100 nm, using a reference of 360 nm, with a reference bandwidth of 100 nm. Detector settings were adjusted to ensure that an adequate number of data points were collected for each peak, and that detector response time did not influence peak shape. Triplicate injections of each test solution were performed under each of the operating conditions described in the following.
The system was operated under isocratic conditions, using the following concentrations of acetonitrile in water: 45.0%, 67.5%, 75.0%, and 83.0%. These conditions produced resolution between the two analytes (dimethyl phthalate and nitrobenzene) of 4.0, 2.0, 1.5, and 1.0, respectively, as measured by the data system, using the resolution tangent method for the test sample containing approximately equal concentrations. USP tailing factors ranged between 1.05 and 1.10, so this study presents results for typical chromatographic peaks that show only minimal tailing.
Calculations: Each injection was separately reprocessed using the four integration methods, recording peak areas and heights for each injection and integration method. Consistent integration settings were employed to minimize variations between different analysis conditions, and all chromatograms were examined to ensure proper placement of integration start and stop points. In a few cases, examination of the chromatograms indicated that a small interfering peak was present. This peak was integrated appropriately and its value subtracted from the observed value before any calculations were performed.
In addition to the two component mixtures, test solutions containing each analyte individually also were analyzed. These single-component solutions were prepared to match the highest concentration in the test solutions (that is, 100%) and a lower level (5%). Each of these solutions served as a calibration reference.
Analysis under conditions generating a resolution of 4.0 (45% acetonitrile) was used to define the "true" value for each test solution. That is, the relative response of the two components was determined from these data. The values for each test solution are listed in Table I, with the largest peak always assigned a value of 100. The ratio between each component in the test solutions and its corresponding calibration reference produced a response factor. Then, under each set of resolution conditions, and for each integration method, the response for the calibration reference was used with the response factor to calculate an expected peak response (area or height) for those conditions. Comparison of this expected peak response with the actual value allowed calculation of the error for the observed chromatogram. All values reported here represent the percent error between the observed and expected values. A positive error means the observed value was higher than expected; a negative error means some peak area (or height) was lost.
Results and Discussion
The calibration reference method was used to avoid errors due to data collection. Different resolutions between the test peaks were generated by adjusting chromatographic conditions — a decrease in retention produced a decrease in resolution. Under these conditions, peak width also decreased and the peak height increased. However, the data system collects data at a fixed rate, so the area results for smaller peak widths would appear to be artificially smaller and the peak heights would be larger, even though the same quantity was injected. So, simple comparisons of peak areas and heights between different operating conditions would produce inaccurate conclusions. By using a calibration reference solution, the response under each set of operating conditions is adjusted for the change in peak width and height, and subsequent calculation of errors produces values that can be compared across different levels of resolution.
A summary of integration errors is provided in Table II. The table is organized by relative peak size and resolution. For each of the two peaks, average integration errors are listed for both area and height measurements, using each of the integration methods: drop, valley, exponential skim, and Gaussian skim. The values in parentheses represent the standard deviation for each average, based upon three injections. Variability was generally less than 0.5%, indicating adequate precision in both chromatography and integration. This level of precision is typical for any chromatographic analysis based upon an external standard method. Consequently, any errors less than about 2% should be considered negligible, and for the purposes of this discussion, such results represent no error. Also, recognize that by reporting relative errors rather than absolute errors, constant errors will be magnified for the smaller peak.
Resolution was evaluated over the range from 2.0 to 1.0, as this range represented separation conditions for a majority of chromatographic systems. While "baseline" resolution (Rs = 1.5) is considered an ideal compromise between separation quality and analysis time, many methods will require larger resolution values. In other cases, chromatographic limitations force the chromatographer to accept resolution values of 1.0. Lower resolution is generally not desirable.
Integration Errors for the Drop Method
The drop method is probably the most common integration procedure in use. As noted earlier, this technique is conceptually similar to the historic fraction collection procedure, and most analysts would view it intuitively as the best option. However, examination of Table II reveals that, while the drop method often produces smaller errors than, say, the valley method, there are several important situations where the drop method produces significant errors.
In particular, when the difference in peak size becomes larger, the errors for the smaller peak increase. When the second peak is small, its integrated area is higher than expected, while the larger first peak shows a small decrease. These errors generally get larger as the resolution decreases.
There are two important effects that contribute to these integration errors. First, as the relative peak size increases, the apparent valley between the peaks shifts toward the smaller peak. This shift can be shown readily by analyzing perfectly symmetrical (that is, Gaussian) peaks (see reference 4 for a good review of these concepts). The change tends to create a negative error for the smaller second peak and a positive error for the larger peak. Interestingly, the apparent peak width for the smaller peak will also change, which suggests that any data system calculations for the small peak (width, efficiency, and so forth) are likely to be in error. When the peaks are tailed, however, the tail of the first peak extends further into the elution region of the second peak, resulting in an added positive error for the smaller second peak, with a corresponding loss of area from the first peak. This effect is shown in Figure 2, in which single component injections have been overlaid on the mixture chromatogram. Note that tailing from the larger peak adds additional area to the smaller peak. You can see the change in the location of the valley toward the smaller peak. The location (retention time) of the smaller peak also changes.
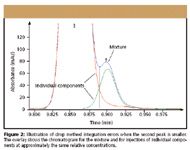
Figure 2
Thus, these two effects will tend to balance each other, with the eventual error being a complex function of relative peak size and tailing. In most cases, the tailing effects will dominate, resulting in a positive bias for the small peak. However, situations can occur where the two effects exactly balance, resulting in no error. Unfortunately, it is difficult to predict such situations. When the first peak is small, the effects of tailing are generally absent, although the influence of the larger peak produces a loss in the first peak's area at high area ratio, probably due to the change in the valley position. These results are qualitatively consistent with earlier work (3). Slight differences with other studies probably reflect the variabilities from working with real chromatographic data rather than artificial peaks.
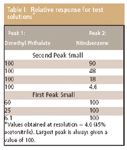
Table I: Relative response for test solutions*
Finally, it is important to note that integration errors for height measurements are smaller than the corresponding area measurements in almost every situation. The use of height for quantitative measurements has been abandoned by many analysts, in the belief that area measurements are either more precise or more accurate. The data presented here do not support such an argument. While area measurements for severely tailed peaks can be more reproducible than height, for most chromatographic systems with only moderate tailing, height measurements offer a clear accuracy advantage for poorly resolved peaks (resolution less than 1.5), as the overlap contribution to peak height from the tailing produces less error than the area contribution. This conclusion is general for all integration methods and relative peak sizes, and is consistent with previous studies (3–5).
Integration Errors for the Valley Method
The data in Table II indicate that the valley method produces negative errors in every resolution situation. The errors are particularly large (greater than 25%) for many combinations. For example, as the second peak gets smaller, the area errors for the large peak are reduced from –28% to –16%, while the area errors for the small peak increase from –26% to –76% at resolution equal to 1.0. Similar trends are observed at resolution equal to 1.5, but the errors are smaller. Comparable results are found when the small peak is eluted first.
It is relatively easy understand these errors by looking at Figure 2, and imagining the baselines being drawn to the valley from the start of peak 1 and from the end of peak 2. The loss of area is particularly important for the smaller peak. The height of the valley above the baseline (due to decreasing resolution) is responsible for the error. Any errors from tailing effects are considerably less important. Again, peak height measurements produce significantly less error than area measurements, especially for resolution better than 1.5, and when the peaks are of similar size. However, even it these situations the errors are often greater than 10%.
It is important to note that the valley method does have some validity in chromatography, although not in the situations described here. In chromatograms with multiple peaks and complex baselines, the valley method might indeed produce less error than the drop method. For example, unresolved matrix components or wandering baselines can create artificially high valleys between peaks, resulting in a significant positive error if the drop method is used. In such situations, the real baseline more closely follows a valley-to-valley path. However, identification of this phenomenon requires careful review of the baseline, and is often missed by a less experienced analyst. When peak widths are significantly different, the more narrow peak can be more accurately integrated using the valley method, although skimming would probably be a better choice (5).

Table II: Integration errors for differing relative peak areas, resolutions, integrated method*
Integration Errors for the Skim Method
The skim integration method normally is applied in situations in which a small peak is resolved partially from a larger peak. Often called a "shoulder" peak, the smaller peak is integrated so that the integrator attempts to follow the baseline produced by the larger peak. Any area "under" the baseline for the skimmed peak is added to the parent peak, while the area above becomes the skimmed peak.
Normally, skimming is performed only on peaks that are poorly resolved. Although there appears to be no formal definition of when a peak becomes a "shoulder" peak, it is proposed here that this definition be reserved for situations where the resolution is less than or equal to one, and the smaller peak area is less than about 50% of the larger peak. In reviewing the data in Table II, clearly, skimming need not be applied when the resolution is 2.0, and it would be unlikely even when the resolution was 1.5. So, the data at resolution equal to 1.0 are of most interest.
The results indicate that exponential skimming of the small peak produces a substantial negative bias, with errors of more than 25% in most cases. For the largest peak ratio (smallest second peak), the area error is greater than 50% when the small peak is second, and almost 40% when the small peak is eluted first. Height errors for these situations are more than 40% and 20%, respectively. Clearly, the exponential skim integration method is not valid for shoulder peaks with a resolution of 1.0, when the shoulder peak size is greater than about 5% of the parent peak.
Skim integration errors have been reported (4,5), but no explanations have been offered. The data obtained in this study provide an explanation, as shown in Figure 3a. The data system sees the end of the peak group as being after the shoulder peak, where the baseline returns to prepeak 1 levels. All of the area under the shoulder peak is added to the parent peak. However, when the parent peak is overlaid with the mixture peak, it is evident that the parent peak actually ends much sooner than what is observed, and the actual response due to the parent peak is considerably lower than what is projected from the skim baseline. This difference results in a loss of area (or height) from the shoulder peak (negative error), and a gain in area for the parent peak (positive error). The error becomes even larger as the shoulder peak becomes smaller or the resolution decreases further. Under these conditions, shoulder peaks could be integrated using the drop method. Although the drop method generates a slight positive error, the magnitude of the errors is considerably smaller than for the skim method.
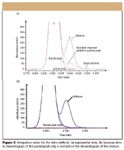
Figure 3
As noted earlier, the Gaussian skim method is a newer approach to dealing with shoulder peaks. In general, the software drops the Gaussian skim line to baseline at a much earlier time than the exponential skim method, whereas in the exponential skim method, the skim line merges with the existing (observed) baseline. The Table II errors suggest that this approach results in much lower integration errors, especially when the second peak is small.
The overlay in Figure 3b reveals that the Gaussian skim line does indeed do a better job of following the actual parent peak. A slight negative area error is produced when the second peak is small, but the magnitude of the error is much more acceptable. The area errors are near -10% when the first peak is small, because the skim line rises too quickly. However, the overall correction is much better than the exponential skim method.
As with the other methods, the height-based errors are smaller than the area-based measurements. No significant error is observed when the second peak is small, and a small negative error may be present when the first peak is small. This fortuitous situation arises because the skim line is at or near the baseline level in the region near the small peak's maximum, and the integration errors disappear. The Gaussian skim–height method thus becomes equivalent to the drop–height procedure for the small peak.
Selected data from Table II are shown graphically in Figures 4 and 5. In Figure 4, integration errors for each method are shown for the situation in which the size of the second peak is varied, relative to the first peak. Error results are organized by peak and integration type (area or height). Although only values for resolution equal to 1.0 are shown, the shape of the curves is similar for resolutions of 1.5 and 2.0. The only significant difference is the magnitude of the error scale. Figure 5 illustrates similar data when the size of the first peak is changed.

Figure 4
In all curves, it is evident that the drop and Gaussian skim methods provide less error in most situations, and height errors are almost always smaller than area errors. While the drop method produces essentially no error for many of the combinations, there are some combinations where none of the traditional methods produces an accurate result. For example, when the second peak is about 5% of the first peak, and the resolution is 1.0, the smallest error (drop method) is still greater than 5%. A negative error of similar value is observed when the small peak is eluted first. While such errors would be considered insignificant in a trace analysis method, if this were a high accuracy analysis, such as a pharmaceutical formulation, this level of error would likely be unacceptable. The Gaussian skim method, however, provides a much better estimate of peak size, when height is measured. Also, it should be noted that the curves suggest a trend in the data at smaller relative peak areas than are discussed here. The integration situation becomes more complicated when the small peak is less than 5% of the large peak. These results are discussed in a separate study (8).

Figure 5
For the large peak (Figures 4a, 4b, 5c, and 5d), integration errors are expected to be smaller or insignificant. Indeed, this is observed in most cases. However, there are some situations where the integration of the large peak produces significant errors, and analysts must be aware of these issues if integration of the large peak is important.
Finally, it should be mentioned that all of the integration errors discussed here arise from the poor resolution between the two peaks. As noted earlier (6,7), errors would occur if the analysis involved a calibration standard with only one peak, but the actual sample included the second peak. If the calibration standards have both peaks present, then errors in the samples are likely to be somewhat less. However, samples rarely will have the same relative size as the standards, so some integration errors are likely to result, although their magnitude would be difficult to predict. Greater errors are likely to occur as one peak gets significantly smaller than the other, as resolution decreases, or as tailing increases.
Conclusions
As expected, integration errors are largely absent when the resolution is 2.0. While none of the integration methods produces a significant error, the drop method is most convenient. For resolutions between 1.5 and 1.0, either the drop or Gaussian skim methods also produces the smallest error when the peaks are of similar size (the smaller peak is at least 5% of the larger peak). The valley method consistently results in large negative errors, particularly for the small peak. The exponential skim procedure generally is invalid under these conditions, as it produces a significant negative error for the shoulder peak. In general, height measurements generate smaller errors than area measurements. So, for the situations described here, the drop method using height would be the best choice. A Gaussian skim procedure would also be an acceptable choice for these situations. However, there is less experience with this new integration method, and its consistent implementation across a variety of software packages may be problematic until more information is obtained.
Finally, it is important to recognize that some errors are beginning to increase even at resolution equal to 1.5, especially when one of the peaks is significantly smaller than the other. For this reason, if minimization of integration errors is important, then minimum resolution should be 2.0, rather than 1.5. When the resolution is 1.0, the magnitude of some integration errors will be unacceptable. Resolution less than 1.0 should be avoided, as the magnitude of the integration errors significantly increases.
References
(1) L.R. Snyder and J.J. Kirkland, in Introduction to Modern Liquid Chromatography (Wiley-Interscience, Hoboken, New Jersey, 1979), pp. 45–48, pp. 543–545.
(2) J.P. Foley, J. Chromatogr. 384, 301–313 (1987).
(3) V.R. Meyer, J. Chromatogr. Sci. 33, 26–33 (1995).
(4) V.R. Meyer, LCGC 13(4), 252–260 (1995).
(5) V.R. Meyer, Chromatographia 40, 15–22 (1995).
(6) V.R. Meyer, Chirality 7, 567–571 (1995).
(7) S. Jurt, M. Schär, and V.R. Meyer, J. Chromatogr., A 929, 165–168 (2001).
(8) M.K.L. Bicking, in press, LCGC.
University of Tasmania Researchers Explore Haloacetic Acid Determiniation in Water with capLC–MS
April 29th 2025Haloacetic acid detection has become important when analyzing drinking and swimming pool water. University of Tasmania researchers have begun applying capillary liquid chromatography as a means of detecting these substances.
Prioritizing Non-Target Screening in LC–HRMS Environmental Sample Analysis
April 28th 2025When analyzing samples using liquid chromatography–high-resolution mass spectrometry, there are various ways the processes can be improved. Researchers created new methods for prioritizing these strategies.

.png&w=3840&q=75)

.png&w=3840&q=75)


.png&w=3840&q=75)


.png&w=3840&q=75)
