Hydrogen Deuterium Exchange Mass Spectrometry: An Emerging Biophysical Tool for Probing Protein Behaviour and Higher-Order Structure
LCGC Europe
This article looks at how hydrogen-deuterium exchange mass spectrometry (HDX-MS), an MS-based labelling approach, has begun to serve as a means for performing routine biophysical analysis.
The higher-order structure (HOS) of a protein (secondary, tertiary, and quaternary structure) is important for proper biological function. Analytically measuring the HOS properties of a biotherapeutic and understanding the relationships between structure and function are important, because they directly influence a drug's efficacy and safety. This article looks at how hydrogen-deuterium exchange mass spectrometry (HDX-MS), an MS-based labelling approach, has begun to serve as a means for performing routine biophysical analysis.
The higher-order structure (HOS) of a protein (secondary, tertiary, and quaternary structure) is important for proper biological function (1). Analytically measuring the HOS properties of a biotherapeutic and understanding the relationships between structure and function are important, as they directly influence a drug's efficacy and safety. The significance of protein HOS was emphasized in a biosimilar draft guidance that the U.S. Food and Drug Administration (FDA) issued in February 2012 (2). Current analytical and structural methods provide a comprehensive understanding of the chemical, physical, and biological characteristics of biologics, from primary structure to HOS (3). Yet detecting changes in protein dynamics and conformation can often prove challenging compared to detecting changes in a primary structure (3,4).
Tools That Yield Information About Protein HOS
More than one biophysical analytical technique is typically used to broadly characterize protein HOS (Figure 1). Multidimensional nuclear magnetic resonance (NMR) and X-ray crystallography can determine protein structure with high resolution. Other structural analysis techniques are more global in information content, but are amenable to high-throughput screening (5–7). These include circular dichroism (CD), differential scanning calorimetry (DSC), Fourier transform infrared (FT-IR) spectroscopy, intrinsic fluorescence, light-scattering spectroscopy, and UV spectroscopy. Size exclusion chromatography (SEC) and analytical ultracentrifugation (AUC) can be used to profile global structural distributions of a protein. Each of the biophysical tools is invaluable for biotherapeutic HOS analysis because it provides information that can be both complementary and confirmatory. Assembling a biophysical, structural analysis package for a therapeutic protein is challenging. One must use structural screening tools that are sensitive enough to detect critical structural attributes as well as more discriminating techniques that enable specific localization of the sites of structural change.
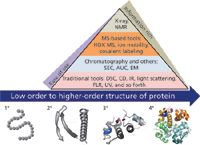
Figure 1: Higher-order protein structure and analytical biophysical tools. Various analytical biophysical tools including DSC, CD, NMR, and AUC are used to characterize higher-order protein structures. HDX-MS is an emerging MS-based method for studying protein dynamics and flexibility.
Limitations on the throughput and applicability of protein size such as those presented by NMR and X-ray crystallography have prompted a quest for complementary analytical tools that can detect local conformation changes with high sensitivity and experimental throughput.
Hydrogen–deuterium exchange mass spectrometry (HDX-MS), an MS-based labelling approach, has begun to serve as a means for performing routine biophysical analysis. HDX is a chemical phenomenon in which labile hydrogens in a protein exchange with hydrogen atoms in a surrounding solvent or gas (8). Certain hydrogen atoms, such as the amide hydrogen (NH) on the protein backbone, exchange with deuterium atoms, and the mass spectrometer detects where in the molecule the exchange takes place: at the protein, peptide, or single amino acid level (9). HDX-MS analysis has been widely used to investigate the flexibility and dynamics of protein molecules (10–14). HDX is capable of monitoring domain interaction, localized protein breathing, and folding or unfolding in the solution phase. Information about protein conformation from an HDX-MS analysis can quantitatively compare a control with an analyte by measuring the relative amount of deuteration uptake (mass increase) as a function of time.
HDX-MS recently gained currency in the biopharmaceutical industry, specifically in the discovery research area, for defining the underlying biology of a cellular process. The technique is also well received by process development organizations for its ability to characterize the HOS of protein drugs. The technique's increasing popularity and versatility were recently highlighted in an article in Chemical & Engineering News (15). The value of HDX-MS was also recently espoused in several industry presentations at the 2nd International Symposium on Higher Order Structure of Protein Therapeutics, held in Baltimore, Maryland, USA, in February 2013 (16). Speakers from leading biopharmaceutical companies (innovators) demonstrated the utility of HDX-MS for studying protein conformation to compare bioprocess changes (before vs. after), assess lot-to-lot differences, discern the effects of post-translational modifications, and establish innovator vs. biosimilar comparability.
Comparability and biosimilarity studies by HDX-MS can reveal whether the protein drugs are consistent at the HOS level. Such detailed information is difficult to obtain because of the considerable time and effort that they require. Indeed, consistency at the HOS level is one of the most important proof-points that biotechnology organizations must demonstrate to regulatory agencies. These can be used as orthogonal techniques that facilitate the approval of process improvements and establish that a biotherapeutic organization has properly controlled the stability of a biotherapeutic product.
The study of protein interactions in drug discovery, particularly antibody–antigen binding studies, is another area in which HDX-MS has been widely applied. Determining the interacting regions (such as epitopes and paratopes) along with their partner molecules constitutes critically important intellectual property for both innovator and biosimilar biotechnology companies. HDX-MS can localize interacting regions by determining which among them are protected from deuterium exchange upon the partner molecule's binding (17). This information can be well correlated with other, common epitope mapping approaches like NMR, X-ray, phage display, peptide libraries, and mutagenesis. HDX-MS provides the proper resolution to distinguish the contact areas (~5 to 15 residues in length). Moreover, it does so within a relatively fast turnaround time of a few days, particularly when using automation and modern HDX informatics tools to meet the demands of higher-throughput screening. In discovery research, having adopted HDX-MS, organizations use MS to fill the therapeutic pipelines, rapidly performing epitope mapping to establish intellectual property for multiple paratope and epitope interactions. The importance of this has been underlined in recent "freedom to operate" court cases which re-examined existing IP with newer technology, allowing or barring entrants into a lucrative market (24).
Studies of insulin, an extremely well-characterized protein, have recently underscored the importance of characterizing HOS to ensure a biosimilar candidate could match an innovator product's efficacy. In one case, the primary structure of a biosimilar insulin was fully characterized. Yet the submission failed when clinical data indicated different pharmacokinetics, a difference that HOS studies may well have predicted (18).
The Need for Improved Instrumentation for HDX Analysis
The hyphenated technique of liquid chromatography–mass spectrometry (LC–MS) has long been used to determine protein identification, post-translational modification, disulphide bond mapping, and various other applications. Improved analytical capabilities enable commercial LC–MS systems to address HDX-MS studies of greater molecular complexity with increasing sensitivity to changes in protein structure, dynamics, and interactions (19–21). These capabilities take the form of sub-2-μm chromatography (ultrahigh-pressure liquid chromatography or UHPLC) and ion-mobility gas phase separation.
A streamlined HDX workflow, from automated sample preparation to data processing, was previously well established (9). Figure 2 illustrates a typical workflow of HDX experiments. Proteins, prepared in H2O as a control, are incubated with D2O to produce a labelling time-course. The labelling reaction is quenched and the labelled protein is injected into an HDX Manager system, a device designed specifically for this task as part of the LC system's sample system and offers unique functions (Waters, nanoAcquity UPLC system with HDX Technology). During the HDX experiments, the entire process of on-line digestion and analytical separation of peptides is tightly controlled by temperature and pH. Sub-2-μm UHPLC separations occur within a cooled environment (0 °C). If the optimal quenching conditions (pH 2.5 and 0 °C) are not properly controlled, the deuterium tends to reverse exchange with hydrogen. Therefore, precise temperature control in a cold pathway and faster separation time are important factors in HDX experiments.
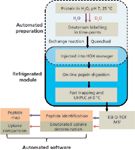
Figure 2: A streamlined HDX workflow. Peptide HDX analysis consists of several steps. The labelled protein is quenched to pH 2.50 and directly injected into a refrigerated module, called the HDX Manager system (Waters). The peptide separation temperature was set at 0 °C, and the digestion temperature can be independently set. Fast desalting and UHPLC separation were performed, and peptides were acquired on a electrospray ionization (ESI) Q-TOF instrument in MSE mode (Waters). Undeuterated peptides (purple arrows) were processed to identify the peptide sequence using MSâMS fragments. Deuterated peptides (red) were used to determine the deuterium uptakes.
Typically, pepsin, an acidic aspartic protease, cleaves a protein into short peptides on an on-line digestion format using a pepsin column. Figure 3 shows the calmodulin sequence coverage map as an example of a pepsin on-line digestion. This calmodulin study achieved high coverage (96.5%) and multiple overlapping peptides, assisting in localizing where conformation is changed.
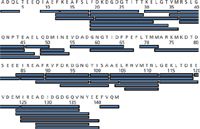
Figure 3: High-sequence coverage of calmodulin by on-line pepsin digestion (96.5%). Each blue bar represents an identified peptic peptide. The calmodulin sequence along with residue number (every fifth residue) is shown in the map. Several overlapping peptides generated by pepsin digestion assist to narrow down the location where the conformation is changed.
Using Automated Software to Cope with the Data Burden
Historically, curating HDX-MS data manually was inefficient because it required expert interpretation and hundreds to thousands of spectral calculations (for peptide analysis). Despite the requisite expertise, however, interpretation is a repetitive process and, like all such processes, it lends itself to automation. Software developers knew that if they were going to make the HDX-MS technique attractive to industry, they must develop an informatics tool that systematically selects spectra by applying predetermined criteria and then measuring the mass change of the deuterated forms (22). Such software has made HDX-MS a highly practicable technique even for biologists and biochemists.
Yet the mere availability of tools for biologists and biochemists to process HDX data isn't enough. Data displays must be intuitive, and they must directly enable recognition of regions where structural differences exist. Consistent with that requirement, recent software versions often show conformation as it relates to differences between two states of the protein sequence, rather than as a spectral readout from the instrument. Figure 4 illustrates various data displays in DynamX HDX informatics tools (Waters). Processed information with raw spectra, the identified peptides were extracted at a particular retention time. The software automatically calculates the amount of deuteration and displays results via several visualization tools: deuterium uptake curves, sequence coverage heat maps, and difference (butterfly) plots.
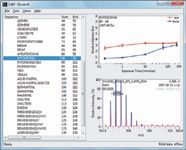
Figure 4: Automated data processing is possible for faster data turn-around time. DynamX software is shown as an example of peptide HDX data analysis. The automated informatics package efficiently calculated the deuterium uptakes of identified peptides (left panel) from extracted spectra (right, bottom panel) and display the deuterium uptakes in the uptake plot (right, top panel). In this calmodulin study, the different deuterium uptakes were observed between apo (red) and holo (blue) forms.
Recent software development has enabled the mapping of HDX-MS results onto three-dimensional (3D), NMR, or crystal structures of proteins as coloured "heat" maps. In Figure 5, HDX-MS data for calmodulin, conformationally sensitive to calcium ion binding (apo: calcium free; holo: calcium bound), is represented with HDX data on 3D structures. Such intuitive plotting schemes offer a rapid, visual comparison of different states, such as bound and free forms of the proteins of interest. Additionally, a difference plot provides a rapid visual overview of the average, relative, fractional exchange difference for all peptides in each labelling time-point, highlighting at a glance where the active regions of the protein can be localized. Thus, the entire polypeptide backbone of each form can be compared in terms of both spatial and temporal information.
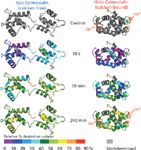
Figure 5: Effective HDX data visualization on a 3D structure of protein. Calmodulin apo and holo forms were used as an example of a HDX heat map on 3D structures. Relative % deuterium can be compared by colour differences between apo (1CFD) and holo (1PRW) forms as well as between the time-course.
Advanced Work and Future Directions
As more complex proteins are analysed, it becomes increasingly useful to include ion mobility separations to minimize interfering ions. Ion mobility spectrometry (IMS) provides an orthogonal gas-phase separation, based on the charge, shape, and mass of molecules, that is capable of detangling ions that in MS detection share the same mass-to-charge ratio (20). Figure 6 illustrates the ion mobility separation of two peptides of similar mass that were eluted at the same retention time. The two species overlapped without IMS separation enabled (bottom panel). By enabling the IMS separation, the two labelled peptides were successfully isolated from each other, making it possible to improve the robustness of peptide detection and measures of deuterium uptake for each peptide.

Figure 6: Isolating interfering ion clusters by charge state in ion mobility separation. The two deuterated peptides from BSA, Peptide 1 (ASIQKFGERALKA, z = 2, top, right panel) and Peptide 2 (AVEGPKL, z = 1, middle, right panel). The bottom panel shows the spectrum that two peptides were interfered each other when ion mobility was off.
Electron transfer dissociation (ETD) is another MS technique with the potential to increase the resolution for assigning regions of structural difference. Recent studies demonstrate that HDX-MS applications analyse deuteration to the level of single amino-acid residues (23). Future efforts to use this approach will provide the increased spatial resolution combined with the classical, bottom-up HDX-MS workflow.
Summary
The ability of novice and experienced researchers to conduct HOS studies with HDX-MS technology has benefitted greatly from combined advances in separations, automation, MS, and informatics. The wider scientific dissemination of what is achievable for protein structure analysis has yielded a quantum leap in the demand for — and development of — HDX-MS. Like a genie, once released from its bottle, this powerful set of capabilities will not easily be contained. Indeed, it will only continue to grow in application and, in doing so, further inform our understanding of protein biotherapeutics.
Joomi Ahn is a principal scientist in pharmaceutical life sciences at Waters Corporation in Milford, Massachusetts, USA. She joined Waters in 1999 and has various experience applying LC–MS technologies in biopharmaceutical characterization applications. She received her Ph.D. in chemistry and chemical biology from Northeastern University in Boston, Massachusetts, USA. Her research interests include the understanding of proteins and protein conformation with HDX-MS technology.
Dr St. John Skilton is a life sciences specialist at Waters, concentrating on the biologics and "omics" fields. He has a background in GC, LC, MS, analytics, and supporting laboratories in adopting new analytical technologies. He helped coordinate the biologics element of the introduction of the first commercialized HDX platform to study protein interactions, working closely with Dr Ahn to translate theory into an understandable reality.
"MS — The Practical Art" Editor Kate Yu joined Waters in Milford, Massachusetts, USA, in 1998. She has a wealth of experience in applying LC–MS technologies to various application fields such as metabolite identification, metabolomics, quantitative bioanalysis, natural products, and environmental applications. Direct correspondence about this column should go to "MS: The Practical Art", LCGC Europe, 4A Bridgegate Pavilion, Chester Business Park, Wrexham Road, Chester, CH4 9QH, UK, or e-mail the editor-in-chief, Alasdair Matheson, at amatheson@advanstar.com
References
(1) G. Scapin, Curr. Pharm. Des. 12, 2087–2097 (2006).
(2) FDA, CDER, CBER, Biosimilar draft guidance, 2012.
(3) A. Beck et al., Anal. Chem. 85, 715–736 (2013).
(4) A. Beck et al., Anal. Chem. 84, 4637–4646 (2012).
(5) A.W. Vermeer et al., Biophysical Journal, 79, 2150–2154 (2000).
(6) H. Liu et al., Immunol. Lett. 106, 144–153, (2006).
(7) J.F. Neault et al., J. Biomol. Struct. Dyn. 25, 387–394 (2008).
(8) A. Hvidt and K. Linderstrom-Lang, Biochim. Biophys. Acta 14, 574–575 (1954).
(9) J.R. Engen et al., in Encyclopedia of Analytical Chemistry, R.A. Meyers, Ed. H(Wiley, 2011), pp. 2–17.
(10) T.E. Wales and J.R. Engen, J. Mol. Biol. 357, 1592–1604 (2006).
(11) C.K. Woodward, Curr. Opin. Struct. Biol. 4, 112–116 (1994).
(12) Y. Bai et al., Science 269, 192–197 (1995).
(13) J. Fang et al., J. Mol. Biol. 398, 40–53 (2010).
(14) C.M. Hebling et al., Anal. Chem. 82, 5415–5419 (2010).
(15) A.M. Rouhi, C&EN 90(17), 16–17 (2012).
(16) https://m360.casss.org/event.aspx?eventID=37952.
(17) Q. Zhang et al., Anal.Chem. 83, 7129–7136 (2011).
(18) L. Heinemann and M. Hompesch, J. Diabetes Sci. Technol. 5(3), 741–754 (2011).
(19) T.E. Wales et al., Anal. Chem. 80, 6815–6820 (2008).
(20) R.E. Iacob et al., Rapid Commun. Mass Spectrom. 22, 2898–2904 (2008).
(21) R.E. Iacob and J.R. Engen, J. Am. Soc. Mass Spectr. 23, 1003–1010 (2012).
(22) D. Houde et al., J. Pharm. Sci. 100, 2071–2086 (2011).
(23) K.D. Rand et al., Anal. Chem. 81, 5577–5584 (2009).
(24) C.G. Sandercock and U. Storz, Nat. Biotechnol. 30(7), 615–618 (2012).

New TRC Facility Accelerates Innovation and Delivery
April 25th 2025We’ve expanded our capabilities with a state-of-the-art, 200,000 sq ft TRC facility in Toronto, completed in 2024 and staffed by over 100 PhD- and MSc-level scientists. This investment enables the development of more innovative compounds, a broader catalogue and custom offering, and streamlined operations for faster delivery. • Our extensive range of over 100,000 high-quality research chemicals—including APIs, metabolites, and impurities in both native and stable isotope-labelled forms—provides essential tools for uncovering molecular disease mechanisms and exploring new opportunities for therapeutic intervention.
New Guide: Characterising Impurity Standards – What Defines “Good Enough?”
April 25th 2025Impurity reference standards (IRSs) are essential for accurately identifying and quantifying impurities in pharmaceutical development and manufacturing. Yet, with limited regulatory guidance on how much characterisation is truly required for different applications, selecting the right standard can be challenging. To help, LGC has developed a new interactive multimedia guide, packed with expert insights to support your decision-making and give you greater confidence when choosing the right IRS for your specific needs.

.png&w=3840&q=75)

.png&w=3840&q=75)


.png&w=3840&q=75)


.png&w=3840&q=75)


