HPLC Columns — Q's and A's
LCGC North America
In this month's "Column Watch," Ron Majors answers HPLC column questions posed by readers and others.
In this month's "Column Watch," Ron Majors answers HPLC column questions posed by readers and others. Questions on phase-collapse in reversed-phase HPLC, injection solvent mismatch, retention behavior, reversing column flow, ghost peaks, monolith columns, and void volume markers are answered in detail, some with examples of similiar behavior. Readers are encouraged to submit questions on column and sample preparation technology, and they will be covered in future "Column Watch" articles.
Occasionally, I get an e-mail message or letter from a reader asking a question about one of my columns or about chromatography in general. Also, in my travels, I frequently hear the same questions from multiple people. So perhaps others might have similar questions. It has been a long time since I have featured a general question and answer format in "Column Watch," so this month, I will dust off my files and provide some "real world" questions and answers. I will keep this set of questions directed to high performance liquid chromatography (HPLC) topics. Here, I will show some actual examples, not always the same, but similar to those experienced by the readers. Many are reluctant to provide their own chromatograms, especially if they show the analysis of a proprietary compound.

Ronald E. Majors
Q: I am having trouble with my reversed-phase chromatography retention times changing dramatically when I run a steep gradient of 0–100% acetonitrile in water. Retention times generally decrease and the peaks sometimes get broader. I am running samples containing polar and nonpolar analytes and am using an octadecylsilane (C18) column with a carbon loading of 21%. Do you have any ideas on why this is occurring?
REM: There are many reasons why gradient retention times can change from run-to-run. By dramatic, I assume that you mean 20 or 30%, not 1–2%. Small changes can indicate that you are not waiting long enough after the conclusion of the gradient for the column to equilibrate before making the next injection. Remember, to ensure complete equilibration (regeneration), you should flush your column with 5–10 column volumes before the next injection. For a 15 cm ×4.6 mm column, the column volume is approximately 1.5 mL. Also, take into account the gradient delay volume (dwell volume) of your instrument because the mobile phase composition you might read on your computer screen represents the composition where the solvents come together after the pumps. If you have a modern binary, high-pressure pumping system, this volume is probably only a milliliter or two. However, if you have a ternary or quaternary low-pressure pumping system, the volume will be larger. In an earlier article (1), I discussed the issue of dwell volume — so you might consult that article if you are unsure how to measure it.
Column overload can cause a decrease in retention times, although not usually dramatic. If you are injecting microgram quantities on a standard analytical column, overload is not usually a concern. However, if you are injecting several hundred micrograms per injection or even milligrams, then column overloading could occur. When overload occurs, though, peaks generally are skewed, mostly fronting. As a test, decrease your injection mass and see if your peaks are still broad.
Other, more instrument-related reasons for changing retention times are inconsistent on-line mobile phase mixing or delivery, varying column temperature, malfunctioning check valves, pump cavitation, and pumps not delivering stable flow.
One column-related phenomenon that has caused many chromatographers to shake their heads is phase-collapse. You mentioned that you are running a 100% gradient with a C18 column that has a fairly high carbon loading. Most likely, the phase is endcapped so the surface is quite hydrophobic. For reversed-phase columns to function correctly, the stationary phase must be solvated so that analytes can interact with the hydrophobic C18 moiety. Sometimes, when the %B gets low (say, below 5% or 10% depending upon the particular stationary phase), the mobile phase is very hydrophilic, mostly water. As the mobile phase approaches pure water, the hydrophobic C18 does not like the hydrophilic water environment (much like mixing oil and water), the acetonitrile within the stationary phase is expelled into the water-rich mobile phase and the C18 phase folds over on itself and collapses. The C18 likes itself better than it likes the water (like–like relationship). The actual phenomenon is more like stationary phase dewetting within a silica pore but, for our purposes, the term phase-collapse will suffice. When a hydrophobic phase is in this state, it no longer functions as an efficient packing material. Because the analytes see a lesser amount of stationary phase, their retention times decrease and the peaks can become broad (although this is not necessarily so). Before the phase can function normally, it must be treated with a solvent containing a higher amount of acetonitrile so that it can regain its solvated state. Running a 50% acetonitrile mobile phase for a few minutes should resolvate the phase. However, as soon as you return to 100% water (your initial mobile phase composition), the desolvation process starts again. Remember, phase collapse does not destroy the stationary phase — once it is resolvated, it returns to normal if used with a sufficient amount of water-soluble organic solvent.
There are several solutions to phase collapse. The simplest is to use a sufficient amount of organic solvent in the mobile phase to ensure that solvation occurs. For most phases, about 5% organic solvent is enough, but for very dense, high-coverage C18 phases, even 10% organic solvent might not be enough. As a rule of thumb, for a C18 silica gel (400 m2/g) bonded phase, if the carbon content of a C18 phase is greater than 20% (coverage greater than 4 μmol/m2 ), watch for signs of phase collapse at low %B. To get around phase-collapse, polar-embedded alkyl phases are available that can be solvated, even at 100% water. Some hydrophilic, polar-endcapped, or non-endcapped short alkyl phases or wide-pore materials with low phase density will not show phase-collapse. For further reading on this subject, consult reference 2. A nice pictoral example of phase-collapse can be found there.
Q: I am looking for impurities at the 0.1% level in my pharmaceutical tablet. My sample is not very water-soluble but I can dissolve it in hot acetonitrile. However, when I inject this dissolved sample (50 μL), the main peak is very broad and it is difficult to observe impurity peaks around the main peak. I am using a C8 column (100 mm ×2.1 mm) with an isocratic 55:45 water–acetonitrile mobile phase and mass spectrometry (MS) detection. What do you suggest?
REM: From a chromatographic viewpoint, it is not a good idea to inject a sample in a 100% concentration of an organic solvent like acetonitrile. Because acetonitrile is a very strong solvent in reversed-phase HPLC (which is why we use it as the "B" solvent in a gradient), injecting a large amount like 50 μL will cause the sample analytes to quickly migrate down the column until the acetonitrile gets diluted out and the resulting weaker mobile phase slows their movement. By then, the peaks are broadened sufficiently so that it is difficult to refocus them, especially in an isocratic environment. In your case, your mobile phase was water-rich, and a large volume of acetonitrile could not be tolerated. Sometimes, if the mobile phase is organic-rich, a larger volume injected might be injected with less of a detrimental effect. Also, you are using a 2.1-mm i.d. column and large injection volumes of any solvent potentially could cause volume overloading.
Figure 1a shows a similar situation in which 30 μL of two compounds, caffeine and salicylamide, dissolved in acetonitrile, were injected into a C18 reversed-phase column (150 mm × 4.6 mm) using an 82:18 water–acetonitrile mobile phase. Note that injection in this solvent caused peak shape problems. Here, the situation was even more difficult than yours because the mobile phase had a higher percentage of water. By injecting in the chromatographic mobile phase (Figure 1b), the problem went away. If possible, one should try to inject in the mobile phase or better yet, a weaker solvent (more water) than your mobile phase. In the latter case, the analytes are focused at the head of the column in the weaker solvent and perhaps come closer to the ideal of an infinitely small injection band. If the sample can be diluted with water to weaken the injection solvent strength, then perhaps a larger volume can be injected without causing undue band broadening.
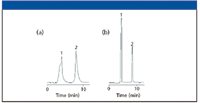
Figure 1: Chromatograms obtained using (a) 100% acetonitrile and (b) mobile phase as the injection solvent. Column: 150 mm x 4.6 mm, 5-μm dp Zorbax StableBond SB-C8; mobile phase: 82:18 waterâÂÂacetonitrile; injection volume: 30 μL. Peaks: 1 = caffeine, 2 = salicylamide.
Sometimes, though, one cannot dilute their sample with water because it can fall out of solution. Perhaps you can substitute methanol for your sample solvent rather than acetonitrile. Methanol is a somewhat weaker organic modifier than acetonitrile and a bit more can be tolerated by the reversed-phase column.
One solution to your problem would be to inject a smaller sample size, say 5 μL. The smaller volume of acetonitrile might be tolerated by the column and minimize injection band spreading. However, when doing impurity analysis, such a major reduction in sample volume might not be feasible when looking for 0.1% impurities.
Another suggestion would be to try a larger column internal diameter (say, 4.6 mm). The larger column should be able to tolerate more organic solvent. Of course, impurity peaks at the 0.1% level can be more difficult to detect than for the 2.1-mm column but if they are well resolved and you are using MS detection, you might be able to see them adequately. You might have to slow the flow rate down because some MS electrospray interfaces cannot tolerate the 1–2 mL/min flow rates, typical of a 4.6-mm i.d. column.
Q: I was having problems with retention on my C8 column so I changed to a C18 phase instead. However, the retention was even less. I always thought that a C18 phase retained compounds longer because of its longer alkyl chain length. Isn't that true?
REM: In reversed-phase chromatography, retention is governed more by the amount of carbon bonded to the surface of the silica packing material than by the alkyl chain length. True, if both a C8 and a C18 phase have the same coverage in micromoles per meter squared on the same base silica, then the longer chain C18 should show more retention. However, a lightly loaded C18 (say, 5.6% carbon) would show less retention under the same conditions for the same analyte than a higher loaded C8 (say, 14% carbon). Note that the total carbon content of the column packing will consist of the main bonded phase (say, C8) plus the amount of endcapping carbon (usually C1 or similar). Endcapping is used to remove residual silanols that can contribute to retention, especially if polar compounds that can interact with the Si-OH are present. Endcapping can provide an additional percent or two of carbon to the packing. Sometimes in the case of an uncapped reversed-phase column, a mixed mechanism occurs — hydrophobic interaction of the carbon-containing portions of the analyte with the alkyl chain and polar interactions between the polar functional group on the analyte and the residual silanol group on the C8 packing.
Q: I read that if an HPLC column begins to display high back pressure that one can reverse the flow and the pressure goes down. Can I reverse the flow on my column without harming it?
REM: The simple answer to your question is "yes." Because most modern HPLC columns containing rigid spherical particles are packed at a very high pressure, much higher than the pressure at which you will use it, the packed bed itself is usually quite stable and can withstand flow in either direction.
However, the more complete answer depends upon what is causing the buildup of pressure. If the pressure is a result of the buildup of particulate matter on the inlet frit, then by reversing the column you might be able to dislodge these particulates. Particulates can originate from your sample (especially if not filtered), from the pump (seal-wear fragments), or from the injector (rotor wear), and as these fine particles move downstream, they will stop at the first place at which they meet a resistance (that is, the inlet frit of your column). If you suspect that particulates are your problem, pass at least 50 column volumes of mobile phase through the column before reattaching it to your chromatograph. Whatever you do, when you reverse (backflush) the column, do not attach the inlet to the detector because the particulates can be flushed into the flow cell and perhaps lodge there instead.
If the particles lodge in the porous matrix of the inlet frit, they might not be so easy to dislodge by reversing the flow, especially if they have set up a "filter bed." Replacing the inlet frit is possible on some columns, and manufacturers provide replacement frits and instructions on how to change them. Frits that are built into the endfitting can be changed by replacing the entire endfitting. Frits that are pressed into the column are not removed easily. Because often the inlet frit is in contact with the packing, there is a good chance when the frit or endfitting is replaced that the packed bed will be disturbed. If some packing is removed accidentally, the column efficiency will be affected in a detrimental way.
If the high-pressure problem is not caused by particulates, then reversing the flow might not help at all. If contaminants have built up on the packing itself and are beginning to block the flow and cause a pressure increase, then back flushing the column with mobile phase probably would not flush these contaminants away. What types of contaminants can these be? Well, perhaps you have some insoluble substances that are lodged in the packing at the column head. Proteins from a biological sample come to mind. If polymeric materials or insoluble additives that can be present in your sample are accumulating at the column head, this could cause a buildup of back pressure. Sometimes buffer can precipitate in the inlet, especially if used at high concentration and when a high percentage of organic solvent is present at the end of a gradient. In these cases, you might have to use stronger solvents to flush the column. I wrote a more detailed article on cleaning reversed-phase columns (3), so you might consult that article for further details.
One important point — some columns have a suggested flow direction. These columns will have an arrow pointing to the outlet of the column. Reversing the column might not be advisable without checking the column's manual or data sheet. Sometimes, the manufacturer will use different porosity frits on the inlet and the outlet. The outlet frit must have a porosity smaller than the smallest particle in the particle size distribution of the column packing. Otherwise, the particles would pass through the frit. The smaller the particle, the finer the porosity of the metal frit. On the inlet side, a smaller porosity frit will plug faster than a larger porosity frit. So, a manufacturer can choose to use a larger porosity frit that can have pores larger than the smallest particle in the distribution to prevent plugging. If one reverses such columns, then there is a chance that some of the particles could be flushed from the column. So check with the manufacturer's support line or website to see if their columns can be reversed.
Sometimes, when a column shows a high pressure, there is an accompanying loss of efficiency, split peaks, increased tailing, or some other chromatographic problem. Many times, the column has developed a void for some reason. One such reason would be that the column was run at a pH that was too high. Figure 2 shows a case in which the chromatographer used the column at pH 11, well beyond the upper limit of most bonded silica columns. Although the initial peak shape in Figure 2a was acceptable, after 30 injections, the column showed signs of early death.
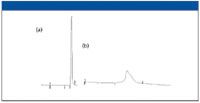
Figure 2: Formation of a column void due to silica dissolution at high pH. Shown are (a) the initial chromatogram and (b) a chromatogram obtained after 30 injections. Mobile phase: 50:50:0.2 waterâacetonitrileâtriethylamine (pH 11).
Silica gel does have a finite solubility at high pH. Hydroxide ion begins to attack the underlying silica around pH 9 or so. The attack is hastened at high temperature and in certain inorganic buffer systems such as phosphate. If the sample requirements dictate separation conditions at a high pH, use columns made for high-pH work, such as polymeric, zirconia, silica hybrid, or bidentate structure columns. Other reasons that a void might form would be that the packed bed was unstable and settled during use, especially at a high flow rate and pressure; the column had repeated injections of a sample in a basic solvent; or silica packing leaked through a faulty outlet frit. A column with a void is difficult to repair and should be replaced.
To prevent analytical column plugging, it is advisable to use a guard column. Guard columns should contain with the same packing as the analytical column. With modern designs, there is little or no loss of efficiency. Guard columns cost a fraction of the price of a new analytical column and can be installed easily between the injector and the analytical column. Some guard columns are even integrated with the analytical column. The replacement frequency is a trial-and-error decision based upon how clean one's samples or mobile phases are.
Q: During method development, I experienced a strange phenomenon. A phantom peak showed up in the middle of a chromatogram that I was not expecting. To make a long story short, it turned out to be a compound from an earlier injection. How do I prevent this from happening in the future?
REM: Phantom or ghost peaks showing up in one's chromatogram can result from unknown impurities from the matrix, degradation products from the sample, adducts, or myriad other possibilities. Most of the time, they are unexpected and often unwelcomed. We experienced a similar case when developing a simple isocratic method for a popular over-the-counter pharmaceutical. The formulation consisted of a mixture of an antihistamine, chlorpheniramine maleate, and a decongestant, pseudoephedrine. The chlorpheniramine reduces allergy symptoms and the decongestant constricts blood vessels in the nasal air passages such as the nose and sinuses. This first sample injected to establish a retention time was the chlorpheniramine maleate. Figure 3a shows the initial chromatogram that showed a single sharp peak eluted near the void volume. After 7 min, we figured that everything had been eluted, so we prepared to inject a pure sample of the second component by adding a controlled amount to the initial solution. The resulting chromatogram can be seen in Figure 3b. However, this time, we allowed the chromatogram to develop a bit longer, for a total of 15 min. The chromatogram resulted in the original peak, a new sharp peak with a retention time of 4.5 min, and a third broad peak with a retention time of approximately 11 min. The third peak was very broad, showing only 779 plates, which was quite surprising because the second peak was much narrower, displaying almost 10,000 theoretical plates. This led us to reinvestigate our initial chromatogram, and upon reinjection and allowing a longer running time, an additional peak appeared that gave a UV scan showing it to be chlorpheniramine. Thus, the phantom peak was actually from the first injection.
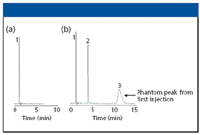
Figure 3: Phantom peaks in the separation of an over-the-counter antihistamine formulation. Sample: (a) chlorpheniramine maleate, (b) chlorpheniramine maleate and pseudoephedrine. Column: 150 mm x 4.6 mm, 5-μm dpExtend-C18; mobile phase: 40:60 10 mM triethylamine (pH 11):methanol; flow rate: 1.0 mL/min; temperature: ambient; detection: UV absorbance at 254 nm. Peaks: 1 = maleate (5922 plates), 2 = pseudoephedrine (9879 plates), 3 = chlorpheniramine (779 plates).
So, in isocratic elution, the presence of a broad peak near a narrow peak should give one an indication that the broad peak does not belong. In normal chromatographic band broadening, peaks will get broader with time but rarely does their plate count decrease so dramatically, as noted earlier. For gradient elution, most peaks in a chromatogram have the same width. If the final mobile phase composition is not high enough to elute an analyte of interest and later the gradient is run to a higher strength final mobile phase composition, the analyte will still show a narrow peak width because it sits at the head of the column until the mobile phase composition is high enough to elute it.
Another example of ghost peaks showing up in the chromatogram was observed many years ago and is illustrated in Figure 4. While running a reversed-phase separation using a water–methanol gradient at relatively high sensitivity in the low UV, some extraneous peaks began showing up in the chromatogram. At first, it was attributed to carryover from previous injections but when the peaks kept appearing without any more injections, we suspected that something else was wrong. Run after run, the pattern kept repeating. It appeared that the ghost peaks came from the solvent itself. However, was the water or the methanol the culprit? A simple experiment was conducted. At the beginning of the gradient there was a column regeneration step in which 20% methanol in water was run through the column. When the regeneration time was increased to twice as long, the ghost peaks were twice as high; when it was increased to three times as long, the ghost peaks were three times as high. Thus, this simple experiment led us to believe that the peaks were coming from the water. Indeed, when we asked the technician where the water came from, he replied that it was from a deionizer system that used resins. Our guess was that there were traces of residual organics (perhaps monomer) that were bleeding from the polystyrene–divinylbenzene ion exchanges that were used.
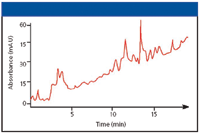
Figure 4: Ghost peaks appearing when no sample is injected. Gradient: 20â100% methanol in water; detection: UV absorbance at 210 nm.
Q: How does a monolith column compare to a packed HPLC column?
REM: A monolith column is actually synthesized as a continuous polymer rather than as discrete particles. A monolith can be an inorganic polymer like silica or an organic polymer such as a methacrylate copolymer. Silica gel monoliths have been compared extensively to packed silica columns. The commercial monoliths have about the same efficiency as a 4-μm packed column. They can be derivatized just like silica particulates but so far, only C8 and C18 phases have been made available. The major advantage of silica monoliths is that their permeability is higher than packed columns of the same efficiency. Thus, the columns show about 50% of the pressure compared with a silica column run at the same linear velocity. Columns can be coupled in series and the combined columns can generate more theoretical plates at the same column head pressure. To realize the same speed as a short, packed particulate column, monoliths are run at higher flow rates. For a 4.6-mm i.d. column, flow rates of 3–5 mL/min are not uncommon. Silica monoliths are not available widely because they are tied up in patent exclusivity.
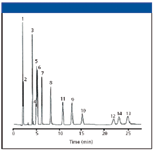
Figure 5: Analysis of purines and pyrimidines. Column: 250 mm x 4.6 mm, 5-μm dpUltra PFP, 100-à pore size; mobile phase: 50:50 0.001% formic acid in waterâÂÂmethanol; flow rate: 1.0 mL/min; temperature: ambient; detection: UV absorbance at 260 nm; injection volume: 10 μL; sample concentration: 100 μg/mL. Peaks: 1 = cytosine, 2 = 5-methylcytosine, 3 = uracil, 4 = uric acid, 5 = hypoxanthine, 6 = xanthine, 7 = thymine, 8 = purine, 9 = 6-methylpurine, 10 = theobromine, 11 = ethyluracil, 12 = 1,7-dimethylxanthine, 12 = theophylline, 13 = propyluracil. (Reprinted from reference 5 by permission of Restek Corporation, Bellefonte, Pennsylvania.)
Polymeric monoliths also are available commercially from several suppliers. From most of the work that I have seen, their main applications area is in the separation of biomolecules. They are available in disks similar to membrane filters, columns, sheets, and larger process column sizes (up to 8 L). Polymer monoliths have some of the same chemical advantages of polymer particulate columns, namely, a wider pH range than silica monoliths.
Q: Uracil has been recommended as a void volume marker in reversed-phase chromatography. Yet, when I add uracil to my sample, it seems to come out just after a baseline upset that I think is the "true" void volume. Can this be correct?
REM: The question about the best compound to use for determination of a column's void volume (V0) has been around for years. Even the standard reference material 870 "Column Performance Test Mixture for Liquid Chromatography" (National Institute of Standards and Technology, Gaithersburg, Maryland) for testing reversed-phase columns has uracil as its void marker. The International Union of Pure and Applied Chemistry's Analytical Chemistry Division has published a recommendation on "Hold-up Volume Concept in Column Chromatography" (4). In their definitive paper on the subject, they reviewed the various direct and indirect methods to measure the hold-up volume (void volume). Direct methods include the use of inorganic salts such as sodium nitrate or sodium nitrite and organic compounds such as uracil. UV-active inorganic salts would seem to be an ideal marker but the holdup volume depends upon the experimental conditions (that is, mobile phase composition, ionic strength, and sample size) and on the ionic volume of the salt. This dependency has been interpreted as sample exclusion (due to electrostatic or steric effects) from the pores of the packing material that prevents the salt from fully exploring the intraparticle volume. They state that "the use of organic ions or high-polar analytes for hold-up volume determination should be avoided because most of them are retained to some extent, particularly in reversed-phase LC with mobile phases containing moderate or high percentages of water." Indirect methods of measurement of the void volume include the method of column weight in which the column is filled and weighed successively with a light density solvent and a heavy density solvent. From the volume of mobile phase in the column, the hold-up volume can be calculated. Needless to say, this is not a very convenient method. Another method is to use a homologous series of solutes in which the alkyl portion of the series is increased and the retention measured. Because there is a linear relationship between the log of retention and the number of carbon atoms (and making certain assumptions), by determining the intercept of the straight line, the void volume can be determined. The use of isotopically labeled compounds such as the injection of deuterium oxide (D2O) into a reversed-phase system could perhaps be closer to the "real" value. However, even the retention of D2O varies with the mobile phase composition in reversed-phase chromatography. Finally, the injection of one component of the mobile phase was proposed because such action will result in a minor baseline disturbance, but even this disturbance varies with composition. So, even the authorities agree that there is no clear and simple way to get an accurate value of the void volume.
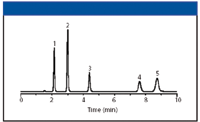
Figure 6: Analysis of purines and pyrimidines using a silica-based reversed-phase column. Column: 150 mm x 4.6 mm, 5-μm dp standard silica-based C18; mobile phase: 20 mM potassium phosphate (pH 7.0); flow rate: 1.5 μL/min; temperature: 35 °C; detection: UV absorbance at 254 nm; injection volume: 10 μL; sample concentration: 10 μg/mL each analyte. Peaks: 1 = cytosine, 2 = uracil, 3 = guanine, 4 = thymine, 5 = adenine. (Reprinted from reference 6 by permission of Supelco (Sigma Aldrich), Bellefonte, Pennsylvania.)
However, a quick search of the internet seems to agree that uracil is the standard void volume marker compound. However, that does not mean that uracil is not retained on some columns. Uracil is sparingly soluble in water and is insoluble in alcohol, so one might expect it to have some slight retention based upon its solubility alone. Because its pKa is 9.45, it is protonated at most pH values used in reversed-phase LC. Thus, because it is ionized at these pH values, it would tend to be eluted quickly from most columns and it does. Figures 5 and 6 downloaded from manufacturers' websites clearly show that uracil is retained on these two reversed-phase columns. Judging from these two experiments, cytosine would be an even better marker!
So, it seems that there is no universal compound that can be used easily as the void volume marker. Until there is a replacement, uracil seems to be the most accepted compound, even though it can be retained partially. It would seem to me that a baseline disturbance before the elution of uracil might be a better marker but such disturbances are difficult to see on some detectors and are not always present. Uracil, though, will show up on most detectors.
Conclusion
In this installment of "Column Watch," I have explored some actual practical questions encountered by readers and others. In the future, I will have a similar coverage of gas chromatography questions that have been posed.

Erratum
Ronald E. Majors "Sample Prep Perspectives" Editor Ronald E. Majors is business development manager, Consumables and Accessories Business Unit, Agilent Technologies, Wilmington, Delaware, and is a member of LCGC's editorial advisory board. Direct correspondence about this column to "Sample Prep Perspectives," LCGC, Woodbridge Corporate Plaza, 485 Route 1 South, Building F, First Floor, Iselin, NJ 08830, e-mail lcgcedit@lcgc-mag.com
References
(1) R.E. Majors, LCGC 21(12), 1124–1133 (2003).
(2) M. Przybyciel and R.E. Majors, LCGC 20(6), 516–523 (2002).
(3) R.E. Majors, LCGC 21(1), 19–26 (2003).
(4) J.A.G. Dominguez and J.C. Diez-Masa, Pure Appl. Chem. 73, 969–992 (2001).
(5) Restek Application Note 59118A, "Allure PFP Propyl and HPLC Columns Provide Improved Analyses of Basic Compounds," Restek Corp., Bellefonte, Pennsylvania.
(6) M.Ye and H. Brandes, Supelco Technical Report, publication number T403056"Peptide Separations on a Stable, Aqueous Compatible C18 Column," Supelco Business Unit, Bellefonte, Pennsylvania.

Understanding FDA Recommendations for N-Nitrosamine Impurity Levels
April 17th 2025We spoke with Josh Hoerner, general manager of Purisys, which specializes in a small volume custom synthesis and specialized controlled substance manufacturing, to gain his perspective on FDA’s recommendations for acceptable intake limits for N-nitrosamine impurities.


