HPLC with Charged Aerosol Detection for Pharmaceutical Cleaning Validation
LCGC North America
Cleaning validation is a major analytical application in the pharmaceutical industry. Here, high performance liquid chromatography (HPLC) with charged aerosol detection is compared and contrasted to HPLC with UV detection showing comparable performance and several advantages for charged aerosol detection, especially for analytes that do not contain a chromophore.
Good manufacturing practice requires that equipment involved in manufacturing be cleaned to certain low-level specifications and that assays and detection limits for confirming equipment cleanliness must be improved continuously. Validation of cleaning processes has long played a critical role in pharmaceutical manufacturing. The U.S. Food and Drug Administration (FDA) requires that firms have written procedures detailing the cleaning processes used for various pieces of equipment and procedures for validating them (1). Typical detection limits described in the pharmaceutical literature are 10 ppm of the analyte or a biological activity level of 1/1000 of the normal therapeutic dose (2). Cleaning validation generally involves a separation of the drug substance by high performance liquid chromatography (HPLC) and quantitation of the residual material on the manufacturing device based upon a reference standard.
HPLC with UV–vis detection is used commonly for cleaning validation as well as for traditional assays. HPLC cleaning validation methods are often similar to drug substance assays, and in some cases can be the exact same method. While HPLC with UV–vis detection is an important means for assaying one drug substance, if impurities are present, the response at the assay wavelength for those impurities must be known and might not be as strong as for the drug substance. In addition, any residual material on the equipment that does not have a chromophore will not give a response. By using HPLC with charged aerosol detection, these problems are eliminated.
Charged aerosol detection is based upon using an electrical aerosol analyzer together with HPLC (3,4). It operates by detecting charged particles that have a selected range of mobility rather than by measuring individual gas-phase ions that are differentiated based upon mass-to-charge ratio (m/z) (5). A simplified explanation of how charged aerosol detection acquires a signal from a compound that is being analyzed is shown in Figure 1. The mobile phase is nebulized using nitrogen as the carrier gas, followed by the droplets in the aerosol shrinking as the solvent evaporates. This stream of particles from the nebulizer is met with a second stream of positively charged nitrogen gas from a high-voltage platinum corona charger in a mixing chamber, where the positive charge from the nitrogen gas is transferred to the particles. The detector performs all of the nebulization, solvent drying, charging, and detection at room temperature (approximately 20 °C) and at a nitrogen pressure of 35 psi.
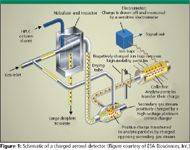
Figure 1
In this work, HPLC with charged aerosol detection was used to examine several traditional cleaning solvents for manufacturing devices spiked with typical drug substances and impurities (albuterol, loratadine, mometasone furoate, and lactose). We demonstrate quantitation of the drug substance and examine the potential of using charged aerosol detection for nonchromophore impurities, giving an accurate picture of contaminants remaining on manufacturing equipment.
Experimental
Apparatus: The HPLC system used was a Waters Alliance 2695 Series HPLC (Waters Corporation, Milford, Massachusetts). The system was equipped with a photodiode-array detector in line with a corona charged aerosol detector (ESA Inc., Chelmsford, Massachusetts). A YMC Pack Pro C18 column, 50 mm × 4.6 mm, 3-μm particle size (YMC Co., Ltd., Kyoto, Japan) was used. An orbital shaker (New Brunswick Scientific, Edison, New Jersey) was used for the agitation of the swab samples. A flow rate of 1.0 mL/min was used to maintain a reasonable run time. The compounds studied possessed different UV absorptions, therefore, different wavelengths were chosen based upon a maximum response for detection. Millennium 4.0 (Waters) was used to acquire and process the chromatographic data.
Sterile cotton balls were prepared for use as swabs by rinsing them with Optima Grade Methanol (Fisher Scientific, Springfield, New Jersey). A single rinsed cotton ball was then placed into a clean 60-mL bottle. The bottles containing the cotton balls were then placed into a vacuum oven with a slight nitrogen purge to remove the residual methanol from the cotton ball. The bottles were then removed from the oven, allowed to cool in a desiccator, and capped after cooling. Before swabbing, 2 mL of acetone was added directly to the cotton ball.
Chemicals
Mobile phase preparation: Optima-grade methanol (Fisher Scientific, Springfield, New Jersey) and Millipore 18-MΩ water (Millipore Corp. Billerica, Massachusetts) were used without further purification. Mobile phase was prepared by combining 250 mL of water with 750 mL of methanol. After thorough mixing, the mobile phase was then degassed. The mobile phase was not buffered.
Compounds
The Schering-Plough Research Institute (Union, New Jersey) generously provided the three drug substances (albuterol, loratadine, mometasone furoate) and one excipient (lactose) that were studied. Their structures are presented in Figure 2. The compounds were of the highest purity and were regarded as 100.0% pure for the purpose of this research.

Figure 2
Method
The following were the assay conditions for this study: Mobile phase: 75:25 methanol–water; diluent: methanol for all three active pharmaceutical ingredients (APIs) and lactose was diluted in water; flow rate: 1 mL/min; injection volume: 20 μL; column temperature: ambient; nitrogen gas pressure: 35 psi; charged aerosol detector range: 100 pA.
The holdup time (to) for the HPLC system to the UV detector was determined using the minor disturbance method described by Kazakevich and McNair (8). For the charged aerosol detector, the holdup time was determined by the minor disturbance method plus the difference in retention from the UV to charged aerosol detector of a low-level injection of mometasone furoate.
Minor disturbance method for system to UV detector = 0.620 min.
Charged aerosol detector retention = 2.190 min
UV retention = 2.167 min
Charged aerosol detector holdup time (to) = (2.190–2.167) + 0.620 = 0.643 min
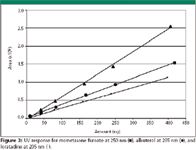
Figure 3
Results and discussion
While mometasone furoate and loratadine were retained rather well on the column with tR of 2.5 and 4.9, albuterol did not retain at all and was eluted at the void volume. Quantitation of such early eluted peaks generally should be avoided, but this did not appear to affect this study adversely. Solutions of varying concentrations for each drug substance were prepared and assayed on both detectors with the results presented by the calibration curves shown in Figures 3 and 4. The response on the UV detector varied based upon the absorptivity of the chromophores of the compounds and each compound gave a linear response. Due to different λmax values of the compounds, wavelengths of 250 nm and 205 nm were used. Compared with the UV detector results, the charged aerosol detector showed a linear trend over the full concentration range, although it is known that charged aerosol detection gives a quadratic response over a wider concentration range (1). However, at this low concentration and over a small range, the response can be treated as linear.
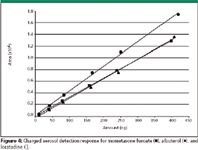
Figure 4
Quantitation limits also were examined for each of the three drug substances. The attempt was to achieve a signal-to-noise ratio of greater than 10 for 10 ng of each drug substance on-column. Both detectors were able to achieve this criterion easily, as shown in Table I. Minimization of interferences from solvents is a concern in cleaning validation. Several common cleaning solvents were selected and were examined for their added interferences to the chromatographic detection. The conditions mentioned previously were used with one exception, which is that the column was removed and replaced with a zero-dead-volume union. These solvents were injected on the system without introducing the variability of association with the stationary phase of the column. This was performed to get an accurate comparison of how common cleaning solvents potentially interfere with detection.

Table I: Signal to noise rations for approximately 10 ng injected on column
As shown in Table II, the UV detector at 205 nm gave more of a disturbance to the baseline versus charged aerosol detector for every solvent examined. Loratadine was added as a point of reference in order to show the relative differences in peak height between the UV detector at 205 nm and charged aerosol detector. The charged aerosol detector differs in response to the UV absorbance at 205 nm by approximately 47% for loratadine. In each case, the interference from a solvent is greater using UV absorbance at 205 nm than using charged aerosol detection. The cleaning solvents that were examined have UV cutoffs that were greater than 205 nm. In addition, all of these solvents have different UV responses at 205 nm relative to the mobile phase. This reduction in interference from the solvents in the charged aerosol detector is due to the nebulization followed by the drying of the mobile phase. Because the solvents are volatile, they are removed just as the mobile phase is removed.

Table II: Solvent interference on detection by height. *Loratadine data were taken from injections from Figures 3 and 4 and was not run under the same conditions as solvents
Several clean, small, stainless steel coupons measuring 2.5 in. × 2.5 in. with a slight bowl-like indentation, as shown in Figure 5, were spiked with a known amount of three drug substances. Two different techniques were implemented to recover the drug substances from the coupons: solvent rinse and swabbing. The first and third columns in Table III show the amount of material spiked onto each stainless steel coupon, while the second and fourth columns show the amount that was recovered for either the rinse or the swab of the coupons. The result of the recovery study was that the charged aerosol detector and UV both gave acceptable results, with the charged aerosol detector giving slightly better recoveries relative to the spiked amounts versus the UV detector.
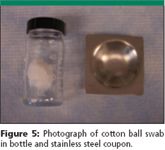
Figure 5
The chosen excipient, lactose, does not have an effective chromophore for UV detection. In contrast, charged aerosol detection gives an excellent response. The overlay of chromatograms of lactose and a blank in Figure 6 show a minor baseline disturbance for the blank injection and a large peak for lactose. This analysis of lactose is an excellent example of the advantage of charged aerosol detection in comparison to UV for compounds with poor to no chromophores in cleaning validation as well as other pharmaceutical applications. A comparison of the three drug substances that have been examined previously to the response for lactose assayed by charged aerosol detection can be seen in Figure 7. The results show a similar response for lactose as compared to the three drug substances over the concentration range assayed.

Table III: Drug substance rinsing and swabbing recovery data
As with albuterol, lactose is eluted in the void volume. The response of the two compounds that were not eluted in the void volume (mometasone furoate and loratadine) were consistent with each other. As for the two compounds that were eluted in the void, we observe that albuterol has a slightly increased response compared to the retained compounds, and lactose has a slightly decreased response compared with the retained compounds. This difference in response of retained versus unretained most likely results from elution at the hold-up time, at which point lactose would be surrounded by a slight excess of its diluent, water, and albuterol would be surrounded by a slight excess of its diluent, methanol.
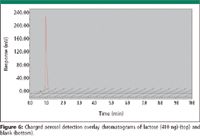
Figure 6
Conclusion
Three drug substances and one excipient were examined by HPLC with charged aerosol detection and HPLC with UV detection for pharmaceutical cleaning validation. For the three drug substances assayed by charged aerosol detection and UV detection, both resulted in linear curves over a usable range for low-level quantitation for pharmaceutical cleaning assays. Limits of quantitation were examined for the drug substances and showed equivalency between the two detection methods. Interference from the cleaning solvent was shown to be less with charged aerosol detection rather than with UV, which is advantageous when performing the assay. Recovery studies preformed mimicking real surfaces found in commercial equipment with two different sampling techniques used in pharmaceutical cleaning assays (rinsing, swabbing) showed the similarity between the two detectors. All of these attributes lead toward effective development and validation of HPLC with charged aerosol detector-based methods for pharmaceutical cleaning validation. Examining the excipient lactose yielded the charged aerosol detector's biggest advantage over UV detection: the ability to detect and quantitate low levels of poor or nonchromophore compounds.
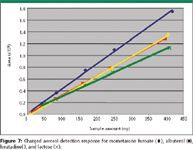
Figure 7
Acknowledgments
The authors gratefully acknowledge ESA Biosciences for providing the charged aerosol detector and Schering Plough Research Institute for providing the drug substances and excipient used in these studies. NHS gratefully acknowledges financial support from the Sanofi aventis foundation.
Brian Forsatz*† and Nicholas H.Snow* *Seton Hall University, South Orange, NJ. †Schering-Plough Research Institute, Union, NJ
Please direct correspondence to Nicholas Snow at snownich@shu.edu
References
(1) FDA "Guide to Inspection of Bulk Pharmaceuticals Chemicals" (1994).
(2) FDA "Guide to Inspection of Cleaning Validation" (1993).
(3) R. Dixon and D. Peterson, Anal. Chem. 74, 2930–2937 (2002).
(4) A. Medved, F. Dorman, S. Kaufman, and A. Pocher, J. Aerosol Sci. 31, S616–S617 (2000).
(5) P. Garnache, R. McCarthy, S. Freeto, D. Asa, D.M. Woodcock, K. Laws, and R. Cole, LCGC 23(5), 516–520 (2005).
(6) K. Whitby, Rev. Sci. Inst. 32, 1351–1355 (1961).
(7) A. Medved, F. Dorman, S. Kaufman, and A. Pocher, J. Aerosol Sci. 31, S616–S617 (2000).
(8) V. Yu and H.M. Kazakevich, J. Chromatogr. Sci. 33, 303–308 (1995).
Common Challenges in Nitrosamine Analysis: An LCGC International Peer Exchange
April 15th 2025A recent roundtable discussion featuring Aloka Srinivasan of Raaha, Mayank Bhanti of the United States Pharmacopeia (USP), and Amber Burch of Purisys discussed the challenges surrounding nitrosamine analysis in pharmaceuticals.
Extracting Estrogenic Hormones Using Rotating Disk and Modified Clays
April 14th 2025University of Caldas and University of Chile researchers extracted estrogenic hormones from wastewater samples using rotating disk sorption extraction. After extraction, the concentrated analytes were measured using liquid chromatography coupled with photodiode array detection (HPLC-PDA).

