How Does It Work? Part 2: Mixing and Degassing
Different techniques of liquid chromatography (LC) mobile-phase mixing can give different results and have different problems.
John W. Dolan, LC Troubleshooting Editor
Different techniques of liquid chromatography (LC) mobile-phase mixing can give different results and have different problems.
In last month’s “LC Troubleshooting” we reviewed the mechanics and operation of the most popular liquid chromatography (LC) pump designs (1). This month, we look at how the mobile phase is mixed and some potential problems that might be encountered. Most of us opt to have the LC instrument do the mobileâphase mixing for us, but we’ll look briefly at manual mobile-phase preparation first.
The Human Touch
When isocratic separations are used, in which the mobileâphase concentration is constant, handâmixed mobile phase is an option. In addition, many gradient methods require some hand-mixing of the mobile phase, such as when a buffer is used. The simplest and most accurate method of preparing a buffer is to weigh the appropriate amounts of the acidic and basic components, dilute them in high performance liquid chromatography (HPLC)-grade water, mix, and check the pH of an aliquot of this solution with a pH meter. Other techniques include preparing equimolar solutions of the acid and base and blending them until the desired pH is obtained, or preparing the base (or acid) at the desired concentration and titrating with a concentrated acid (or base) until the desired pH is obtained. The latter techniques are more error prone and require more steps than the gravimetric method.
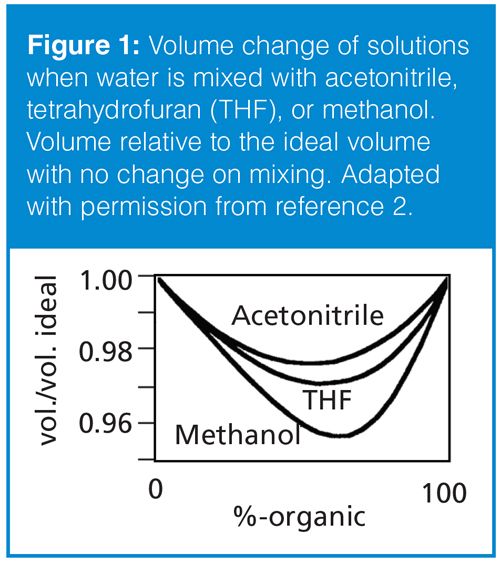
Once the aqueous component of the mobile phase has been prepared, it is blended with the organic component (usually acetonitrile or methanol) to reach the desired aqueous–organic ratio. It should be noted that LC mobile phases are prepared on a volume-to-volume basis, not by the quantum sufficit (q.s.) method, where one component is added to the other to reach a specific volume. For example, when preparing 1 L of 40:60 water–methanol, 400 mL of water and 600 mL of methanol are combined to yield approximately 1 L of mobile phase. The alternative of adding a sufficient volume of methanol to 400 mL of water to yield 1.0 L would give a mixture of approximately 3.5% more methanol. This is illustrated in Figure 1, where the volume change on mixing is illustrated for mixtures of water with acetonitrile, tetrahydrofuran, or methanol (2). It can be seen in Figure 1 that at 60% methanol–water, the volume of the solution is ~3.5% less than would be expected with no volume change on mixing. Acetonitrile–water solutions lose only about half the volume of methanol–water.
On-Line Mixing Options
As mentioned above, most of us rely on on-line mixing for both isocratic and gradient LC methods. There are two on-line mixing options that are popular with today’s LC systems, as illustrated in Figure 2.
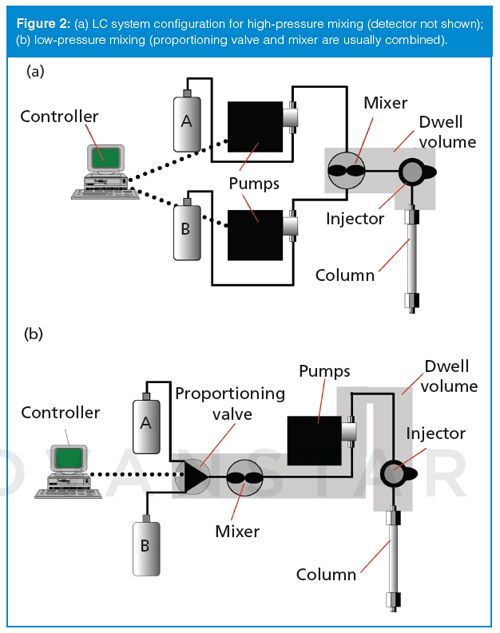
High-pressure mixing, as the name implies, relies on mixing the mobileâphase components on the high-pressure side of the pump. Figure 2(a) shows that this requires a separate pump for each solvent. In this case, one pump delivers the A-solvent (usually the aqueous component in reversed-phase separations), and the other pump delivers the B-solvent (organic - most commonly acetonitrile or methanol). The actual mobileâphase mixture is determined by the relative flow rates of the two pumps. For the above example of 60:40 methanol–aqueous example and a flow rate of 1 mL/min, the A-pump would pump at 0.4 mL/min and the B-pump at 0.6 mL/min. The solvents would be delivered to a mixer for blending and then to the injector and column. Note that in this case, the volume reduction mentioned above would also occur. So the flow rate would actually be ~3.5% lower, or ~0.965 mL/min. This, in turn, would increase retention times by 3.5%, so a nominally 5.00 min retention time would increase to 5.00/0.965 = 5.18 min. This change in retention would probably be of little concern, because changes in retention of ±0.1–0.2 min are not unreasonable when changing from one LC system to another or when replacing an old column with a new one, and retention would be constant for one system configuration. For gradient operation, the flow rates of the two pumps would change during the gradient to provide the desired gradient profile. For example, if a 5–95% gradient at 1 mL/min was required, the gradient would start with the A-pump running at 0.05 mL/min and the B-pump at 0.95 mL/min. As the gradient ran, the flow rate for the A-pump would increase and the B-pump would decrease. There would be a simultaneous change in mobileâphase volume (and thus flow rate) that would vary during the gradient according to Figure 1. It is possible to compensate for flow changes due to changes in mobile phase volume (or mobile phase compressibility) through special pump-control software. Such adjustments are likely of little practical consequence because any observed retention changes will be consistent for both reference standards and samples, so the changes would cancel each other.
The alternative form of mixing is low-pressure mixing. In this case, the mobile-phase components are blended prior to reaching the pump, on the low-pressure side of the pump, as illustrated in Figure 2(b). Although Figure 2(b) shows only two solvents, typically low-pressure mixing systems are configured for four solvents (A, B, C, and D). This configuration offers more flexibility and less cost than a comparable high-pressure mixing system that would require four LC pumps for the same capability. To prepare a 60:40 methanol–aqueous mobile phase delivered at 1 mL/min, the low-pressure mixing system would open the A-solvent proportioning valve for 40% of the time and the B-valve for 60% of the time (usually in short pulses), with the pump running at a constant 1 mL/min. Any time two solvents are mixed, the same volume change on mixing occurs, so the same 3.5% reduction in volume would occur here in the same way as was seen in the earlier examples. However, because the pump is pumping at 1.0 mL/min, the flow to the column would be 1.0 mL/min. You can see that under the same systems settings (same column, temperature, set flow rate, and so forth), the lowâpressure mixing system would give slightly shorter retention times than the corresponding high-pressure mixer. However, as mentioned above, this small change is likely to go unnoticed because it is in the same scale as normal system-to-system or column-to-column variability. When a gradient is desired, the pump runs at a constant flow rate and the ratio of the cycle times of the proportioning valves gradually changes to deliver the proportion of solvents dictated by the gradient program.
Potential Problems
Let’s look next at two potential problems that can occur when on-line mixing is used. These are mobile-phase outgassing and solvent proportioning errors.
Outgassing: When water is blended with acetonitrile or methanol, the resulting mixture has a lower capacity for dissolved air than the pure solvents. If the starting solvents are saturated with air, as is the case when they are equilibrated with the atmosphere, the mobile-phase mixture will become supersaturated with air and outgassing will often occur. If the mixture is supersaturated, any nucleation site in the system, such as a frit or the sharp edge of a tube end, can cause outgassing. Under high-pressure mixing conditions, the solvents are mixed at pressures well above atmospheric pressure, so the excess gas tends to stay in solution. As a result, high-pressure mixing systems are less susceptible to pumping problems caused by outgassing than low-pressure mixing systems are. However, when the mobile phase exits the column, it will return to (near) atmospheric pressure and often outgassing will occur, causing problems with air bubbles in the detector.
Low-pressure mixing systems blend the solvents before they reach the pump, and at or slightly below atmospheric pressure. Such conditions encourage solvent outgassing, and the resulting bubbles are likely to interfere with pump performance exhibited as pressure or flow pulsations. It is rare for lowâpressure mixing systems to run reliably unless degassing is used.
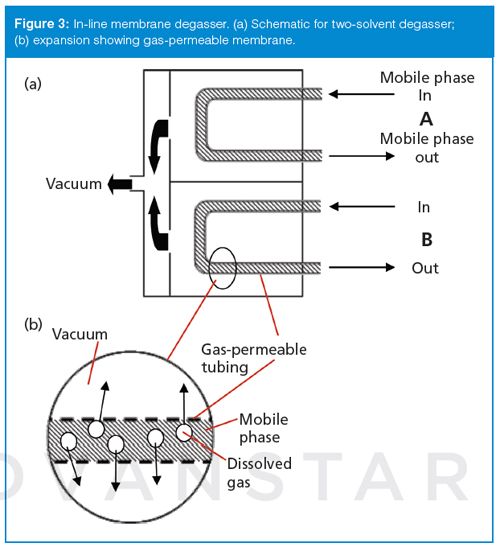
Outgassing problems can be minimized by degassing the mobileâphase components. Historically, this was accomplished by helium-sparging the solvents in the mobile-phase reservoirs. Although helium-sparging is still the most effective degassing technique, helium is expensive and the process is inconvenient, so it has fallen out of favour. Today most LC systems incorporate in-line degassers, which provide an adequate level of degassing for most applications. The operation of the in-line degasser is illustrated in Figure 3. The degasser relies on a gas-permeable membrane over which the solvent passes, and a partial vacuum on the other side of the membrane. Figure 3(a) shows a possible configuration for a two-solvent degasser (most accommodate four separate solvents). In this case, solvents flow through gas-permeable tubing that passes through a vacuum chamber. The inset (Figure 3[b]) illustrates that the gas in solution passes through the membrane because of the difference in pressure, but solvent is unable to penetrate the pores of the membrane. This is much like the function of a GoreTex rain jacket, where water runs off the surface, but the fabric is “breathable”. The in-line, or membrane, degasser does not remove 100% of the dissolved gas, but it reduces the gas load of the solvents such that the mobile-phase mixtures are no longer saturated with dissolved air. In practice, the in-line degasser is placed so that the solvents pass through it before reaching the pumps in highâpressure mixing systems or before reaching the proportioning valves in lowâpressure mixing systems.
It is the best practice to always use an in-line degasser (or other degassing technique) for reversedâphase LC operation. To give an idea of the effectiveness of these degassers at preventing problems, consider this observation based on the inquiries I receive from readers of this column: Before in-line degassers were widely used, problems related to air bubbles in the system were easily the most common problems reported. Since the wide acceptance of these devices, I almost never get a question about a problem resulting from air bubbles in the LC system.
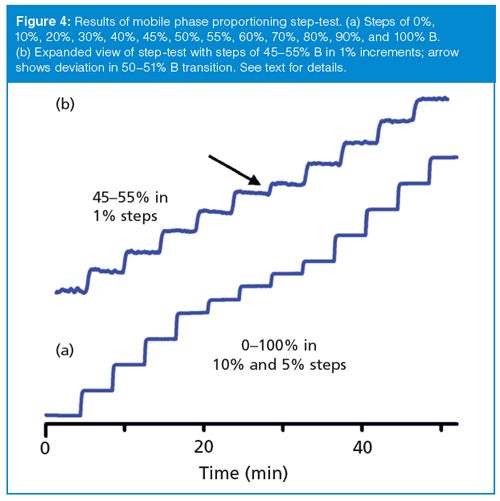
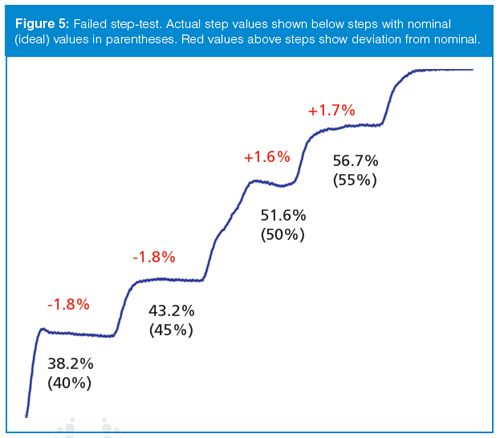
Solvent Proportioning Problems: On-line mixing is convenient, and when it works properly is very reliable. However, it is a good idea to check the mixing performance periodically. Often this is done as part of an annual preventive maintenance procedure for the instrument. The simplest way to check for proportioning errors is to use a step test. In this test, water is placed in the A-reservoir and water spiked with 0.1% acetone is placed in the B-reservoir. The column is replaced with a short length of capillary tubing, and an ultraviolet (UV) detector is set to 265 nm for strong response to the acetone in the B-solvent. A stair-step program is entered into the system controller. Typically, the program is 0–100% B in 10% steps; I like to add an extra step at 45% and 55% B to generate a little more information near the midpoint of the test. The flow rate is set to a typical operating condition, such as 1 mL/min. The time for each step is set to allow each step to stabilize before moving to the next step, for example, 1–2 min/step. I usually set a specification that each step should be within ±1% of the programmed value. An example of a satisfactory step test is shown in Figure 4(a). The steps are even and within 1% of the setpoint in each case. Figure 5 shows an example of part of a failed step test. In this case, the steps at 40% and 45% are 1.8% low and the 50% and 55% steps are 1.6% and 1.7% high, respectively. In addition, the transition at the beginning of the 40% step has a little bump on it and the step from 45% to 50% is actually 8.4% and is distorted. The problems with step size and accuracy were most likely caused by errors in the proportioning-valve control program, whereas the distortions in step shape were probably due to bubbles or a malfunctioning check valve.
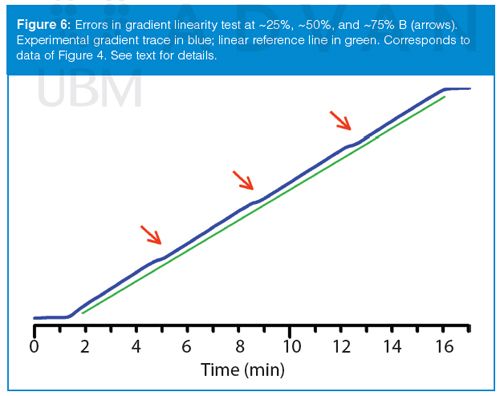
The same solvents can be used to test gradient linearity, as shown in Figure 6. Here, the overall gradient was linear (compare the blue experimental gradient line to the green reference line), but there was a small nonlinear portion at ~25%, 50%, and 75% B. Although this system passed the initial step test (shown in Figure 4[a]), a modified step test exposed the problem. When the step test was modified to change steps in 1% increments in the 20–30%, 45–55%, and 70–80% B regions, a discontinuity was seen, as illustrated in Figure 4(b). Each step is the desired 1% in magnitude, except the transition from 50% to 51% B (arrow); similar results were seen for the 25–26% and 75–76% steps. Further troubleshooting isolated the problem to a single proportioning valve; see reference 3 for further discussion of this problem.
Summary
We have looked at the three common mobile-phase preparation techniques: hand mixing, highâpressure mixing, and lowâpressure mixing. Each of these has advantages and disadvantages. We also considered potential problems related to solvent volume changes on mixing, mobile-phase outgassing, and solvent proportioning errors. Successful LC operation can be obtained with both low- and high-pressure mixing systems, but it is wise to always use degassed solvents and to periodically verify that the solvent proportioning system is working properly.
References
- J.W. Dolan, LCGC Europe29(5),258–261 (2016).
- J.P. Foley, J.A. Crow, B.A. Thomas, and M. Zamora, J. Chromatogr.478, 287–309 (1989).
- J.J. Gilroy and J.W. Dolan, LCGC North Am.22(10), 982–988 (2004).
“LC Troubleshooting” Editor John Dolan has been writing “LC Troubleshooting” for LCGC for more than 30 years. One of the industry’s most respected professionals, John is currently the Vice President of and a principal instructor for LC Resources in Lafayette, California, USA. He is also a member of LCGC Europe’s editorial advisory board. Direct correspondence about this column should go to John.Dolan@LCResources.com. To contact the editorial team please address any correspondence to: “LC Troubleshooting”, LCGC Europe, Hinderton Point, Lloyd Drive, Ellesmere Port, CH65 9HQ, UK, or e-mail the editorâinâchief, Alasdair Matheson, at amatheson@advanstar.com

Understanding FDA Recommendations for N-Nitrosamine Impurity Levels
April 17th 2025We spoke with Josh Hoerner, general manager of Purisys, which specializes in a small volume custom synthesis and specialized controlled substance manufacturing, to gain his perspective on FDA’s recommendations for acceptable intake limits for N-nitrosamine impurities.


