How Do Your Peaks Measure Up?
LCGC Europe
John Hinshaw examines the anatomy of chromatographic peaks with attention to features that help determine the suitability of individual chromatographs for a specific analysis task.
This month in "GC Connections" John Hinshaw examines the anatomy of chromatographic peaks with attention to features that help determine the suitability of individual chromatographs for a specific analysis task.
The human sense of shape and pattern recognition can discern subtle nuances among groups of visual cues that no computer system can reproduce faithfully. Yet when it comes to measuring and evaluating chromatograms, analysts put a great deal of faith into their computerized data handling systems. Over the course of one year a practicing chromatographer might look at 10,000 or more peaks. After some time an observer develops a finely tuned sense of what constitutes a good or bad peak shape, which peaks will be detected and measured correctly by the data system, and an overall idea of how the observed peaks indicate the instrumentation operational health. This sense is formalized in system suitability software that determines an array of chromatogram metrics from test analyses and compares them to goals or minimum performance levels. These programs confirm the suitability of individual chromatography systems to perform specific analytical tasks, often on a daily basis. Such software relies upon accurate designation of target peaks and parameters when set up: Otherwise it is bound to perform poorly and can fail to find incipient problems.
Chromatographers who use data-handling or suitability software or who make such measurements themselves should have a thorough understanding of the various metrics that are extracted from a chromatogram. Without this awareness they relinquish control over the quality of their results — they are using a tool without a working knowledge of its functions and limitations.
This month's "GC Connections" examines the basic measurements of a peak's size and shape as used for purposes of assessing and monitoring chromatographic separations over a period of time. The calculations presented here represent some of the most commonly used metrics of this type. Other related calculations are found throughout various commercially available performance monitoring systems as well as in individual laboratories' quality control (QC) and quality assurance (QA) procedures. This column instalment is intended to aid in the general understanding of these calculations and it does not purport to present computations that are any more or less appropriate than others.
Getting into Shape
As solutes enter and pass through a chromatography column and out to the detector they are subject to various processes that modify the peaks' profiles as finally registered by a data system or chart recorder. Peaks must be constrained within certain limits of retention time, width, and shape if minimum levels of peak resolution are to be maintained. By measuring their peak shapes, chromatographers obtain information about the ability of their systems to perform a specific analysis as well as about possible sources of peak shape distortion.
In an ideal chromatography system the separation process results in the normal Gaussian-shaped peak that is the basis for many metrics. The Gaussian peak shape is a product of a statistical theoretical treatment of the solutes' transit through a chromatography system. It represents a simple basis on which analysts can make a number of measurements by assuming that it closely approximates their peak shapes. This assumption is justified by the random-walk and other theories of chromatography that approximate the separation process as if it were the product of the bulk behaviour of large populations of solute molecules. The randomness of the process results in a Gaussian peak elution profile. Additional effects, primarily extracolumn in nature, act to modify the peak profile. Slow detector response speeds and broad injection profiles, relative to band spreading in the column, are the two most common extracolumn effects.
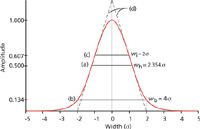
Peak Width: A normal Gaussian distribution curve can be characterized by the fraction of its total area that lies within certain distances from its midpoint. These distances are expressed in terms of multiples of the curve's standard deviation (σ), which is the distance between the apex of the peak at its midpoint and the inflection points (Figure 1[c]). The inflection points lie on either side of the peak's midpoint, where the slope of the curve reaches its maximum absolute value: They span a width (wi) of 2σ from the left-hand point to the right-hand point. Approximately 68% of the area under a Gaussian curve lies between the inflection points at ±1σ from its midpoint and 95.5% lies within ±2σ (Figure 1[b]). The extent of this distance, which is defined as the peak width at base (wb = 4σ), corresponds to the intersection points of lines drawn tangentially to the inflection points (Figure 1[d]). A distance of ±4σ from the midpoint accounts for more than 99.95% of the area.

Figure 1: Idealized chromatography peak. A normal Gaussian peak plotted as the departure from its midpoint in standard deviation (Ï) units. The signal amplitude is relative to the peak crest, which is equal to 1.0. (a) Peak width at half-height, wh; (b) peak width at base, wb; (c) peak width at the inflection points, wi; (d) lines drawn tangentially to the inflection points intersect the signal baseline at the base width of the peak. Adapted from reference 1.
The width at half-height (wh) is the most commonly used peak-width metric because it is the easiest to measure manually. The other width metrics are located at fractional heights. The width at half-height is determined by measuring the height of the peak crest above the baseline, dividing by two, and then measuring the span between the rising and falling sides of the peak where the signal crosses the half-height points. The baseline of a peak is not located at the height at the base points (Figure 1[b]), but rather it is the signal in the absence of any peaks. For single peaks the baseline can be constructed by a line that intersects the detector signal at a distance greater than ±4σ on either side of the peak's midpoint. Unlike the widths at the inflection points and at the base, the width at half-height of a normal Gaussian distribution is not an integral multiple of the standard deviation; instead it equals 2.354σ.
The relationships among these peak-width measurements in terms of the width at half-height and sigma are:


Asymmetry: Only computer-generated Gaussian peak shapes (such as seen here) are perfectly symmetrical from front to back. Real chromatographic peaks have some degree of asymmetry; their front and back halves are not the same shape. Extra-column dead volumes, peak mass overloading, and reversible adsorption effects are some of the principal causes of peak asymmetry. Typically, excessive dead volume as well as solute adsorption will cause peaks to tail, so that the back half is wider than the front, while overloading the column with too much solute mass will create so-called fronting peak shapes that have a wider front part.
Analysts commonly use two different peak asymmetry metrics. First is the asymmetry factor (a), which is determined from the front (f) and back (b) peak widths at 20% of the peak height:

The second asymmetry metric is the tailing factor (TF), which uses the front and back widths at 5% of the peak height:

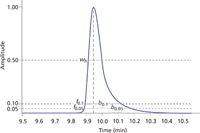
Figure 2 illustrates peak asymmetry measurements. The asymmetric peak shown here has the front and back widths at 10% and 5% height, asymmetry factor, and tailing factor shown in Table 1. For tailing peaks both factors will be greater than 1.0 and for fronting peaks they will be less than 1.0. In general, the asymmetry and tailing factors are similar in value as long as the peak asymmetry is moderate (0.5 < a < 2.0). For peaks with a larger amount of tailing, the asymmetry factor tends to be larger than the tailing factor, such as in this example, where the asymmetry factor a = 3.5 but the tailing factor is only 2.27. Thus, it is important to select and identify which peak asymmetry metric to use for a particular application.

Figure 2: Measurements from an asymmetric chromatography peak. See text and Table 1 for explanation and asymmetry calculations.
Peak asymmetry metrics are useful when peak tailing is a concern. For example, in the analysis of carboxylic acids, phenols, organic bases, or free amino acids by gas chromatography (GC), the polar nature of these solutes often produces marked peak tailing. With extended use, columns may accumulate absorptive debris or experience a loss of surface deactivation that leads to increased polar peak tailing and subsequent loss of resolution as well as compromised minimum detectable levels. By regularly monitoring the asymmetry of these peaks, analysts can anticipate this kind of problem before it becomes serious and take steps to remedy it.

Table 1: Asymmetry calculations from Figure 2.
Plates: The peak in Figure 1 is normalized to standard deviation units (σ), which are readily expressed in terms of the widths in seconds at the inflection points, at half-height, or at base with the expressions in equations 1–3. However, measuring just the peak width without also considering the time the peak took to be eluted removes the peak from the context of its column passage. A peak with width at half-height equal to 2 s could be very good or very bad, depending on its elution time. Thus, consideration of the peak width in the context of its retention time is important when measuring column quality.
To make meaningful comparisons from peak to peak or column to column, chromatographers can use the theoretical plate concept. These plates are entirely theoretical — no physical plates exist in the column. The term "plate" in this context comes from industrial distillation columns. One way to produce fractions of higher purity is to add a series of internal metal plates to the distillation column. Early in the development of the petroleum and related chemical industries, distillation columns that gave a cleaner fractionation of mixtures were said to have high plate numbers and were deemed more efficient than columns with lower plate numbers. This terminology was imported by petroleum chemists who become involved in chromatography.
For the purposes of this discussion the theoretical plate concept expresses the basic ability of a chromatographic column to maintain solutes' distribution profiles as they pass through it. Peak widths upon elution from the column will always be greater than at entry: Columns with greater theoretical plate numbers will broaden the solute bands less than columns with fewer theoretical plates will.
The number of theoretical plates (N) relates the statistical standard deviation of a peak (σ) to the peak's elution time (tR):

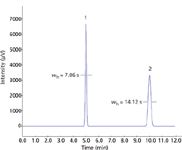
As shown in equation 6, N can also be calculated from peak width measurements directly. Higher chromatographic theoretical plate numbers mean that a peak will be narrower at a given retention time. As retention times increase, it follows that peaks with the same number of theoretical plates will exhibit proportionately increasing widths as well. Figure 3 shows two symmetrical peaks, both with 50,000 area counts and 10,000 theoretical plates, which are eluted at 5 min and at 10 min; the second peak is twice as wide as the first. The additional band spreading of the later peak also causes its height to decline in proportion.

In the context of asymmetrical peaks and peak tailing, theoretical plate number calculations that use the width at 10% of the peak height may better reflect the greater overlap of tailing peaks. Since w0.1 = 4.3σ, this theoretical plate calculation can be expressed as

Figure 3: Two peaks with identical theoretical plate numbers and area. Peak 1: Peak at 5.0 min with 10,000 plates and 50,000 µV-s area. Peak 2: Peak at 10.0 min with 10,000 plates and 50,000 µV-s area.
Chromatographers often use theoretical plate numbers as a basis for comparison of multiple columns of the same type. Taken in the context of peak widths and retention times, plate number calculations provide an extra metric when qualifying replacement columns in existing analyses as well as for ongoing separation quality control.
Plate Height: The number of theoretical plates depends directly on the length of a column. Longer columns of the same diameter and stationary phase will yield more theoretical plates under the same operating conditions. Cutting pieces off a column will reduce the total theoretical plate count. Due primarily to carrier-gas compressibility effects as well as to unequal coating characteristics along the column length, this relationship is not truly linear: Half of a column will not have exactly half as many theoretical plates as the original. To express the average performance of a column independently of its length, chromatographers often use two additional metrics related to the number of theoretical plates.
The first of these is the length of column that corresponds to one theoretical plate. Termed the height equivalent to a theoretical plate (h) or simply the plate height, this metric is equal to the length of a column (L) divided by N:

Here, the word height is also imported from distillation column technology and does not strictly apply to coiled chromatography columns. An older name for this metric is height equivalent to a theoretical plate (HETP). The column length is expressed in centimetres or millimetres for this calculation. If the column that produced the chromatogram in Figure 3 was 10 m (10,000 mm) long, then the two peaks each would have h = 1.0 mm. A related metric is the number of theoretical plates per metre of column length. If h = 1.0 mm, then N/L will be 1/(1 × 10-3) or 1000 theoretical plates/m.

It is important to understand that these three metrics related to theoretical plates (N, h, and N/L) all refer to the average broadening process that any one specific band of solutes undergoes as it transits the column. If one peak exhibits 10,000 theoretical plates another peak next to it might measure 8000 or 12,000 plates because of differences in the nature of the chemical interactions of different solutes with the column and stationary phase. In addition, the column inherits the band shapes of solutes as they exit the inlet system and presents the eluted bands to the detector, so extracolumn band-spreading effects arising in the inlet or detector system will be included in the observed peak shapes. Thus, peak width and theoretical plate metrics reflect the overall system performance and not just the column alone.
Resolving Peaks
Of course, the goal of a chromatographic separation is to separate and resolve two or more solutes. Discussing the widths and plate numbers of single peaks is significant where column performance is concerned, but the measurement and control of the separation and resolution of pairs of adjacent peaks is ultimately more significant. There are several common metrics related to these issues.
First, we must make a careful distinction between the separation of two peaks and their resolution. The separation of two peaks refers to the degree of time or distance, relative or absolute, which separates the retention times of two peaks. Separation makes no statement about the width of the peaks nor does it infer that the neighbouring peaks do or do not overlap. Resolution, on the other hand, takes peak widths in the context of their degree of separation and provides an indication of how pure each peak is upon detection.
Separation: Several metrics are concerned with peak separation. The most familiar is perhaps the separation factor (α), which is defined only in the context of two adjacent peaks, here numbered 1 for the first peak and 2 for the second:

In equation 10, tM is the mobile-phase holdup time and ki is the retention factor of peak i:

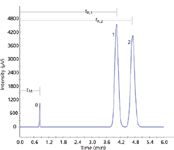
Figure 4 illustrates some of these parameters. By definition the separation factor is always greater than one because the second peak's retention always appears in the numerator.

Figure 4: Separation and resolution. The separation factor (α) is 1.2 and the resolution (Rs) between peaks 2 and 3 is 2.0. See Table 2 for peak measurements. Peaks: 1 = unretained solute, 2 = first solute, 3 = second solute.
Another separation metric is the relative retention (r), which is no more than the separation factor without the requirement for adjacent peaks:

In equation 12, ki refers to a specific peak whose retention is being determined relative to a reference peak with retention factor kref. The relative retention is a generalized case of the separation factor that is most often applied in situations where a single peak must stand as the reference point for one or more other peaks that are not necessarily adjacent to the reference peak. The relative retention factor might be less than or greater than 1.
The retention factor indicates the degree of raw retention that a column has for each component. When a column starts to lose some of its stationary phase, because of overheating or degradation from other causes, each peak's retention factor will begin to shift to a lower value. Tracking separation factors and relative retentions allows chromatographers to monitor a column's polarity, which is its ability to discriminate between components on a chemical interaction basis as opposed to separation on purely a boiling-point or volatility basis. As with peak tailing, shifts in peak relative retentions and separation factors occur as a column ages and accumulates residue, looses its deactivation, or suffers a chemical change as a result of oxidation or other stationary phase breakdown. A failing column can be identified by tracking these metrics, which makes it possible to replace the column before it becomes unable to deliver a desired minimum separation.
Resolution: The last peak shape metric, resolution, evaluates peak widths in the context of the separation of a pair of peaks and gives an indication of the overall completeness of a separation. The resolution (Rs) of a pair of peaks is calculated from their widths and their separation in time:

The last expression in equation 13 assumes that the width at half-height of both peaks is similar and uses only the second peak's width in the calculation.
A resolution of 1.0 signifies that the peaks are spaced apart by one width at base, or 4σ. In this case, the ending base point of the first peak coincides with the starting base point of the second, which leaves about a 6% overlap. The term "baseline resolution" refers to a resolution of 1.5, where the first peak returns close to the baseline before the second starts. This is a separation of 6σ and yields less than 2% overlap. For good practice it is desirable, if possible, to obtain a minimum resolution of 2.0, which corresponds to less than 0.5% overlap.
Figure 4 illustrates a chromatogram with two solute peaks that have a resolution of 2.0. Their retention times differ by 40 s. The resolution calculation used the second formula in equation 13, which uses the measured values for the width at half-height of both peaks. The third formula, which assumes the widths of both peaks are the same, yields a slightly lower figure of Rs = 1.96. These peaks also tail slightly with asymmetries a = 1.1 each. Table 2 gives these and other measurements discussed in this instalment for the chromatogram in Figure 4. These metrics represent the most commonly monitored peak measurements that chromatographers use for system suitability and related QC and QA determinations. Several of the commercially available suitability software packages offer a selection of alternate formulas and metrics that are directly related to various written standards promulgated by a number of standards and regulatory organizations worldwide. Analysts who need to measure and monitor these metrics should check their calculations carefully to ensure their determinations are consistent and meaningful.

Table 2: Measurements from the chromatogram in Figure 4. The separation factor and resolution are given for the second peak of a pair.
Conclusion
An individual chromatographic system designed for a specific separation task may or may not be capable of carrying out the target separation at all times. By validating each chromatograph on a regular basis, analysts can ensure that their equipment functions correctly and delivers defensible results. Chromatogram metrics such as retention times, retention factors, peak widths, plate numbers, asymmetries, separation factors, and resolution indicate the momentary suitability of an instrument system to perform the intended analysis. Many of these characteristic measurements have variants that must be identified so that valid comparisons can be made. By better understanding how the metrics are determined, chromatographers can ensure higher quality results.
John V. Hinshaw is a senior research scientist at BPL Global Ltd., Oregon, USA, and is a member of LCGC Europe's editorial advisory board. Direct correspondence about this column should be addressed to "GC Connections", LCGC Europe, 4A Bridgegate Pavillion, Chester Business Park, Wrexham Road, Chester, CH4 9QH, UK, or email the editor-in-chief, Alasdair Matheson, at amatheson@advanstar.com
Reference
(1) J.V. Hinshaw and L.S. Ettre, Introduction to Open-Tubular Column Gas Chromatography (Advanstar, Cleveland, Ohio, USA, 1994).

Distinguishing Alcohol- from Non-Alcohol-Associated Liver Cirrhosis with LC-MS
May 7th 2025A pilot study investigating whether nicotinamide adenine dinucleotide kinase (NADK) expression is selectively diminished in alcohol-associated liver cirrhosis (AC), as well as evaluating its potential as a biomarker for this condition, measured AC and non-AC (NAC). Nicotinamide adenine dinucleotide (NAD+) and nicotinamide adenine dinucleotide phosphate (NADP+) levels in human liver samples were measured using liquid chromatography-mass spectrometry (LC-MS).

.png&w=3840&q=75)

.png&w=3840&q=75)


.png&w=3840&q=75)


.png&w=3840&q=75)


