HILIC–MS — High Resolution and Sensitivity for the Analysis of Very Polar Compounds
The Application Notebook
Regina Roemling1 and Seiji Itoh,21 Tosoh Bioscience GmbH, Stuttgart, Germany,
2 Tosoh Corporation, Tokyo, Japan.
Hydrophilic interaction liquid chromatography (HILIC)1 is used primarily to separate polar and hydrophilic compounds. Target applications for HILIC include the analysis of saccharides, glycosides, oligosaccharides, peptides and hydrophilic drugs.
Hydrophilic interaction chromatography
HILIC has similarities to normal phase chromatography (NPC) with regard to the nature of the stationary phase, but the eluents used are similar to those known from reversed-phase chromatography (RPC). Typical mobile phases are mixtures of acetonitrile and water or aqueous buffers. Typical stationary phases are silica or polymer particles carrying polar functional groups. TSKgel Amide-80 HILIC columns are packed with spherical silica particles that are covalently bonded with non-ionic carbamoyl groups. They are very well known for the separation of polar compounds such as saccharides2 or glycans.3
It is commonly believed that in HILIC the aqueous content of the mobile phase creates a water rich layer on the surface of the stationary phase. This allows for partitioning of solutes between the more organic mobile phase and the aqueous layer. Hydrogen bonding and dipole–dipole interactions are the dominating retention mechanisms in HILIC mode. The number of polar groups, as well as the conformation and solubility of the sample in the mobile phase determines the elution order.
Features of HILIC–MS
In recent years hyphenated techniques such as GC–MS and LC–MS, are becoming more and more popular. With MS–MS detection techniques a very high sensitivity and selectivity can be reached.
In LC-ESI–MS evaporation of the solvent is crucial for detection sensitivity. A high organic content of the mobile phase is supporting efficient evaporation, thus enhancing MS sensitivity. In RP separation mode the retention of very polar, hydrophilic compounds is usually very low, limiting separation power. This can be improved by using modern RP materials especially designed for separation of polar compounds. Nevertheless the high aqueous content of the eluent is still impairing LC–MS detection sensitivity.
HILIC separations are performed with gradients starting with high percentage of organic solvent and ending with a high portion of aqueous solvent, which is opposite to RPC. The elution order is usually inversed as well and polar compounds are very well separated. The portion of organic solvent in the mobile phase is relatively high supporting highly sensitive LC–MS detection.
We present examples for the different elution order of polar compounds in HILIC and RPC with UV detection and with LC–MS–MS detection.
HILIC and Reversed Phase Separation of Peptides


Figure 1
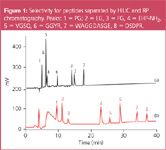
The selectivity of HILIC is completely different from RPC and for most samples the elution order is inversed. Figure 1 gives an example for these differences in selectivity. In addition it shows that HILIC can be applied not only for the separation of saccharides or polyols but for peptides as well.
Small peptides were separated by C18 and HILIC columns of the same dimensions. Mobile phases - acetonitrile and 0.1% trifluoroacetic acid - were the same for both separations but gradients were almost inversed. The very polar peptide 8 (DSDPR), which was not separated from the shorter peptides 4 and 5 in RP mode was highly retained in HILIC mode. Elution order for peptides 2 and 3 was inversed.
Material and Methods:
Columns: (a) TSKgel ODS-80TS 5 μm, 4.6 mm i.d. × 25 cm L (b) TSKgel Amide-80 5 μm, 4.6 mm i.d. × 25 cm L
Eluents: A: 0.1% TFA; B: Acetonitrile
Flow-rate: 1 mL/min
Gradient: C18: 5% B to 55% B in 83.3 min HILIC: 97% B to 55% B in 70 min
Sample: Mixture of small polar peptides
Detection: UV@215 nm
HILIC–MS Analysis of Polar Drug Substances
HPLC–MS–MS has become a powerful tool for analysis of drug substances. It is used in quantitative confirmatory analysis of drugs of abuse, as well as in fast analysis of metabolites in pharmacokinetics or rapid screening of drug candidates.
Analysing basic drug substances by RPC has some drawbacks: In addition to peak tailing problems, very polar components show low retention and elute with high water containing eluents, which are unfavourable for subsequent ESI–MS detection. The new 3 μm particle size TSKgel Amide-80 columns were designed to provide HILIC columns for LC–MS use. They combine both, retention for polar compounds and high resolution. An additional benefit of TSKgel Amide-80 for mass spectrometric detection is the virtual absence of column bleeding.

Figure 2
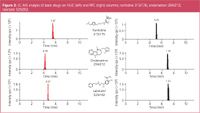
Figure 2 shows the analysis of some basic drug substances using a HILIC column (TSKgel Amide-80 3 μm) compared to the analysis of the same molecules using a RP column (TSKgel ODS-100V 3 μm). Ranitidine, a histamine H2-receptor antagonist, ondansetron, an antiemetic serotonin receptor antagonist, and labetalol, an alpha-1 and beta adrenergic blocker, used to treat high blood pressure, were selected to demonstrate the differences in selectivity and MS-signal response when using different chromatographic modes.
Ranitidine, which has the highest number of polar groups among these molecules, showed the highest retention on the HILIC phase and the lowest retention on the RPC phase. The signal intensity was almost doubled for ranitidine when using HILIC separation mode compared to RPC. The example of labetalol shows that even a ten-fold increase in signal height can be achieved by using HILIC instead of RPC.
Material and Methods
Columns: HILIC: TSKgel Amide-80 3 μm, 2 mm i.d. × 15 cm L RPC: TSKgel ODS-100V 3 μm, 2 mm i.d. × 15 cm L
Eluents: A: 10 mM Ammoniumformiate pH 3.75; B: Acetonitrile
Flow-rate: 0.2 mL/min
Gradient: HILIC: 90% B to 40% B in 10 min RPC: 0% B to 80 % B in 10 min
Sample: Ranitidine, ondansetron, labetalol (50 μg/L each)
Injection vol.: 5 μL
Detection: QTrap LC–MS–MS (Applied Biosystems), ESI+, MRM
Conclusion
TSKgel Amide-80 HILIC columns with 5 μm particles have been used for years for a broad range of LC–MS applications.4,5 The new 3 μm Amide-80 columns provide even better resolution at reduced analysis time as a result of the smaller particle size. The unique HILIC separation mechanism offers major advantages for the analysis of very polar compounds by LC–MS techniques.
References
1. A. Alpert, J. Chromatogr., 499, 177–196 (1990).
2. G. Karlsson et al., J. Chromatogr. A, 1092(2), 246–249 (2005).
3. W. Laroy et al., Nature Protocols, 1, 397–405 (2006).
4. V.V. Tolstikov and O. Fiehn, Analytical Biochemistry, 301, 298–307 (2002).
5. H. Nakagawa et al., J. Chromatogr. B, 853(1–2), 133–137 (2007).


Tosoh Bioscience GmbH
Im Leuschnerpark 4
64347 Griesheim
Tel: +49 6155-7043700
Fax: +49 6155-8357900
Info.tbg@tosoh.comwww.tosohbioscience.de


A Guide to (U)HPLC Column Selection for Protein Analysis
April 16th 2025Analytical scientists are faced with the task of finding the right column from an almost unmanageable range of products. This paper focuses on columns that enable protein analysis under native conditions through size exclusion, hydrophobic interaction, and ion exchange chromatography. It will highlight the different column characteristics—pore size, particle size, base matrices, column dimensions, ligands—and which questions will help decide which columns to use.
The Benefits of Custom Bonded Silica
April 1st 2025Not all chromatography resins are created equal. Off-the-shelf chromatography resins might not always meet the rigorous purification requirements of biopharmaceutical manufacturing. Custom bonded silica from Grace can address a wide range of separation challenges, leading to real performance improvements. Discover more about the latest innovations in chromatography silica from Grace, including VYDAC® and DAVISIL®.
5 Things to Consider When Selecting a Chromatography Silica
April 1st 2025Particularly in the pharmaceutical industry, drug purity isn’t just a goal – it’s essential for achieving safety, stability and efficacy. However, purification is easier said than done, especially with challenging molecules like DNA and RNA “oligonucleotides,” due in large part to their diversity and the range of impurities that can be generated during production. Enter DAVISIL® chromatographic silica, with a wide range of pore diameters and particle sizes to meet your specific application, performance and sustainability requirements. Before you choose the chromatography resin for your next purification application, take a look at these 5 considerations.
Automating Protein Purification: Efficiency, Yield, and Reproducibility
March 27th 2025Recent advancements in automated protein purification stress the importance of efficiency, scalability, and yield consistency. This eBook compares different purification platforms, highlighting their impact on downstream applications and demonstrating how automation enhances throughput and process control.

