High-throughput Multiplexing Gas Chromatography
This article describes a technique based on pseudo-random injection sequences to perform rapid sample injections.
The throughput of conventional separation systems is typically limited by the last eluting component of a mixture. In many applications most of the time is spent recording detector noise. A similar problem was encountered in the development of early continuous wave spectrometers, which was overcome by the introduction of transforms, such at the Fourier or Hadamard transforms. This article describes the use of information technology based on pseudo-random injection sequences derived from Hadamard matrices to perform rapid sample injections to increase the number of samples that can be analysed. This approach, called high-throughput multiplexing gas chromatography (htMPGC), offers a novel way to enhance the overall duty cycle, improve signal-to-noise ratio (S/N) and, ultimately, achieve extraordinarily high sample throughputs.
Screening of potential catalysts, drugs and lead structures or disease markers in medical diagnostics is of considerable scientific and economic interest.1 Parallelized high throughput assays are widely used to identify and quantify reaction products and determine conversions.2,3 Separation techniques play a dominant role in screening samples of high-throughput assays because highly complex compositions can be investigated with high precision and reproducibility. It is interesting to note that the bottle-neck in the screening of potential materials has shifted to the primary and — in particular — the secondary screening steps because sample preparation can be easily parallelized and automated to achieve high throughputs. Chromatographic methods are often time-consuming and limit the overall performance. Therefore great efforts have been made to improve the overall speed by optimizing continuous injections or using fast and parallelized separation techniques.5,6
Another approach to enhance the analytical performance is the use of miniaturized separation devices, which minimize reagent consumption, reduce analysis time, provide good separation efficiency and detection sensitivity, and increase the overall sample throughput.7–9 However, the optimization of such systems can be time-consuming, especially for varying analyte concentrations.
In the context of a secondary screening of potential catalysts, the feasibility of performing continuous real-time sampling in parallelized high-throughput assays is of great interest because detailed kinetic studies provide insights into activation and deactivation processes and long-term stabilities. Typically such investigations are performed in single-batch systems or samples from parallel reactors are sequentially analysed. This situation can be compared with continuous wave spectroscopy where the duty cycle is low and typically most of the acquisition time is spent recording detector noise.
Multiplexing techniques — where multiple sources of information are combined and later mathematically deconvoluted — based on Fourier and Hadamard transformations,10,11 have completely changed this situation in spectroscopy12 and mass spectrometry (MS),13,14 to increase the duty cycle and improve the signal-to-noise ratio (S/N). This improvement is known as the Fellgett advantage.15 Previous attempts to apply multiplexing to separation techniques focused mainly on the S/N improvement of a single sample.
The first report about the use of a transform technique in GC was published by Izawa et al. in 1967.16 This paper described a process gas chromatograph that continuously analysed injected gas samples (oxygen/nitrogen mixtures) using a pseudo-random binary signal generator. The output signal from the detector was gated by shifted input signals and filtered to continuously indicate the area of the corresponding chromatogram pattern of each component of interest. This experimental setup allowed simultaneous monitoring of several gas streams with only one separation column and because of the multiplexing advantage, the analysis could be performed more accurately and effectively. Obst17 developed a similar approach making use of the carrier gas pressure modulation according to a sinus function. Smit18 introduced pseudo-random binary sequences in trace analysis using GC and later also transferred this technique to LC.19,20 Here, sample injections were modulated with a 6-bit pseudo-random binary sequence (26 – 1 = 63 elements) applying a time interval of 5 s between each element of the pseudo-random binary sequence. The gas chromatogram obtained was then crosscorrelated with the measured signal.
In a series of publications Annino et al.21–23 explored multiplexing in GC to find optimum conditions for the effective use of correlation chromatography. An application of this technique is the continuous analysis of a process stream to measure small deviations. The pseudo-random binary modulation sequences between 10- and 11-bit (511 and 1023 elements, respectively) were generated by hard-wired correlators with a shift register and later by software, which gives a greater flexibility in the calculation. To minimize correlation noise caused by non-linearity of the distribution isotherms of an analyte between the mobile phase and the stationary phase, Phillips et al. developed a deconvolution algorithm based on the Fourier transform.24–26 Kaljurand and Küllik used pseudorandom injection pattern with a 6-bit sequence (63 elements) in GC to analyse polymers by pyrolysis in a continuous mode.27,28 Annino et al. and Küllik et al. reported in their publications that an optimal Fellgett advantage is achieved if the sample volume and concentration are low compared with conventional sample injection. Peak resolution typically was not changed by multiplexing.
Early injection valves used for multiplexing in GC consisted of pneumatic valves to rapidly transfer the injection volume onto the separation column. Technical advances in this field make injections more precise and shorter injection times can be applied. Another type of injector for multiplexing GC was developed by Engelsma et al. based on a spark modulator.29 This modulator consists of a flow-through cell with two electrodes where a voltage of –5 to +5 kV is applied to generate a spark. The spark oxidizes the volatile organic compounds (VOCs) when air is used as carrier gas. Therefore the pseudo-random binary sequence controls the areas where the VOCs are erased and the oxidation products are not detected. Very recently, Lin et al. coupled Hadamard transform GC and Hadamard transform HPLC with MS.30,31 For the GC experiments, injections were controlled by an electromagnetic valve, while for the LC experiments an electronically controlled syringe pump in combination with a T-connector was used. Both of the injection devices permitted precise, successive injections, resulting in clearly modulated chromatograms encoded by Hadamard matrices. After an inverse Hadamard transform of the encoded chromatogram, the S/N of the signals were substantially improved compared with those expected from theoretical values. The S/N was enhanced about 10-fold in Hadamard transform GC–MS and 6.8 in Hadamard transform LC–MS, using 10-bit and 11-bit modulation sequences, respectively.

Figure 1: (a) Conventional gas chromatogram of a gas mixture containing five components; (b) multiplexed gas chromatogram consisting of a convolution of the chromatogram depicted in (a).
In information technology, efficient transmission of information from different sources is achieved by the mixing of signals and later this multiplexed information is deconvoluted to retrieve the individual information input. Based on this concept, we have recently developed high-throughput multiplexing chromatography to achieve very high sample throughputs (currently of up to 453 samples/h) by using structured modulation sequences which can also address single samples.32–35
In contrast to a conventional separation [Figure 1(a)], where a sample is injected and the chromatogram is recorded until all analytes are eluted from the column, in multiplexing chromatography samples are continuously injected onto a column according to a pseudo-random sequence giving a convoluted chromatogram [Figure 1(b)].
Here, the experimental requirements, theory of operation and differences of MPGC and high-throughput multiplexing GC (htMPGC) are presented and discussed.
Experimental
All GC measurements were performed on a Focus GC (Thermo Fisher Scientific, San Jose, California, USA) equipped with a split injector and a flame ionization detector (FID) — both at 250 °C. The GC settings were controlled by the ChromCard software (Thermo Fisher Scientific).
All separations were performed on a fused-silica column coated with GE-SE-30 (dimethylpolysiloxane) 25 m x 0.25 mm i.d., 0.5 µm film thickness (Macherey & Nagel, Düren, Germany) at 50 °C and 80 kPa head pressure. Helium was used as inert carrier gas and the split ratio was set to 1:200. Data was acquired at 10 Hz.
The experimental setup consists of a laboratory-built onechannel or six-channel continuous-flow split/splitless injector with a heated sample port (250 °C), separately controlled by a fast 3/2 way solenoid valve (SMC corporation, Tokyo, Japan). The injector was manufactured from brass and is equipped with heating cartridges and a thermocouple to exactly control temperature. The sample ports are equipped with glass sleeves chemically deactivated with chlorotrimethylsilane. The multiplexing injectors used were directly mounted onto the split/splitless injector of the GC.
Samples were continuously pumped through fused-silica capillaries (0.05 mm i.d.) into the sample port of the multiplexing injector and are continuously evaporated. The samples are repetitively injected into the split/splitless injector of the GC by short pressure pulses between 1 ms and 5 ms with He (400 kPa) according to the binary pseudo-random sequence. The multiplexing injector is purged through the injection needle by the split/splitless injector of the gas chromatograph.
The n-bit binary pseudo-random sequences used throughout all experiments consist of N elements (N = 2n – 1) with 2n /2 = 1 elements '0' and 2n /2 elements '1', which are derived from an (n + 1) x (n + 1) Hadamard matrix. The modulation sequence was generated by a program written in Delphi (Embarcadero Technologies, South San Francisco, California, USA). Only for elements equal to 1 are sample injections performed. The modulation sequences were transmitted to a USB computer AD/DA converter interface. The signal of this is amplified by a transistor network and directly transmitted to the solenoid valves of the multiplexing injector. These signals are between 1–20 ms broad and open the solenoid valves for a pressure pulse to transfer the sample volume into the split/splitless injector of the Focus GC (Thermo Fisher Scientific). Data of the flame ionization detector (FID) was acquired at 10 Hz with the ChromCard software. The data acquisition was started by the software controlling the multiplexing injector. The data trace of the FID was converted into ASCII format for the data deconvolution. The Hadamard transformation and data deconvolution is performed by a program written in Delphi (Embarcadero Technologies).
Multiplexing Gas Chromatography
The experimental of multiplexing gas chromatography (MPGC) consists of a one-channel continuous-flow split/splitless injector, directly mounted onto the conventional split/splitless injector of a GC, with a heated sample port (250 °C), where small sample amounts are continuously evaporated and injected by short pressure pulses, which are controlled by a fast 3/2 way solenoid valve. To achieve a steady and stable sample flow, the sample is pumped by a syringe pump through a fused-silica capillary (50 µm, 2 m) into the sample port of the multiplexing injector. The samples are repetitively injected into the split/splitless injector of the GC by short pressure pulses of 2 ms with He (400 kPa) according to the binary pseudo-random sequence. The multiplexing injector is purged through the injection needle by the split/splitless injector of the gas chromatograph.

Figure 2: Multiplexed gas chromatogram and Hadamard transformed gas chromatogram obtained by injection according to a 9-bit Hadamard sequence with a modulation time interval Ît = 1 s. 25 m GE-SE30 fs-capillary (i.d. 250 µm, film thickness 500 nm), isothermal separation conditions at 50 °C, 80 kPa inlet pressure, He as inert carrier gas.
The n-bit binary pseudo-random sequences consist of N elements (N = 2n – 1) with 2n /2 – 1 elements '0' and 2n /2 elements '1', which are derived from an (n + 1) x (n + 1) Hadamard matrix. These sequences are constructed by the use of a virtual shift register applying logical operations. Sample injections are only performed for elements equal to 1. These signals are between 1–20 ms broad and open the solenoid valves for a pressure pulse to transfer the sample volume into the split/splitless injector of the GC.
After the separation, the conventional chromatogram is obtained by Hadamard transformation of the 2n /2 overlapping chromatograms according to the following equation:

The raw chromatogram is transformed into the circular representation which means that the time bins greater than the sequence length multiplied by the data acquisition rate are added to the beginning of the chromatogram. This chromatogram is then multiplied by the inverse simplex matrix obtained from the corresponding Hadamard matrix.
In Figure 2 a multiplexed gas chromatogram obtained by injection according to a 9-bit Hadamard sequence with a modulation time interval t = 1 s and the corresponding Hadamard transformed gas chromatogram is depicted. It is important to point out that a noticeable multiplexing advantage is only achieved for long injection sequences, which requires short injection intervals t to perform experiments within reasonable time frames. The right selection of the sequence length and injection interval t is crucial for the successful deconvolution process. Sequences that are too short can lead to displaced peaks, giving wrong retention parameters. Recently, we have investigated such effects in detail. It must be noted that the deconvolution of multiplexed chromatograms based on the Hadamard transform do not need any information from conventional chromatograms to retrieve the chromatogram.However, it is of great advantage to have information about the expected maximum retention time to start with optimum parameters.
In Figure 3 multiplexed gas chromatograms and corresponding Hadamard transformed gas chromatograms obtained by injections according to an 11-bit sequence at various modulation time intervals of t = 5 s, t = 1 s, and t = 600 ms are depicted.
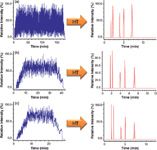
Figure 3: Multiplexed gas chromatograms and corresponding Hadamard transformed gas chromatograms (a)â(c) obtained by injection according to an11-bit sequence at various time intervals of Ît. (a) Ît = 5 s, (b) Ît = 1 s, and (c) Ît = 600 ms. 25 m fs-capillary (i.d. 250 µm), coated with 500 nm SE-30, isothermal conditions at 50 °C, 80 kPa He as inert carrier gas.
With decreasing modulation time intervals t the overall experimental time is decreased and it is obvious from these chromatograms that the modulation structure in the second half of the raw chromatograms is less developed for the very rapid modulation at 600 ms. Despite this apparent loss in modulation structure, the Hadamard transformed chromatograms still show the complete information of the five components and the integrals are also conserved. However, the peak shapes are changing slightly and the first two peaks are getting narrower, which indicates higher separation efficiencies. The increasing efficiency can only be explained by the way of sample injection. The pressure in the multiplexing injector is slightly increased for rapid injections, which can lead to a bunching effect. Very rapid injections also reduce the concentration of the evaporated analytes, because analyte accumulation over longer time periods (5 s) is not possible. Therefore only minute sample amounts are transferred within 1 ms onto the separation column.
It is important to note that MPGC performed with single samples only increase the duty cycle of the chromatographic system and that the S/N (maximum gain = √N/2 with the sequence length N) and separation efficiencies can be altered. This is quite attractive to monitor, for example, continuous sample flows with very small fluctuation in concentrations, or even complete changes in concentrations when reactions are monitored. To increase the sample throughput htMPGC can overcome these limitations and open completely new research areas.
High-Throughput Multiplexing GC
The advantage of using pseudo-random sequences for sample injections compared with equally spaced sample injections is that systematic peak overlapping and therefore loss of information can be excluded. Essentially, this pseudorandom sequence represents a bar-code, which is commonly used for machine-readable identification of single items.
To increase the sample throughput this bar-code is split into bar-codelets, which are assigned to individual samples with similar analyte composition but different concentrations (Figure 4). The concept of htMPGC is that the complete bar-code stores the averaged analyte information over all samples, the bar-codelets store the concentrations of the individual samples.
To achieve seamless injection of different samples at a modulation interval of only 5 s down to 500 ms a multi-port multiplexing injector is necessary. Such a multi-port injector with typically four or six ports (Figure 5) is very similar to the single port injector. However, precise control of sample and carrier gas flow is necessary to avoid sample mixing.
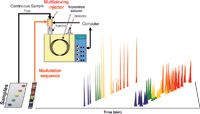
Figure 4: Schematic experiental setup of high-throughput multiplexing gas chromatography (htMPGC) to analyse N samples. Samples are sequentially injected by the multiplexing injector by application of short and precise pressure pulses of 1 ms to 5 ms to transfer samples onto the separation column according to an n-bit binary pseudo-random sequence consisting of 2n-1 time bins with time bin intervals t in the range of milliseconds to seconds. This sequence is divided into bar-codelets each encoding an individual sample of the N-fold sample array for unambiguous identification of the samples. The 3D plot illustrates the temporally shifted chromatograms obtained by repetitive sample injections according to the bar-codelets of the n-bit binary pseudo-random sequence. Experimentally only the convoluted chromatogram, which represents the sum of chromatograms, can be obtained.
The samples are rapidly injected by the multiplexing injector onto the separation column according to a n-bit binary pseudo-random sequence. As already pointed out, the binary pseudo-random sequence in turn is divided into sub-sequences [coloured bar-code assigned to individual samples of a 96-well plate (Figure 4)], which encode individual samples with similar analyte composition but different concentrations. A prerequisite of this technique is that the measured samples are very similar in composition, which means that not necessarily all components need to be present in all samples, but they must not be composed of very different components.
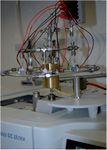
Figure 5: Photo of a six-port multiplexing injection valve mounted on a GC.
This is because the total bar-code conserves the information over all samples. The advantage is that by using Hadamard-based encoding no information about the analytes is necessary from conventional measurements, because the Hadamard transform retrieves this information. These bar-codelets are used to control the time-shifted repetitive injections of each sample by a computer. Structured repetitive injections are necessary to unambiguously identify the individual samples in the deconvolution process. The analytes of each injection are separated in the separation column yielding time-shifted chromatograms (Figure 4). The measured chromatogram is a convolution of these overlapping time-shifted chromatograms.
The following requirements are necessary to achieve an increase in the sample throughput:
- short injection intervals
- stable and reproducible sample injections onto the separation column
- long binary pseudo-random sequences to modulate a high number of sample injections
- division of the binary pseudo-random sequences into subsequences with equal and sufficient information content to encode the individual samples.
To achieve a high sample throughput and to minimize the overall analysis time, short and precise modulation time intervals t in the range of 500 ms to 5 s are necessary. It is also important to point out that in typical Hadamard transform GC experiments the modulation time interval t also defines the injection pulse duration, which leads to box-car-shaped concentration profiles on the separation column. Here, only injection pulses in the range of milliseconds are applied. Compared with a conventional injection system, such as a liquid autosampler, these short injection pulses lead to bunched sample volumes. We could demonstrate that on average the peak width wh decreases by a factor of 3 ± 20%, which in turn improves the separation efficiency [~(1/wh)2]. The split injector and the electronically controlled gas flow of the GC reduce pressure and gas flow fluctuations, and thus minimizes deviations in the retention times tR of the injected analytes. With such a multi-port multiplexing injector up to 3000 injections/h (t = 0.6 s, 50% duty cycle) from different sample ports can be achieved.
To obtain the relative concentrations of the analytes in each sample, a deconvolution algorithm for the raw data has to be applied. The single steps are depicted in Figure 6 for the evaluation of an htMPGC experiment to analyse 102 samples consisting of a mixture of methanol and tert-butanol obtained by injection according to an 11-bit Hadamard sequence with a modulation time interval t = 1 s and 10 repetitive injections for each sample.
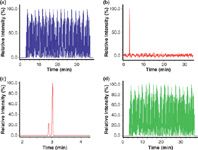
Figure 6: Evaluation of an ht-MPGC experiment to analyse 102 samples consisting of a mixture of methanol and tert-butanol obtained by injection according to an 11-bit Hadamard sequence with a modulation time interval t = 1 s and 10 repetitive injections per sample. (a) Raw chromatogram; (b) Hadamard transformed raw chromatogram to obtain the average composition of all samples; (c) zoomed and smoothed Hadamard transformed raw chromatogram to obtain chromatographic parameters of the single peaks to perform the evaluation; and (d) evaluated ht-multiplexing chromatogram.
In the first step the raw chromatogram is Hadamard transformed to obtain an overview chromatogram containing the information about the number of analytes and their retention times tR and peak width wh [Figure 6(b)]. Because of the different analyte concentrations this chromatogram is quite noisy — it has to be pointed out that the apparent noise convolutes the desired information. Therefore the chromatogram is first smoothed to extract the peak data [Figure 6(c)]. This data is then used to fill a matrix ΦAi,j(t) according to the known structured modulation sequence. In a first step, elution profiles considering the chromatographic data and the bar-codelets are calculated for the single analytes, representing a single row of this matrix. The complete matrix represents the peak shapes of the individual sample injections and their analytes. The product of the matrix with the unknown concentration vector (Ai) is the convoluted raw data [Figure 6(a)]. To solve such a linear equation system a Gauss-Jordan algorithm is applied. The final result is the concentration vector (Ai), which can be multiplied with the normalized analyte peak shape matrix to calculate a conventional chromatogram of a single sample:

The relative peak areas are determined by integration of the obtained sub-chromatograms. Deviations in the peak area integration caused by the deconvolution process are determined by subtraction of the deconvoluted chromatograms from the raw chromatogram [Figure 6(d)]. In this example 150 samples/h can be analysed.
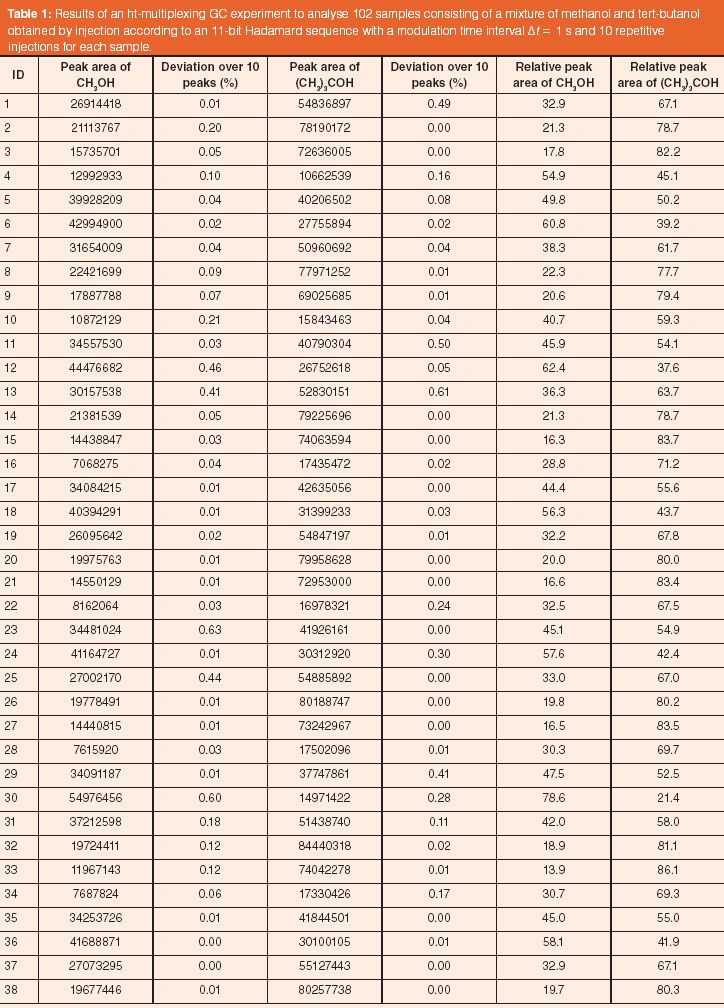
Table 1: Results of an ht-multiplexing GC experiment to analyse 102 samples consisting of a mixture of methanol and tert-butanol obtained by injection according to an 11-bit Hadamard sequence with a modulation time interval Ît = 1 s and 10 repetitive injections for each sample.
In Table 1 the obtained data of the evaluation of the experiment depicted in Figure 6 with 102 samples analysed by using an 11-bit modulation sequence is summarized.
To unambiguously self-encode individual sample injections the n-bit binary pseudo-random sequence (barcode) is divided into sections of equal information content (barcodelets), which represent repetitive injections for each sample. With increasing sample complexity more repetitive injections are necessary. The minimum number of necessary repetitive injections rmin can be obtained from the number of elements '1' in a modulation sequence and the maximum number of samples imax that can be analysed:

For the unambiguous determination of a single analyte j of sample i the product ( jmax X imax) of the maximum numbers of analytes jmax and maximum number of samples imax must not exceed the maximum number of data points acquired by htMPGC. The number of data points can be calculated from the sum of the sequence length N and the maximum retention time divided by the time bin interval t, and multiplied by the data acquisition frequency f (Hz). Therefore, the maximum number of samples imax that can be unambiguously determined is:

The throughput power P of an htMPGC analysis is expressed by the ratio of the maximum number of samples imax and the total duration tmax:

Figure 7 shows another example of an htMPGC experiment with five analytes obtained by injection according to an 11-bit Hadamard sequence with a quite slow modulation time interval t of 10 s and 50 repetitive injections for each sample. The slow modulation leads to pronounced step functions in the raw chromatogram, which indicates reproducible injections over 50 repetitive injections. Furthermore, all samples were injected four times to show also the repeatability of the injections (Figure 7).

Figure 7: High throughput multiplexing gas chromatogram obtained by injection according to an 11-bit Hadamard sequence with a modulation time interval t = 10 s and 50 repetitive injections per sample. (Left): Raw chromatogram, (Right): Hadamard transformed raw chromatogram.
The maximum mean standard deviation (SD) between experimental data and the evaluated data is 1.4% and the average SD is 1.0% of the peak area ratios in relation to the first eluted peak of each sample. This data was also compared with the peak area ratio of the conventionally measured samples. There, the maximum mean SD is 0.5% and the average is 0.3%, which demonstrates a high agreement between conventional GC and htMPGC.
Conclusions
The htMPGC technique presented here increases the chromatographic information content and at the same time decreases the overall analysis time. Very high sample throughputs of similar samples can be achieved, which is of great interest in the screening of reactions and potential catalysts. Furthermore, time-resolved quantification of analytes can be envisaged, which is highly useful to perform real-time analysis for kinetic and mechanistic studies in catalysis. The application of this approach to other separation techniques and in particular to ultra-fast separation techniques can be envisaged to maximize the sample throughput in future applications.
References
1. O. Trapp, J. Chromatogr. A, 1184, 160–190 (2008).
2. F. Schüth et al., Catal. Today, 117, 284–290 (2006).
3. C. Jäkel and R. Paciello, Chem. Rev., 106, 2912–2942 (2006).
4. K. Jähnisch et al., Angew. Chem., 43, 410–451 (2004); Angew. Chem. Int. Ed., 43, 406–446 (2004).
5. B.M. Paegel et al., Proc. Natl. Acad. Sci. USA, 99, 574–579 (2002).
6. S. Yao et al., Proc. Natl. Acad. Sci. USA, 96, 5372 (1999).
7. D.J. Harrison et al., Science, 261, 895–897 (1993).
8. G.M. Whitesides, Nature, 442, 368–373 (2006).
9. T. Vilkner, D. Janasek and A. Manz, Anal. Chem., 76, 3373–3386 (2004).
10. P.R. Griffiths, Transform Techniques in Chemistry (Plenum Press, New York, 1978).
11. A.G. Marshall, Fourier, Hadamard, and Hilbert transforms in chemistry (Plenum Press, New York, 1982).
12. R.R. Ernst and W.A. Anderson, Rev. Sci. Instrum., 37, 93 (1966).
13. M.B. Comisarow and A. G. Marshall, Chem. Phys. Lett., 25, 282–283 (1974).
14. O. Trapp et al., Angew. Chem., 116, 6703 (2004); Angew. Chem. Int. Ed., 43, 6541 (2004).
15. P. Fellgett, J. Sci. Instrum., 35, 257 (1958).
16. K. Izawa et al., Ind. Chim. Belge, 32, 223 (1967).
17. D. Obst, J. Chromatogr., 32, 8–16 (1968).
18. H.C. Smit, Chromatographia,3, 515 (1970).
19. H.C. Smit, Trends Anal. Chem., 2, 1–7 (1983).
20. M. Engelsma, W.T. Kok and H.C. Smit, J. Chromatogr., 506, 201–210 (1990).
21. R. Annino and L.E. Bullock Anal. Chem., 45, 1221–1227 (1973).
22. R. Annino and E. Grushka, J. Chromatogr. Sci., 14, 265–270 (1976).
23. R. Annino, M.F. Gonnord and G. Guiochon, Anal. Chem., 51, 379–382 (1979).
24. J.B. Phillips and M.F. Burke, J. Chromatogr. Sci., 14, 495–497 (1976).
25. D.C. Villalanti, M.F. Burke and J.B. Phillips, Anal. Chem., 51, 2222–2225 (1979).
26. J.R. Valentin, G.C. Carle and J.B. Phillips, Anal. Chem., 57, 1039 (1985).
27. M. Kaljurand and E. Küllik, J. Chromatogr., 171, 243–247 (1979).
28. M. Kaljurand, M. Koel and E. Küllik, Anal. Chim. Acta, 239, 317–319 (1990).
29. M. Engelsma and H.C. Smit, Chromatographia, 31, 393–397 (1991).
30. C.C. Cheng et al., J. Sep. Sci., 33, 626–630 (2010).
31. Z. Fan et al., J. Chromatogr. A, 1217, 755–760 (2010).
32. O. Trapp, Angew. Chem., 119, 5706–5710 (2007); Angew. Chem. Int. Ed., 46, 5609–5613 (2007).
33. O. Trapp, Nachrichten aus der Chemie, 54, 1111–1114 (2006).
34. O. Trapp, Chemistry Today, 26, 26–28 (2008).
35. O. Trapp, J. Chromatogr. A, in press (2010).
Oliver Trapp is full professor of organic chemistry at Ruprecht-Karls-Universität Heidelberg, Germany. His awards include the Prize of the Analytical Chemistry Division of the German Chemical Society (2003), the Heinz MaierLeibnitz Award 2008 of the German Science Foundation, the Innovation Award 2008 of the Northrhine-Westphalian Ministry of Innovations and an ERC Starting Grant in 2010.
Miniaturized GC–MS Method for BVOC Analysis of Spanish Trees
April 16th 2025University of Valladolid scientists used a miniaturized method for analyzing biogenic volatile organic compounds (BVOCs) emitted by tree species, using headspace solid-phase microextraction coupled with gas chromatography and quadrupole time-of-flight mass spectrometry (HS-SPME-GC–QTOF-MS) has been developed.


