High-Throughput Experimentation: Where Does Mass Spectrometry Fit?
Special Issues
In the pharmaceutical industry, the use of mass spectrometry in high-throughput experimentation (HTE) has increased, thanks to the technique’s speed, sensitivity, and selectivity. We systematically evaluate the applicability of multiple MS techniques for different types of HTE samples and purposes, reviewing the pros and cons, and provide practical recommendations, Illustrated by application case studies.
Mass spectrometry (MS) has gained increasing popularity in the analysis of high-throughput experimentation (HTE) samples, thanks to its speed, sensitivity, and selectivity. However, MS is not necessarily the best choice for all HTE samples, and MS alone without separation techniques may not be applicable for all HTE studies, depending on the sample properties and the purpose of the studies. In this article, we discuss different types of HTE samples and the analytical purposes of these studies. We systematically evaluate the applicability of multiple mass spectrometry techniques in different situations, and compare the pros and cons of each technique. We provide practical recommendations through critical reviews of high-throughput mass spectrometry options and application case studies.
High-throughput experimentation (HTE) is the simultaneous execution of a large number of experimental conditions. It is usually conducted in 96-, 384- or 1536-well microtiter plates, which has the significant advantage of saving time, effort, and materials compared to a traditional one-condition-at-a-time approach. HTE has gained increasing popularity in synthetic chemistry (1), especially in the pharmaceutical industry (2,3). Chemists have been successfully utilizing HTE in screening reaction conditions and scavengers, and studying compound properties such as solubility, crystalline polymorphism, and salt forms. HTE has become more popular in the pharmaceutical industry for several reasons. First, high-throughput sampling enables chemists to efficiently explore routes for difficult or unprecedented chemistry. Second, the miniature nature of HTE allows chemists to obtain the maximum knowledge from the scarce amount of test material, which is especially important in research and in the early compound development phase. Lastly, the fact that various experimental conditions can be explored in the same HTE significantly broadens the scope of reaction testing, and improves the chance of successful hits.
While HTE is typically highly efficient for the total cycle time including automated reagent dispensing, incubation, and workup in less than 24 h, the most time-consuming step resides in the analysis of the samples. While the application of mass spectrometry (MS) in high throughput analysis of bioassays has been well established, its application in chemistry HTE is less discussed, and is the focus of this article. Currently, high performance liquid chromatography with ultraviolet detection (HPLC-UV) has been the most commonly used, where HPLC provides selectivity toward the compounds of interest by separating the multiple components in the experimental mixture, and ultraviolet (UV) detection provides quantitation. However, the cycle time for HPLC-UV analysis can be forbiddingly long. It usually starts with HPLC method development based on known reaction components, such as starting materials, products, and reagents. Another compelling challenge is that reaction side products or intermediates cannot always be predicted for all conditions, so the HPLC method development is semi-blinded, and the final method may not be sufficient for selective analysis. Aside from the significant method development effort and challenge, the HPLC analysis time of the HTE plate is a huge hurdle in HTE efficiency. Take a typical HPLC run of 10 min for example; it takes over 16 h to run a 96-well plate, and 64 h and 256 h to run 384- and 1536-well plates, respectively. Spectroscopy-based plate readers such as UV or fluorescence readers provide much higher speed, but lack necessary specificity. A promising and popular alternative is MS, which provides superior selectivity based on the masses of analytes. Ideally, researchers can bypass HPLC and use MS for enhanced speed. However, in real-world practice, there are limitations to such an approach. This article discusses the applications of MS in different HTE scenarios by a combination of critical review and case studies, to identify its key advantages and challenges, and provide practical recommendations for users. The article discusses popular types of HTE and their respective analysis demands, reviews popular high-throughput MS options, provides comparisons of pros and cons with two case studies, and ends with practical application guidance. To understand the different scenarios, let's take a look of some popular types of HTE.
Types of Pharmaceutical HTE Samples
Reaction Screening
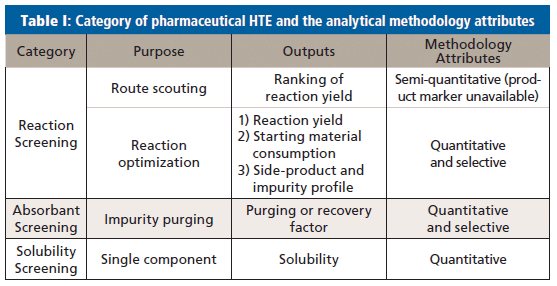
Depending on the phase of a project, there are two categories of reaction screening. The first is route scouting, where chemists are developing a new chemical synthesis route by trying a combination of conditions such as reagents, catalysts, and solvents, for a specific chemical transformation. The goal at this stage is to identify a promising hit that yields the desired product. Quantification is less important, and generally not pursued because in most cases product markers are not available. Complete side product profiling is not usually performed at this stage either. A semi-quantitative analytical strategy is sufficient for route scouting, but the strategy has to provide sufficient selectivity for the targeted product.
The second category is process optimization, where chemists are optimizing reaction conditions to maximize yield, control impurities, or identify process-friendly options. In these cases, a quantitative analytical strategy is needed, and the analytical methodology has to be selective, not just to ensure accurate quantitation of the targeted products, but also to profile the reaction mixture for comprehensive understanding.
Absorbent Selection
Absorbents (such as functionalized silica and activated carbon) are screened to purge undesired process reagents or impurities, recover process products, and improve optical color properties. The color attributes are normally assessed by plate readers operating in the visible light range. Purging factors or recovery factors are calculated to select the most efficient absorbent; therefore, the analytical methodology has to be quantitative. The screening typically involves multiple components, namely impurities or process reagents to purge, process products to retain, and the selective analytical methodology.
Solubility Screening
There are two categories of solubility screening; the first supports process chemistry development, and the second supports compound characterization and preformulation development. In the first category, solubility of process products, and sometimes impurities, is screened in different solvent systems at different temperatures to select the conditions for product purification, crystallization, and manufacturing. In the second category, solubility of the drug substances is screened at physiological pH levels or in various biorelevant media for compound characterization. The analytical strategy has to be quantitative for accurate solubility measurement. Selectivity is less critical, because a single compound of interest is present in a sample and a situation of mixtures is rare unless the compound is not stable.
Polymorph, Salt, and Crystallization Screening
This type of screening is done to identify new solid forms that display the optimal physiochemical and biopharmaceutical properties. Crystallization and polymorph screening is conducted to explore experimental conditions such as solvents, coformers, temperature, and crystallization methods to discover crystal forms and polymorphs. Salt screening finds salt-forming acids or bases with either achiral or chiral resolution to identify potential salt forms for downstream processing and formulation. Typically, people use birefringence, powder X-ray diffraction (PXRD) and Raman spectroscopy for characterization purposes, so this class of HTE is not the focus of this article. Quantitative liquid chromatography (LC) is only used in chiral resolution or when solubility is measured as part of crystallization screening. MS is not helpful with chiral resolution as it does not resolve stereoisomers.
A summary of desirable attributes of the analytical methodologies for different types of HTE is shown in Table I.
Popular High-Throughput Mass Spectrometry Options
Fast UHPLC-MS
With the advances of HPLC stationary phases such as sub-2-µm particles and ultrahigh-pressure liquid chromatography (UHPLC) instrumentation that can go up to 1500 bar, LC separation can be done at an unprecedented speed. LC analysis can be completed in a couple of minutes or even in <1 min, which provides medium analytical throughput for HTE. Take a 2-min UHPLC method, for example: a 96-well plate takes 3.2 h to complete, and a 384-well plate takes 12.8 h. Although the throughput is the lowest among the options discussed here, HPLC is the most widely used in HTE sample analysis. It provides important benefits of selectivity from chromatography separation, which reduces the matrix interference, and enables impurity profiling. Indeed, if LC sufficiently resolves all components in a mixture, UV is adequate for quantitation purpose and MS is more for the purpose of peak identification. If the selectivity of MS is sufficient without LC separation and can quantify the analyte in the presence of coelutions, we could bypass LC method development and utilize a fast generic LC method. Further discussion is detailed in Case Study III.
FIA-MS and MISER
Flow injection analysis-MS (FIA-MS) is a fast approach typically operated on an HPLC instrument by bypassing the separation and using MS to quickly signal the presence of compounds of interest. FIA-MS is generally used for qualitative or semi-quantitative analysis for preliminary reaction screening. Because of the ion suppression from coeluted species in the sample, peak area conversion from the calibration standard to the sample can be poor.
A special type of FIA-MS is multiple injections in a single experimental run (MISER), where a short LC column is used for isocratic rough separation, and MS is used for selective semi-quantitation of compounds of interest. Welch and associates have reported application of MISER with selected ion monitoring (SIM) for reaction screening (4,5). A key highlight of the methodology is the simplicity of data presentation, where the chromatograms of all reactions are compiled in a single graph for easy eyeballing of promising conditions without further peak integration and analysis. The analytical speed is limited by HPLC autosampler injection speed. Conventional HPLC typically has an injection cycle time of 20 to 30 s, and analysis of a 96-well plate takes less than 1 h. MISER largely improves analytical efficiency compared to conventional FIA-MS, however, chromatographic separation is usually not guaranteed with isocratic condition in 20 to 30 s. Coelution is common, and carryover of late-eluting species is possible. Some experiment data and details are discussed in Case Study I.
Online SPE-MS
The coupling of electrospray ionization (ESI) time-of-flight (TOF) or triple-quadrupole MS with an online solid-phase extraction (SPE) system and an ultrafast autosampler is an efficient way to acquire MS data without matrix interference. Rapid Fire is an example of such instrumentation. The analysis time for each sample is 5–10 s, and a 96-well plate takes around 20 min to finish. The SPE depletes salts and other unretained species in the sample matrix, which reduces matrix interference compared to flow-injection ESI-MS or MALDI-MS (6,7). Such an online SPE-MS strategy has found successful applications in high-throughput target screening and biotransformation screening, with a single matrix in the same screening. However, this strategy is less appropriate in chemistry screening; first, because the matrix varies from well to well; second, because SPE method development is needed to ensure that the compound of interest can be eluted, and this may not be possible when markers for products, impurities, or intermediates are not available; and third, because a single SPE condition is used in each run, and the SPE recovery may be inconsistent for different components in the sample, with some enriched and some depleted. Therefore, the quantitative results may be biased.
MALDI-MS
Matrix-assisted laser desorption–ionization-MS (MALDI-MS) is one of the fastest MS approaches for high-throughput applications on the commercial market. Modern MALDI-MS can operate as fast as 10 ms per sample, and a 96-well plate can take less than 10 s to complete, which is ideal for high-throughput analysis applications. However, MALDI-MS has been believed to underperform in analysis of compounds with low molecular weights, because the mass range under m/z 1000 is dominated by matrix-derived interferences on a MALDI-MS spectrum (8). These ions can significantly suppress the ionization of compounds of interest, impairing sensitivity. A MALDI-TOF-MS mass spectrum of a reaction mixture is shown in Figure 1, and the components in the reaction such as starting material, product, and side product were buried in the jungle of interference peaks, making data analysis extremely challenging. Arguably, analysts can screen a variety of matrices to select the ones that introduce the least interference, but this definitely adds to the analysis time and does not guarantee success. Another drawback of MALDI-MS is its poor repeatability (9). It is difficult to achieve homogenous sample distribution in the analyte–matrix co-crystal, because analytes can concentrate on certain regions of the spot (called hot spots). The spot-to-spot variation is therefore large when preparing the same sample at different spots. Isotopically labeled internal standards are usually required for quantitative MALDI-MS analysis, but it is not practical to synthesize a labeled internal standard for each individual reaction from an economy and efficiency standpoint. Therefore, it is very challenging to perform accurate quantitation with MALDI-MS, and its application in small-molecule high-throughput analysis is rather limited.
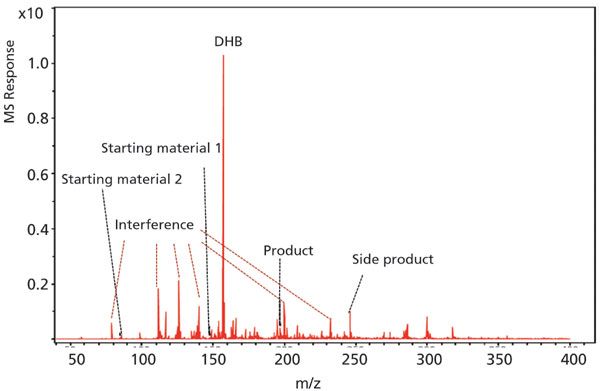
Figure 1: A representative MALDI-TOF-MS spectrum for a chemical reaction mixture showing significant matrix interference.
Other MS Technology
A recent advancement in high-speed MS is found in acoustic mist ionization MS (10,11). This technology utilizes an acoustic transducer to focus the ultrasonic waves to the sample wells, leading to a mist of tiny droplets which can be charged with an applied electrical field. The charges are then transferred to the analytes in the desolvation process and the charged analytes are transited to the mass spectrometer. This technology is also significantly faster at three samples per second. The sampling volume is as small as 2.5 nL. Combined with an open port probe (12,13), the sample droplet can be diluted to the continuous flow of solvent, which can further overcome the ionization saturation challenge. However, this technique is currently still in the development stage for high throughput analysis, noting that only limited solvents can be used for this method.
Case Studies
Application of MISER-MS in Reaction Scouting
During the course of a discovery program, an acetoxylation reaction was pursued (Figure 2) in HTE with 12 oxidants and 8 ligands screened. Because the starting material and product are both defined, SIM-MS can be used to provide better selectivity than a full-scan MS. If the reaction product marker is available, a more selective MS strategy such as multiple reaction monitoring (MRM) can be developed. When using SIM, the analyst should keep in mind that the analytes can experience in-source fragmentation or form different adducts than when protonated, so SIM-MS can have false negatives, and a full scan is recommended as one of the MS events for further scrutiny. Likewise, false positives are possible, because SIM-MS on a single quadrupole only provides unit mass. For comparative study, the 96-well reaction plate was analyzed with both MISER-SIM-MS and conventional LC-UV.
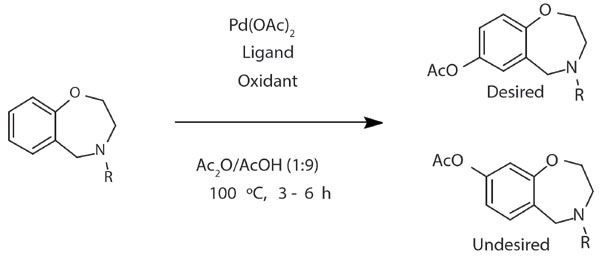
Figure 2: Scheme of the acetoxylation reaction in case study I.
The MISER chromatogram for the product SIM mass is shown in Figure 3a, where each segment represents an individual reaction condition, and all conditions can be visualized simultaneously in a single MISER chromatogram. The conditions that yielded the highest amount of product can be easily selected. On the other hand, the conventional LC-UV analysis resulted in 96 individual chromatograms, each of which was analyzed (Figures 3b and 3c). A comparison of MISER-SIM-MS and LC-UV results unveils two findings. First, there is a positive correlation quantitatively between the two methodologies. For example, reaction well A4 had a strong MISER product signal, and correspondingly there was a significant peak with the same product mass next to the starting material peak on the LC-UV chromatogram. Similarly, reaction well A5 did not have a MISER signal, and the peak with the product mass was not present on LC-UV. Second, the product isomerism can be revealed by LC, but was missed with MISER-SIM-MS. Injecting the targeted product marker with the same LC method showed a different retention time from the reaction products in the HTE screening. In fact, the analysis of the LC-UV of the whole plate reveals that there was no product formation with the correct substitution position. Such regioisomerism was totally overlooked by MISER-MS, leading to false positive findings. Therefore, when the reaction involves potential isomer formation or chiral transformation, flow injection MS is not suitable, and an LC method that provides resolution for the isomers shall be utilized.
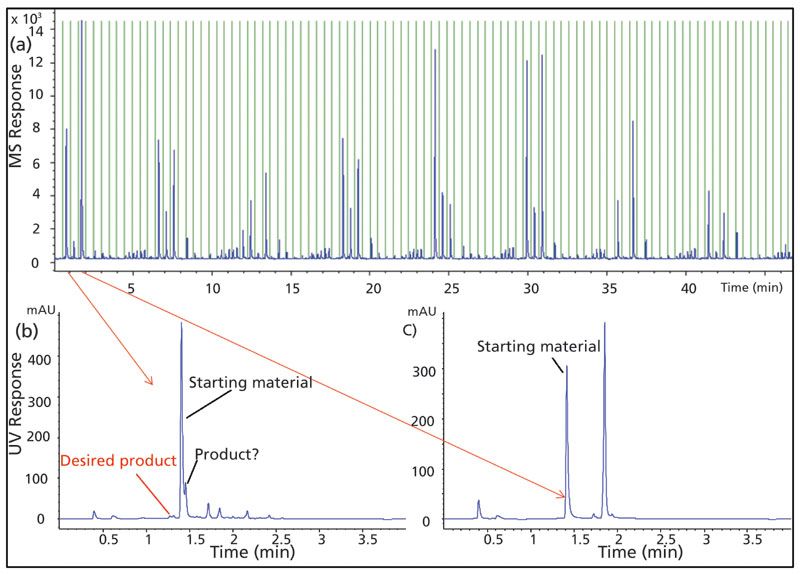
Figure 3: (a) MISER-SIM-MS chromatogram for the product mass of the reaction in case study I; (b) LC-UV chromatogram of reaction well A4 with strong product signal response in MISER-SIM-MS; (c) LC-UV chromatogram of reaction well A5 with no product signal response in MISER-SIM-MS.
Setting the isomer situation aside, MISER-SIM-MS can provide satisfying performance for rank order purposes. MISER-SIM-MS quantitation was assessed by correlating the concentrations calculated from MISER-SIM-MS and LC-UV for the starting materials in the HTE plate. Quantitation was based on respective linearity standards. As shown in Figure 4, there was strong positive concordance between the two series of concentrations, indicating that the MISER-SIM-MS can provide similar performance to LC-UV for reaction rank order. However, the concentrations calculated from MISER-SIM-MS seemed to be systematically lower than those calculated from LC-UV. This is likely because there was limited separation of the multiple components in the reaction mixture with MISER, and the ionization of compounds was suppressed by coeluted species.
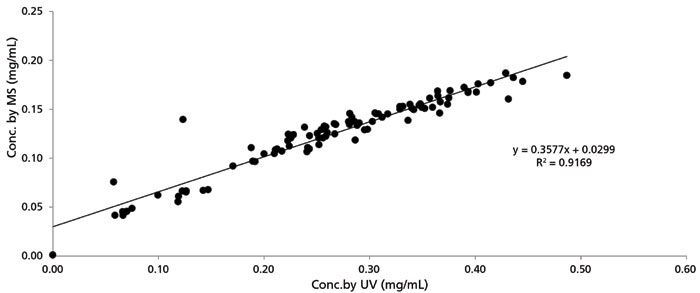
Figure 4: Correlation of analyte concentrations in case study I by MISER-SIM-MS (y-axis) and LC-UV (x-axis).
Although the accuracy of quantitation is not a priority during reaction scouting, a ballpark quantitation is usually necessary to claim a "hit." For example, if a reaction is identified as a "hit," the chemist needs to make sure that the "hit" has reasonable yield to be further pursued on a larger scale, and such information cannot be directly obtained from the MS peak height or peak area alone. The yield can be calculated directly if the product marker is available or indirectly inferred from the starting material consumption under the assumption of mass balance if the product marker is not available. Because of the semi-quantitative nature of FIA-MS, it is usually not appropriate for this purpose, and it is prudent to verify the several "hits" from FIA-MS with other quantitative methods.
The most suitable application of FIA-MS in HTE is probably as a preliminary analytical tool in reaction scouting for the following reasons: first, MS provides selectivity for the reaction product; this is especially helpful for confirmation purpose when the product markers are not available; second, FIA-MS can provide a "yes or no" answer in a straightforward manner without further data analysis or visualization, and such an answer may be sufficient in a reaction scouting; third, FIA-MS provides high analytical throughput and the fast feedback loop allows chemists to explore more reagents and conditions to enable novel chemistry.
Application of LC–MS in Reaction Optimization
A significant limitation of ESI-MS for quantitation purpose is ionization saturation, which can be caused by a limited quantity of available charges, limited evaporation of ions, or limited space on the droplet surface, during the ionization process (14,15). This is an intrinsic limitation of ESI irrespective of downstream mass analyzers. In terms of mass analyzers, a triple-quadruple instrument operated at MRM is generally believed to be the gold standard in bioanalysis in the pharmaceutical industry. We studied the linearity of our model compound lidocaine in the range of 0.1 ng/mL to 10 µg/mL on an LC-triple quadrupole-MS instrument with a 2-min LC method. However, we were only able to establish linearity from 0.1 ng/mL to 100 ng/mL, and the response started to level off at concentrations above as shown in Figure 5, indicating ionization saturation.
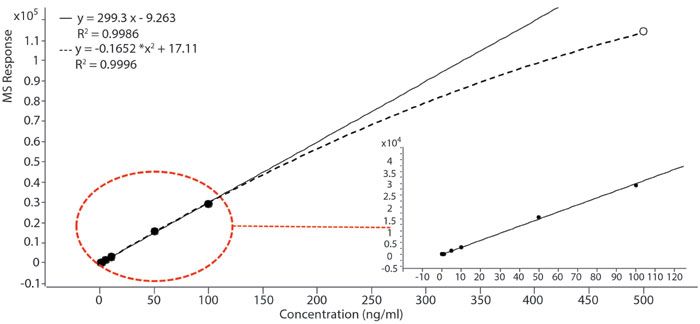
Figure 5: Linear regression of lidocaine (MRM 235 > 86) in the range of 0.1 ng/mL to 100 ng/mL. Data collected on an LC-triple-quadrupole-MS instrument.
The linearity range of MS carries significant implications at high throughput setting. Pharmaceutical HTE is usually executed at the concentrations of a few mg/mL for reaction screening, or even up to 100 mg/mL for solubility screening, which is very different from bioanalytical screening where the sample concentration is much lower. Typically, if followed by LC-UV analysis, a 10- or 100-fold dilution is sufficient, since a linearity range between 0.01 mg/mL and 1 mg/mL (three orders of magnitude or wider) can usually be established with UV at an appropriate wavelength. However, a 105- or even 106-fold dilution is needed to bridge the HTE sample working concentration and MS working concentration ranges, which exerts a significant burden on the sample preparation side, as illustrated in Figure 6. Furthermore, depending on the ionization efficiency, compounds can vary drastically in saturation concentrations and linearity ranges, and the analysts have to change dilution schemes accordingly, making it difficult to develop a consistent sample preparation protocol. The conventional liquid handlers on the market typically have a minimum dispensing volume of 1 or 2 µL. If we want to reduce the usage of dilution solvents and confine the dilution in microtiter plates, at least three steps of dilution have to be performed to achieve the 105- or 106-fold dilution, which is labor intensive and prone to error. Novel liquid dispensing systems that utilize different mechanisms such as acoustic wave can operate in the nanoliter volume range, which can potentially enable single-step dilution in this situation (16). However, the cost of such a system is substantial, and its application with multiple organic solvents remains challenging. Alternatively, dilution can be performed post-column by splitting the sample flow and compensating it with dilution flow. However, the maximum splitting ratio possible is typically around 100, which does not provide sufficient dilution needed for MS analysis.
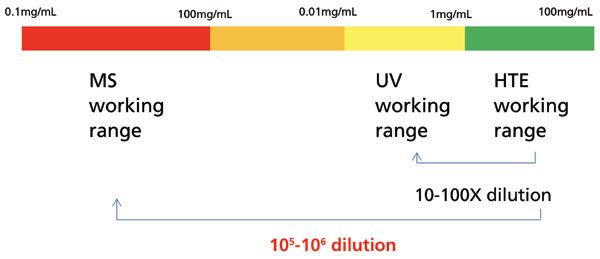
Figure 6: Typical concentration ranges of HTE working conditions, LC-UV quantitation, and MS quantitation.
When sample dilution is addressed appropriately, LC–MS can provide valuable information on the reaction screening both quantitatively and qualitatively. An example is the high-throughput optimization of a borylation reaction, as shown in Figure 7a. There were eight ligands, three bases, and four solvents screened on a 96-well plate. The plate was analyzed with a 2-min method on an LC-triple quadrupole-MS instrument, with MS alternating between MRM events and scan events. An example of the resulting chromatograms is shown in Figure 7b, where the top is the UV chromatogram, followed by an MS scan base peak chromatogram and MRM chromatograms for both starting material and product. The MS scan enables identification of components in the reaction for better understanding. MRM provides quantitative results for both starting material consumption and product formation. A correlation study of the starting material concentrations quantified by MRM and UV shows satisfying results as in Figure 7c.
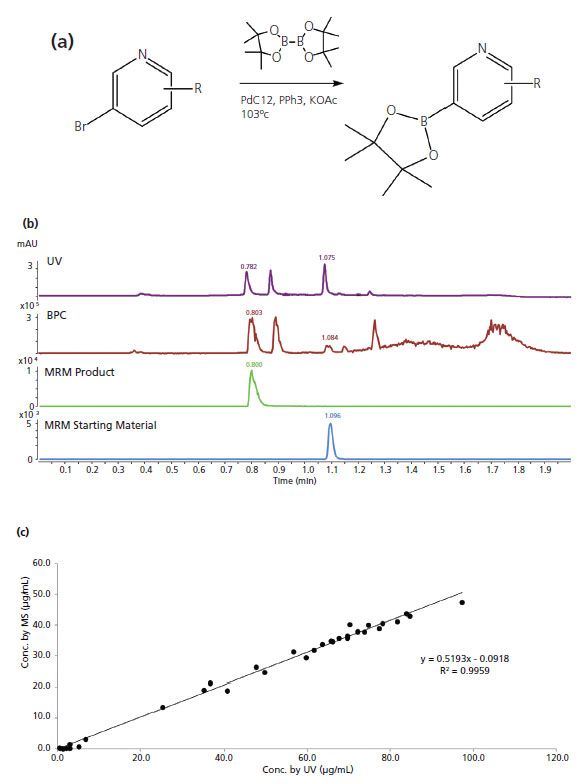
Figure 7: (a) Scheme of borylation reaction in case study II; (b) LC-UV and MS chromatograms from a selected reaction; (c) Correlation of analyte concentrations quantified by MS and UV.
LC-MS Quantitation in the Presence of Coelution
As mentioned earlier, a significant potential advantage of MS coupling with LC is that MS provides additional selectivity to quantify coeluted species, so the analysts do not have to develop an LC method to resolve all components in the mixture. However, this is only true given that the coeluted species are not present in significant amounts to alter the ionization of the analyte of interest. In this study, we have studied quantitation of mepivicaine with coelution of lidocaine to demonstrate this point.
With a short 2-min LC method, lidocaine and mepivicaine were approximately coeluted as shown in Figure 8a. To five mepivacaine solutions at 200 ng/mL, lidocaine was spiked at 2, 10, 20, 100, and 200 ng/mL (1, 5, 10, 50, and 100% relative to the concentration of mepivacaine) respectively, and the peak areas for mepivacaine MRM transition decrease with the increasing concentrations of spiked lidocaine as shown in Figure 8b. The recovery of mepivacaine concentrations dropped from 100% when 2 ng/mL lidocaine was spiked to only 64% when 200 ng/mL lidocaine was spiked (Figure 8b). The coeluted lidocaine substantially changed the quantitation of mepivicaine, because lidocaine significantly suppressed the ionization efficiency of mepivacaine as a structure analog. One intuitive way to mitigate the negative impact of competition is further dilution to free up the "resources" in ESI. Indeed, when the mepivacaine concentration was lowered by 100 fold to 2 ng/mL, spiking lidocaine in the concentration range of 0.5 ng/mL to 50 ng/mL (50 to 2500% relative to the concentration of mepivacaine) did not alter the quantitative results of mepivacaine as shown in Figure 8c. The recovery remained almost unchanged. This demonstrates that the MS indeed has the capability to quantify in the presence of coeluted species, when there is enough margin during the ESI process.
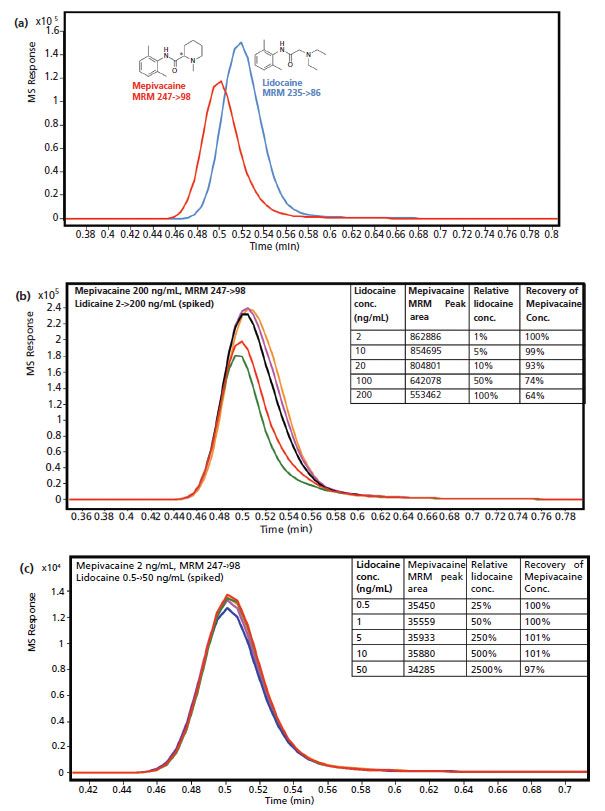
Figure 8: (a) MRM peaks of lidicaine and mepivacaine showed approximate coelution. (b) Peak area of MRM of mepivacaine at 200 ng/mL decreases with increasing spiking concentrations of lidocaine (2 to 200 ng/mL). (c) Peak area of MRM of mepivacaine at 2 ng/mL stays the same with increasing spiking concentrations of lidocaine (0.5 to 50 ng/mL).
On the other hand, the quantitation of mepivicaine is almost impossible with this particular LC method using UV, due to coelution of lidocaine, and LC method development when full resolution is warranted. This is where MS can provide superior selectivity and take dedicated LC method development out of equation.
Conclusion
In this article, we have discussed the demands of high-throughput analysis for chemical high-throughput experimentation, and the benefits and limitations of MS in different HTE application scenarios. Based on the technology review and case studies, we provided practical recommendations for high-throughput analysis applications.
MS is the most helpful in multiple-component situations such as reaction screening and absorbent screening based on the following aspects:
1) When operating in scan mode, MS can provide valuable identification information for the components in mixtures.
2) FIA-MS can provide fast preliminary data to identify "hits" in a reaction, which vastly improves the analysis throughput. A short isocratic column separation with MISER-MS methodology can provide beneficial resolution for compounds, although such resolution is not guaranteed.
3) Fast-LC-MS can offer comparable quantitative data to conventional LC-UV when LC has sufficient resolution. When coelution happens, LC–MS can offer superior selectivity and quantitative results.
Although MS is highly valuable in enhancement of specificity and speed, it has significant limitations with matrix interference and upper quantitation limits. Users have to be mindful of the following limitations and exercise caution when applying the methodology:
1) FIA-MS is less quantitative due to matrix interference; verification of hits with an alternative quantitative methodology is needed.
2) Appropriate dilution is crucial in mass spectrometric quantitation and can pose a significant hurdle in pharmaceutical HTE applications, where sample concentrations are typically high.
3) An MS strategy is not helpful with isobaric compounds, and LC separation is needed in this situation.
References
(1) K.D. Collins, T. Gensch, and F. Glorius, Nat.. Chem. 6, 859–871 (2014).
(2) S.B. Boga, M. Christensen, N. Perrotto, S.W. Krska, S. Dreher, M.T. Tudge, E.R. Ashley, M. Poirier, M. Reibarkh, Y. Liu, E. Streckfuss, L.C. Campeau, R.T. Ruck, I.W. Davies, and P. Vachal, React. Chem. Eng. 2, 446–450 (2017).
(3) S.W. Krska, D.A. DiRocco, S.D. Dreher, and M. Shevlin, Acc. Chem. Res. 50, 2976–2985 (2017).
(4) C.J. Welch, X.Y. Gong, W. Schafer, E.C. Pratt, T. Brkovic, Z. Pirzada, J.F. Cuff, and B. Kosjek, Tetrahedron-Asymmetr. 21, 1674–1681 (2010) .
(5) K. Zawatzky, C.L. Barhate, E.L. Regalado, B.F. Mann, N. Marshall, J.C. Moore, and C.J. Welch, J. Chromatogr. A 1499, 211–216 (2017).
(6) M. Razavi, L.E. Frick, W.A. LaMarr, M.E. Pope, C.A. Miller, N.L. Anderson, and T.W. Pearson, J. Proteome Res. 11, 5642–5649 (2012).
(7) S.E. Hutchinson, M.V. Leveridge, M.L. Heathcote, P. Francis, L. Williams, M. Gee, J. Munoz-Muriedas, B. Leavens, A. Shillings, E. Jones, P. Homes, S. Baddeley, C.W. Chung, A. Bridges, and A. Argyrou, J. Biomol. Screen. 17, 39–48 (2012).
(8) J.J.A. van Kampen, P.C. Burgers, R. de Groot, R.A. Gruters, and T.M. Luider, Mass Spectrom. Rev. 30, 101–120 (2011).
(9) M.B. O'Rourke, S.P. Djordjevic, and M.P. Padula, Mass Spectrom. Rev. 37, 217–228 (2018).
(10) I. Sinclair, R. Stearns, S. Pringle, J. Wingfield, S. Datwani, E. Hall, L. Ghislain, L. Majlof, and M. Bachman, J. Lab. Autom. 21, 19–26 (2016).
(11) H. Zhang, Bioanalysis 9, 1619–1621 (2017).
(12) G.J. Van Berkel, V. Kertesz, Rapid Commun Mass Spectrom. 29, 1749–1756 (2015).
(13) C.L. Ghislain, D. Arnold, and S.Datwani, SLAS (2018) DOI:10.13140/RG.2.2.32287.46248
(14) C.M. Alfaro, A.O. Uwakweh, D.A. Todd, B.M. Ehrmann, and N.B. Cech, Anal. Chem. 86, 10639–10645 (2014).
(15) K.Q. Tang, J.S. Page, and R.D. Smith, J. Am. Soc. Mass Spectr. 15, 1416–1423 (2004).
(16) E.K. Sackmann, L. Majlof, A. Hahn-Windgassen, B. Eaton, T. Bandzava, J. Daulton, A. Vandenbroucke, M. Mock, R.G. Stearns, S. Hinkson, and S.S. Datwani, J. Lab. Autom. 21, 166–177 (2016).
Jessica Lin is a Research Scientist at Genentech in Small Molecule Analytical Chemistry. Colin Masui is a Senior System Specialist in automation at Genentech in Small Molecule Analytical Chemistry. Raymond Lieu is a Research Associate at Genentech (through PRO unlimited) in Small Molecule Analytical Chemistry. Kelly Zhang is a Research Principal Scientist at Genentech in Small Molecule Analytical Chemistry. Direct correspondence to: zhang.kelly@gene.com
New Study Reviews Chromatography Methods for Flavonoid Analysis
April 21st 2025Flavonoids are widely used metabolites that carry out various functions in different industries, such as food and cosmetics. Detecting, separating, and quantifying them in fruit species can be a complicated process.
Quantifying Terpenes in Hydrodistilled Cannabis sativa Essential Oil with GC-MS
April 21st 2025A recent study conducted at the University of Georgia, (Athens, Georgia) presented a validated method for quantifying 18 terpenes in Cannabis sativa essential oil, extracted via hydrodistillation. The method, utilizing gas chromatography–mass spectrometry (GC–MS) with selected ion monitoring (SIM), includes using internal standards (n-tridecane and octadecane) for accurate analysis, with key validation parameters—such as specificity, accuracy, precision, and detection limits—thoroughly assessed. LCGC International spoke to Noelle Joy of the University of Georgia, corresponding author of this paper discussing the method, about its creation and benefits it offers the analytical community.

