Laser Thermal Desorption and GC×GC for Harsh Environment and Planetary Mass Spectrometry
Special Issues
The development of analytical instrumentation for harsh terrestrial environments and outer planet space exploration exponentially increases instrument requirements-for features such as robustness, autonomous operation, and speed-and poses unique system integration challenges. Here, we explore the use of laser thermal desorption coupled to comprehensive two-dimensional gas chromatography (LTD-GC×GC) for use with a compact, high-resolution mass spectrometer for challenging applications.
Detection and identification of organic compounds in-situ requires robust analytical equipment, in some cases autonomous operation, and the always present "lighter, cheaper, and faster" mantra. Development of analytical instrumentation for terrestrial harsh environments and outer planet space exploration exponentially increases these requirements, and poses unique system integration challenges. It is believed that ice bodies such as Enceladus and Europa harbor vast quantities of sub-surface water, and may be the best opportunity to find evidence of extant extraterrestrial life. The unique geochemistry, complex chemistry, and activity on these icy bodies could provide a suitable environment for habitable conditions. Here, we explore the use of laser thermal desorption coupled to comprehensive two-dimensional gas chromatography (LTD-GC×GC) for use with a compact, high-resolution mass spectrometer. Laboratory studies on various environmental samples have shown instrument feasibility and operational metrics necessary for future space flight missions. LTD-GC×GC chromatograms, mass spectrometry data, and system integration metrics are discussed, and relevant data presented.
Comprehensive two-dimensional gas chromatography (GC×GC) has become a powerful analytical separation technique since its inception in 1991 by Professor John Phillips at the University of Southern Illinois (1). The use of GC×GC has been well documented and published, with applications covering environmental, food and flavors, metabolomics, and life sciences analysis (2). The benefits of GC×GC have also been noted, especially for complex samples and trace-level detection in heavy matrices (3). These attributes make GC×GC a likely candidate for future space science instruments requiring GC separations to search for evidence of extant extraterrestrial life on distant moons (4).
Lasers have been employed in analytical experiments for methods of ionization such as laser desorption ionization (LDI), matrix-assisted laser desorption–ionization (MALDI), laser ablation, and laser-assisted desorption electrospray ionization (LA-DESI), as well as in post-ionization activation and dissociation. Lasers are also used for spectroscopy methods, such as laser induced fluorescence and laser-induced breakdown spectroscopy (LIBS). Laser-induced thermal desorption, used in this study, has been utilized to look at desorbed gases from surfaces and material science studies. In this work, we utilize laser thermal desorption for the analysis of volatiles and semi-volatiles from surfaces of solid materials to simulate future landed instruments on outer planets.
Volatile organic compound analysis in ambient air and other environmental samples is of interest because of its application to environmental, industrial, indoor air analysis, and medical samples (5–8). Due to the nature of low concentration volatile organic compounds (VOCs) in their respective sample matrix, preconcentration is often required. Common methods of preconcentration are solid-phase microextraction (SPME) (9–11), solvent desorption (12,13), and offline air samplers (14–16) (canisters or sorbent traps).
Sample canisters have proved to be an effective tool in environmental sampling, as they are portable, rugged, and easy to use. Atmospheric measurements can be made by simply opening and closing the valve (grab sampling), or by metered restriction, allowing a slower, constricting fill of the canister (17). A few previous examples, but by no means an exhaustive list, of environmental measurements with canisters is chlorinated hydrocarbon (CHCs) and monocyclic aromatic hydrocarbons (MAHs) in remote continental and marine atmospheres (18–22). Care must be taken to clean the inner walls of the canister between every sample (23,24), and humidity of the sampled air must be taken into consideration (25,26). VOCs stored in dry air matrices have been shown to decrease concentration, due to increased inner wall adsorption where the main competitor for the inner walls is water vapor.
Sorbent traps have also had a great impact on environmental sampling, owing to their ability to preconcentrate a sample. Much work has been done in studying sorbent traps in terms of analyte breakthrough (27–28), production of artifacts, which are chemical reactions with sorbent materials during sampling, and thermal desorption or degradation of certain analytes (29–31), contamination prevention, and water retention prevention (32–33). Depending on the type of analytes being investigated, different sorbent materials, or combinations of sorbent materials, are utilized. The major advantage to using multistage (multiple sorbent materials)or multibed traps is that a wide range of compounds can be sampled, without breakthrough losses.
For our study, we combined the advantages of laser thermal desorption, canister sampling of volatiles, a multi-bed sorption trap, and, finally, comprehensive GC×GC for the separation and analysis of organic materials.
Experimental
Sampling of Solids by Laser Thermal Desorption
A detailed schematic of the environmental sampling, sample preconcentration, and analysis is represented in Figure 1. First, a sample is placed beneath the focusing optics of the laser beam for laser thermal desorption. The laser employed for the laser thermal desorption of organics and other media is a 445 nm, 1.5 mW, S3 Arctic Series diode laser (Wicked Lasers). The laser is operated in its high power mode, and the beam is reflected at a 90° angle through a right angle prism to a 100 mm focal length lens (ThorLabs, Inc.). The focused laser beam is then projected onto the sample. Heating provided by the laser beam was tested with a K-type thermocouple (Omega Engineering, Inc.) attached to a stainless steel surface with the laser beam projected onto the thermocouple junction. The temperature was displayed with a digital temperature panel meter, and was registered at 270 °C with the lens employed.
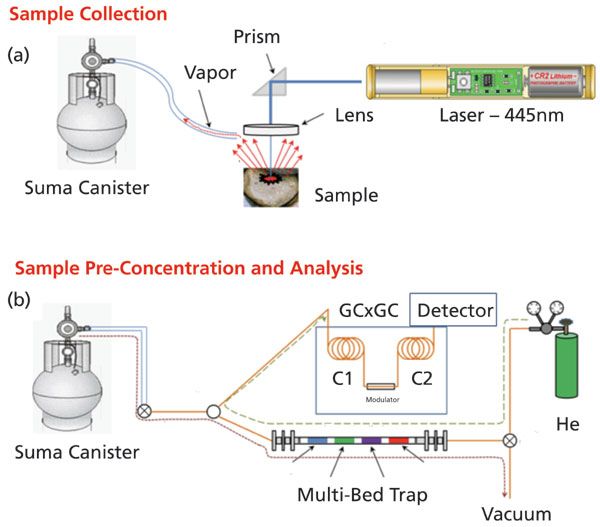
Figure 1: (a) Sample collection via laser thermal desorption, and (b) sample preconcentration of the vapor and analysis. Thermally desorbed organics are captured in a canister, and then drawn across a multibed trap for preconcentration. The trap is then heated, and desorbed compounds are analyzed by GC×GC.
The thermally desorbed constituents are sampled into an evacuated 1-L TO-Can (Restek Corporation), with a flexible hose positioned just above the sample. Once the can has reached atmospheric pressure, determined by the absence of the sound of gas flowing into the can, the manual valve on the can is closed. This simple process concludes the sampling of thermally desorbed components from solid materials.
Sample Preconcentration
Gaseous vapors collected in the TO-Can are preconcentrated onto a multibed-sorption trap. The multibed-sorption trap employed has been described previously (34–36). Briefly, the trap body is Inconel 600 tubing of 8 cm length, with an outer diameter 0.0625", and a wall thickness of 0.005" (All-Tube-Micro-Group). Four separate beds of sorbent material are packed within the trap, with each bed separated by a plug of glass wool. The four separate beds are composed of the following sorbent materials: Carbopack Y, Carbopack B, Carbopack X, and Carboxen 1000. All of the sorbent materials were purchased from Supelco (Supelco-Sigma Aldrich; St. Louis, Missouri), and each bed consisted of approximately 2.2 mg of material. The adsorption strength of the beds is Carbopack Y to Carboxen 1000 (weakest to strongest). Flow during sample preconcentration is from left to right, shown as the red dotted line in Figure 1. As such, the least volatile components (highest boiling point) are adsorbed on the first bed, Carbopack Y, while the highest volatility components are adsorbed on the last bed, Carboxen 1000. When the trap is heated, the adsorbed components are released from the beds as a narrow plug to the GC×GC for the two-dimensional separation.
Samples are loaded onto the trap by opening the sampling inlet valve, valve 1, and switching valve 2 to open the pathway to the diaphragm vacuum pump with a 12 V DC pulse through the solid state relay. The valve to the TO-Can is also opened, and the diaphragm vacuum pump pulls gas from the sampling canister through the apparatus at a rate controlled by the flowmeter (Omega Engineering, Inc.). Sample pre-concentration flow is shown in Figure 1 as a red dotted line. Gas sampling is done for 50 s, at which time valve 1 is closed and valve 2 is switched to allow helium carrier gas to flow through the trap and into the GC×GC instrument by the falling edge of the 12 V DC pulse. The helium carrier gas flow through the trap and through the dual columns of the GC×GC instrument is allowed to equilibrate for 300 s. The helium carrier gas flow through the multibed sorption trap and to the GC×GC is shown as the olive green dotted line in Figure 1.
Sample Analysis
The trap is resistively heated by heating pulse 1 with an Agilent E3343 power supply (operated in the 0-7V, 20 A range) with a 3.8 V DC amplitude pulse for duration of 2.5 s. This heating pulse rapidly increases the temperature of the trap to 300 °C for desorption of components adsorbed onto the multibed trap. Simultaneously with heating pulse 1, the GC×GC analysis and subsequent data acquisition is started. A second heating pulse is applied to the trap after a 0.2 s delay from the falling edge of heating pulse 1, and is applied for 15 s. The 1.4 V DC heating pulse is applied to maintain the temperature of the trap around 300 °C to ensure complete desorption of adsorbed components from the trap. All components desorbed from the trap enter into the first dimension GC×GC column, and undergo the two-dimensional comprehensive separation under the following experimental conditions: oven 1 starting at 40 °C and held for 30 s, followed by a 3 °C/min temperature ramp to 240 °C, with the final temperature held for 30 s; oven 2 with a similar heating profile, but 50 °C initial temperature and 250 °C final temperature, modulator temperature always being 10 °C greater than the secondary oven temperature, inlet temperature of 200 °C, and FID temperature of 250 °C. The entire GC×GC run takes place in 4060 s (slightly longer than 1 h). The helium carrier gas flow rate was measured at 1.5 mL/min, at a column temperature of 40 °C.
Laser thermal desorption was performed on a kernel of popcorn, a geological sample (sedimentary rock), and a similar geological sample soaked in an oil and gasoline mixture. Results of the components detected in each sample are given in the Results and Discussion section. Comparative observations between the three samples, especially between the rock and the rock soaked in oil and gasoline, and conjectures as to chemical families of specific groupings of chromatographic signals, can be inferred, but high confidence identification of each component requires mass spectrometry detection.
Results and Discussion
Laser thermal desorption results from the two rock samples, blank rock, and oil-and-gasoline soaked rock, are illustrated in the side-by-side comparison of the two-dimensional chromatograms in Figure 2. In the figure, the rock sample blank is shown at left, and the oil-and-gas soaked rock sample is shown at right. For further comparative illustration, the modulated chromatographic signal for both samples are overlaid onto a single first-dimension retention time axis. Some of the background signals seen in the rock sample blank can also be seen in the oil-and-gas soaked rock sample. Utilizing ChromaTOF software (LECO Corp.), a chromatographic comparison was done for the two results with the rock sample blank serving as the reference chromatogram. For the comparison the following filters were used: 1st dimension retention deviation of 4 s, second-dimension retention deviation of 0.2 s, and an S/N threshold of 500. A match between chromatographic signals in the two chromatograms can occur if the peak centroid of a peak in the oil-and-gas soaked rock sample is within 4 s of first dimension retention and 0.2 s of second dimension retention of a peak in the rock sample blank, and also that both signals have a S/N ratio of greater than 500. The comparison revealed that over the entire two-dimensional chromatograms, there were approximately 27 matching chromatographic signals. This number would be expected to increase if a lower S/N threshold level were used. When narrowing the window of comparison to a region of 500 to 2000 s in the first dimension and 1 to 3 s in the second dimension, there were 17 matches. It is apparent there are some similarities between the chromatograms; however, the major difference in the two samples is in the region of 800 to 1500 s in the first dimension retention and 1 to 2 s in second-dimension retention.
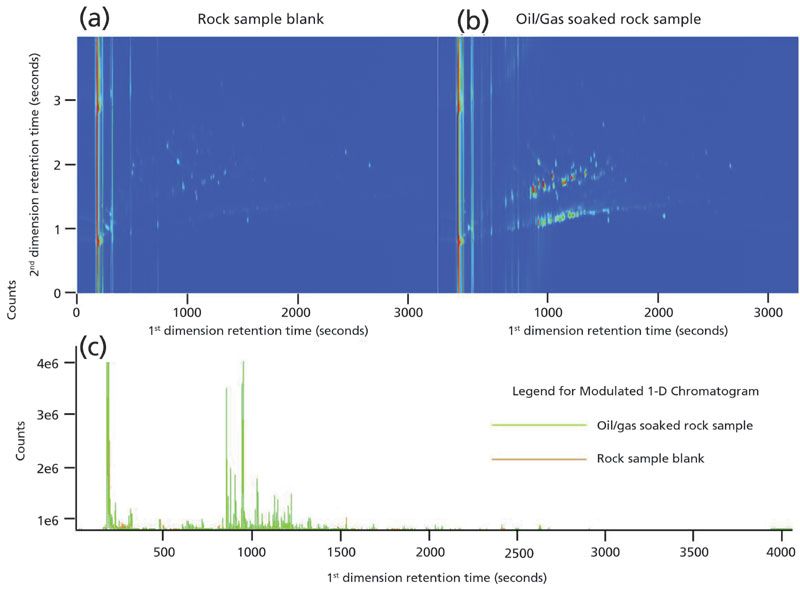
Figure 2: Two-dimensional chromatograms (contour plots) of the rock samples analyzed. Chromatogram (a) is of the sedimentary rock, and (b) is a chromatogram of the oil-and-gas soaked rock. Figure (c) shows the overlaid modulated signal chromatogram along the first dimension retention time axes, to further illustrate the differences in the samples. Note: (b) the oil-and-gas soaked rock shows increased signal representative of the hydrocarbon matrix.
This region (800 to 1500 s) reveals the lower volatility components from the oil and gas mixture in which the rock was soaked, and represents the region of most apparent deviation from the rock sample blank. There are only four matches of chromatographic signals between the two data sets in this region, but 123 unique signals from the oil-and-gas soaked rock sample compared with the rock sample blank. There are a few chromatographic signals in the 600 to 800 s range in the first dimension and the 1 to 1.5 s range in the second dimension that could represent some of the higher volatility components but the highest volatility components are not retained on the rock surface before sample analysis. The rock was brought into the laboratory and laser thermal desorption of the rock surface was done within 12 h of rock removal from the oil and gas mixture. In this amount of time, most of the high volatility components would already be lost from the rock surface prior to analysis.
The lower volatility components from the oil-and-gas mixture can be viewed according to their different trend lines, or groupings, within the two-dimensional plots, to make inferences about their respective chemical structures (Figure 3). The first trend line, around 1 s in the second-dimension retention plane, can be attributed to aliphatics, namely linear and branched alkanes. The majority of the signals are in the 800 to 1500 s first-dimension retention range, but some chromatographic signals from this chemical family can be seen out to about 2500 s. The second trend line can be attributed to substituted aromatics, slightly more polar than the linear and branched alkanes. Slight trends above the second trend line could indicate the number of aromatic rings within a structure, although for high confidence identification of components, mass spectrometry detection would be required.
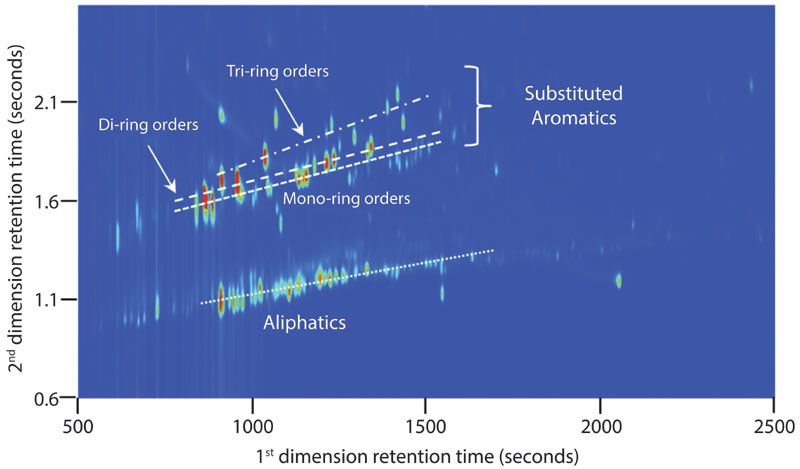
Figure 3: Chemical groupings according to chemical families, depicted by the overlaid trend lines in the chromatographic signals from the oil-and-gas soaked rock sample. GC×GC has the ability to separate chemical families across the retention planes, resulting in very structured and highly resolved peaks.
The oil-and-gas soaked rock sample was also analyzed via a multibed sorption trap ran through a capillary leak line into an in-house built time-of-flight mass spectrometry (TOF-MS) system. The MS system is a prototype design as part of the MASPEX instrument for the Europa Clipper mission (37). The sample was preconcentrated onto a multibed sorption trap (much like in the GC×GC) analysis, and then desorbed off the trap and sent through a 4-m length 50 µm inner diameter fused silica capillary that terminated in the electron impact ion source region of the instrument. A carrier gas of helium (5 psig) was used to help push the sample off the trap, and through the restrictive capillary into the source region of the instrument. The TOF-MS was run in linear mode, and the data were recorded by Fastflight in the C/TOF-MS (chromatogram/time-of-flight mass spectrometry) mode, where the total ion chromatogram is recorded at each mass spectrum write-to-disk. The mass spectrum displayed in Figure 4 is the mass spectrum, correlated with the apex, or peak maximum, of the chromatographic signal.
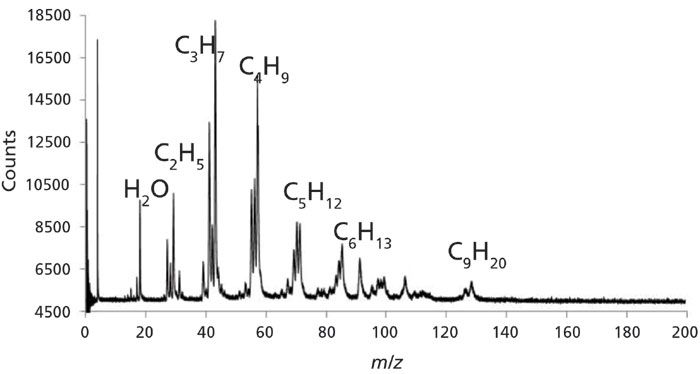
Figure 4: Mass spectrum of the oil-and-gas soaked rock detected by laser thermal desorption and on a time-of-flight mass spectrometer (TOF-MS) operated in linear mode.
Results from the mass spectrum reveal many ion signals at m/z values usually seen for alkanes from ethane up to nonane, and other hydrocarbon signals mixed in with these common m/z values. From m/z 13 to m/z 30, there are ion signals at nearly all integer m/z channels, supporting the data in Figures 2 and 3 that the sample is quite complex.
The third sample utilized in the laser thermal desorption process was a kernel of popcorn. The popcorn kernel was placed beneath the same focal lens, and the laser was turned on to heat the sample and collect the vapors in the Suma canister. In the case of the popcorn kernel, the 270° C laser spot started to burn the sample, and visible vapor (smoke) was seen and collected in the Suma canister. The Suma canister was hooked up to the sample inlet of the multibed sorption trap, and sampled in the same manner as the vapor from the oil-and-gasoline soaked rock sample. The result obtained from the GC×GC-FID analysis is displayed in the two-dimensional chromatogram (contour plot) in Figure 5.
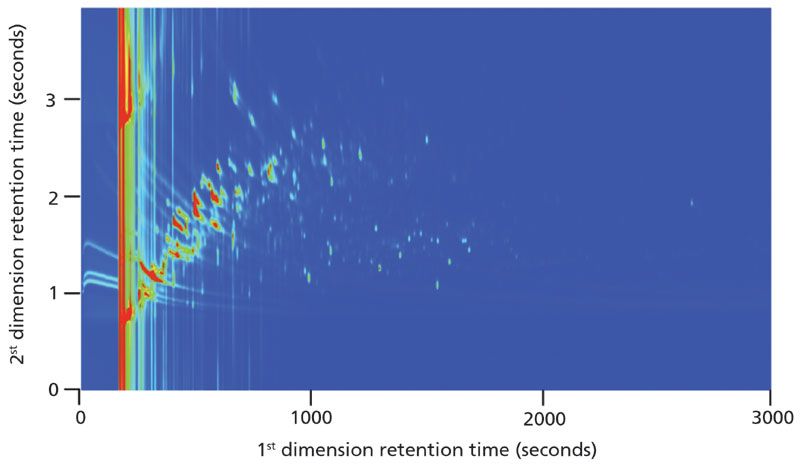
Figure 5: Two-dimensional chromatogram of kernel popcorn vapor sample. The z-axis of the contour plot is auto color scaled based on peak height (blue is baseline and red is most abundant). More than 300 features were detected in this sample.
Unlike the oil-and-gasoline soaked rock sample, most of the chromatographic signals from the kernel popcorn vapor sample have a retention time less than 1000 s in the first dimension. This would imply that the majority of the signals have a lower boiling point (usually corresponding to lower molecular weight) than those chromatographic signals in the oil-and-gasoline soaked rock sample (Figures 2 and 3). Furthermore, the chromatographic signals seen in this early retention time region (<1000 s) are very intense from the red color in the contour plot. This region of intense signal is absent in the oil-and-gas soaked rock samples, showing a significant difference between the two samples. To further amplify the complexity of the sample in this first 1000 s of retention in the first dimension, a three-dimensional plot of the sample is displayed in Figure 6. The sample complexity is very obvious, as the lower intensity signals, having only a slightly different contrast from the background color in the contour plot, really come to life in the three dimensional view. Overall, in the region shown from 500 to 3000 s in the first dimension and 1 to 4 s in the second dimension there are over 300 chromatographic signals above a S/N threshold of 500.
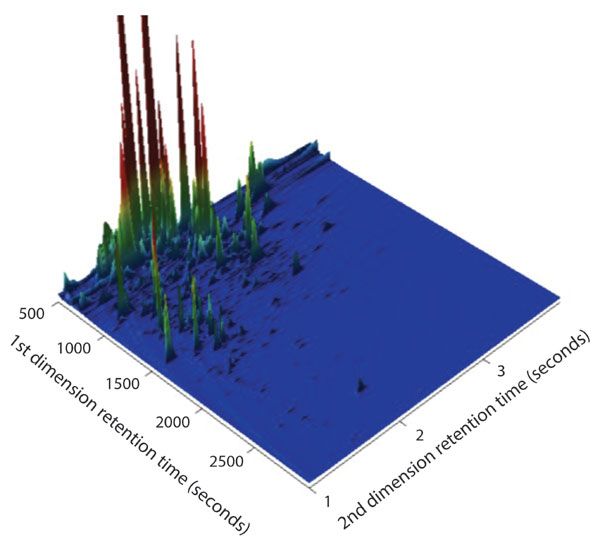
Figure 6: Three-dimensional view of the kernel corn vapor sample showing the chromatographic complexity and the complexity of detected organic compounds. The z-axis is autoscaled to the largest peaks.
Vapors from the kernel popcorn sample were also loaded on the multi-bed sorption trap and desorbed to the linear TOF MS instrument, and the resulting mass spectrum is displayed in Figure 7. The majority of ion signals in the mass spectrum correspond to hydrocarbon signals (alkanes, and so forth) from the corresponding m/z values. Ion signals are seen all the way out to m/z 128. One can see from observing this mass spectrum compared with the oil-and-gasoline soaked rock sample that the mass spectra are quite different both in terms of ion signals at different m/z values and ion signal abundance. One difference of note is the base peak at m/z 44, possibly corresponding to CO2. Another difference is the abundance of each of the m/z ion clusters and the peaks associated within the cluster such as at, for example, m/z 13–19, 25–30, and 39–45. The difference in overall counts (higher counts or abundance) between the two spectra is most likely due to a slightly increased flow rate of helium, perhaps slightly different potentials applied to the optical components, or slight differences in voltage on the MCP thus leading to slightly different gain on the MCP.
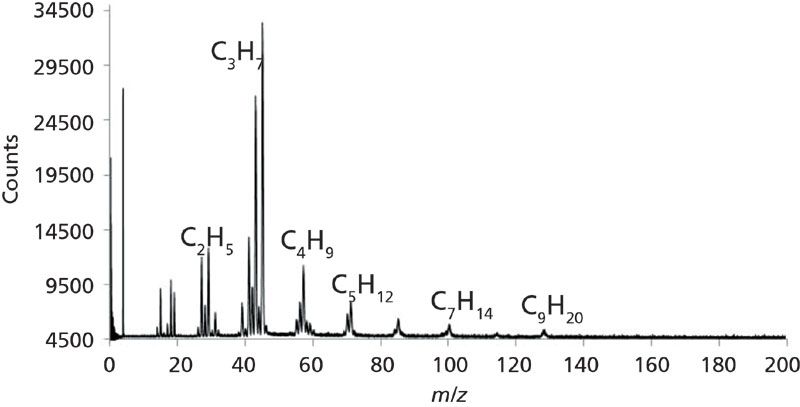
Figure 7: Mass spectrum of the kernel popcorn vapor sample acquired by laser thermal desorption-mass spectrometry (LTD-MS). The signature hydrocarbon pattern is similar to the oil-and-gas soaked rock, but the intensities are different.
The validity of the laser thermal desorption multibed sorption trap LTD-GC×GC method is shown through the results of these samples. It is especially apparent in the >200 chromatographic signals attributed to organics desorbed from the oil-and-gas soaked rock compared to the rock sample blank. However, at present, the system described here only provides signal intensity as a function of first- and second-dimension retention time. Thus, for component identification, analytical standards would need to be run, and retention index matching would be required for accurate identification. However, the present method of LTD-GC×GC coupled with mass spectrometry detection is well suited for autonomous operation and detection of organic compounds where high-resolution and sensitivity are required.
Conclusion
In this work, we have demonstrated a laser thermal desorption sampling method coupled with sample preconcentration utilizing a multibed sorption trap and subsequent analysis by comprehensive two-dimensional gas chromatography, collectively LTD-GC×GC. Successful operation of the instrument was shown for both a comparison of a rock taken out of a natural environment versus a similar rock from the same environment soaked in a gasoline and oil mixture, and a sample of kernel popcorn. Currently, our group is working on mating the LTD-GC×GC with the TOF-MS system and we hope to share those results shortly.
The authors would like to thank Greg Miller and Ed Patrick for laboratory assistance and technical discussions. Financial support for this study was provided by Southwest Research Institute (SwRI) internal funding; project R8223 and R8412.
References
(1) Z. Lui and J. Phillips, J. Chromatogr. Sci. 29(6), 227–231 (1991).
(2) H. Cortes, W.L. Winniford, J. Luong, and M. Pursch, J. Sep. Sci. 32(5–6), 883–904 (2009).
(3) M.S. Klee, J. Cochran, M. Merrick, and L. Blumberg, J. Chromatogr. A 1383 151–159 (2015).
(4) J.H. Waite, Science, 311, 1419–1422 (2006).
(5) A. Manolis, Clin. Chem. 29, 5 (1983).
(6) T. Pliel and A. Lindstrom, Clin. Chem. 47, 723 (1997).
(7) R. Edwards, J. Jurvelin, K. Koistinen, K. Saarela, and M. Jantunen, Atmos. Environ. 35, 4829 (2001).
(8) J. Dewulf and H. Van Langenhove, J. Chromatogr. A 843, 163 (1999).
(9) M.E. Cablk, E.E. Szelagowsk, and J.C. Sagebiel, Forensic Sci. Int. 217, 32–38 (2012).
(10) E.M. Hoffman, A.M. Curran, N. Dulgerian, R.A. Stockham, and B.A. Edkenrode, Forensic Sci. Int. 186, 6–13 (2009).
(11) C.E. DeGreeff and K.G. Furton, Anal. Bioanal. Chem. 401, 1295–1307 (2011).
(12) C. Brasseur, J. Dekeirsschieter, E. Schotsmans, S. de Koning, A.S. Wilson, E. Haubruge, and J.F. Focant, J. Chromatogr. A, 1255, 163–170 (2012).
(13) J. Dekeirsschieter, F.J. Verheggen, M. Gohy, F. Hubrecht, L. Bourguignon, G. Lognay, and E. Haubruge, Forensic Sci. Int. 189, 46–53 (2009).
(14) J. Dewulf and H. Van Langenhove, Atmos. Environ. 31, 3291 (1997).
(15) C. Peng and S. J. Batterman, Environ. Monit. 2, 13 (2000).
(16) M. Van Winkle and D. Scheef, Indoor Air 11, 49 (2011).
(17) J. Rudolph, C. Jebsen, A. Khedim, and F. J. Johnen, Comm. Eur. Comm., Proceedings of the 13th European Symposium, Dordrecht: Reidel Publishing Company, 1984.
(18) D.R. Cronn and W. Nutmagul, Tellus 34 159–165 (1982).
(19) H.B. Singh, L.J. Salas, and R.E. Stiles, J. Geophys. Res. 88, 3675–3683 (1983).
(20) J.P. Greenberg and P.R. Zimmerman, J. Geophys. Res. 89, 4767–4778 (1984).
(21) S.A. Penkett, N.J. Blake, P. Lightman, A.R. Marsh, P. Anwyl, and G. Butcher, J. Geophys. Res. 98, 2865–2885 (1993).
(22) D.R. Blake, N.J. Blake, T.W. Smith Jr., O.W. Wingenter, and F.S. Rowland, J. Geophys. Res. 101, 4501–4514 (1996).
(23) R. W. Coutant, "Theoretical Evaluation of stability of Volatile Organic Chemicals and Polar Volatile Organic Chemicals in Canisters," EPA/600/R-92/055. U.S. Environmental Protection Agency, Research Triangle Park, North Carolina (1992).
(24) "EPA Compendium Method TO-14. The Determination of Volatile Organic Compounds (VOCs) in Ambient Air Using Suma Passivated Canister Sampling and Gas Chromatographic Analysis," Quality Assurance Division Environmental Monitoring Systems Laboratory, U.S. Environmental Protection Agency, Research Triangle Park, North Carolina (1988).
(25) A.R. Gholson, R.K.M. Jayanty and J.F. Storm, Anal. Chem. 62, 1899–1902 (1990).
(26) J.P. Hsu, G. Miller, and V. Moran, J. Chrom. Sci. 29, 83–88 (1991).
(27) D. Helmig and J.P. Greenberg, J. Chromatog. 677, 123–132 (1994).
(28) M.P. Baya and P.A. Siskos, Analyst 121, 303–307 (1996).
(29) D. Helmig, J. Chromatog. 732, 414–417 (1996).
(30) J.F. Walling, J.E. Bumgarner, D.J. Driscoll, C.M. Morris, A.E. Riley, and L.H. Wright, Atmos. Environ. 20, 51–57 (1986).
(31) X.-L. Cao and C.N. Hewitt, J. Chromatog. 688, 368–374 (1994).
(32) C.A. McCaffrey, J. MacLachlan, and B.I. Brookes, Analyst 119, 897–902 (1994)
(33) D. Helmig and L. Vierling, Anal. Chem. 67, 4380–4386 (1995).
(34) J.M. Sanchez and R.D. Sacks, Anal. Chem. 75, 978–985 (2003).
(35) J.M. Sanchez and R.D. Sacks, Anal. Chem. 75, 2231–2236 (2003).
(36) M. Libardoni, J.H. Waite, and R. Sacks, J. Chromatogr. B 842, 13–21 (2006).
(37) T. Brockwell, "The Mass Spectrometer for Planetary Exploration (MASPEX)," IEEE (2016).
Mark Libardoni and Ryan Blase are planetary scientists with backgrounds in analytical chemistry at the Southwest Research Institute, in San Antonio, Texas. Direct correspondence to: mlibardoni@swri.edu
Detecting Hyper-Fast Chromatographic Peaks Using Ion Mobility Spectrometry
May 6th 2025Ion mobility spectrometers can detect trace compounds quickly, though they can face various issues with detecting certain peaks. University of Hannover scientists created a new system for resolving hyper-fast gas chromatography (GC) peaks.
University of Oklahoma and UC Davis Researchers Probe Lipidomic Profiles with RP-LC–HRMS/MS
May 6th 2025A joint study between the University of Oklahoma Health Sciences Center (Oklahoma City, Oklahoma) and the UC Davis West Coast Metabolomics Center (Davis, California) identified differentially regulated lipids in type 2 diabetes (T2D) and obesity through the application of reversed-phase liquid chromatography-accurate mass tandem mass spectrometry (RP-LC-accurate MS/MS).
Automated Sample Preparation (ISO 20122) for MOSH/MOAH in Seasoning Oils
May 6th 2025This work presents an Automated Sample Preparation procedure for MOSH/MOAH analysis of Seasoning Oils. We compare results from a manual epoxidation procedure compliant with DIN 16995 with results based on fully automated sample preparation (epoxidation and saponification) compliant with ISO 20122. In both cases, online clean-up via activated aluminum oxide (AlOx) are used to remove interfering n-alkanes from the MOSH fraction during the HPLC run. Automated data evaluation using a dedicated software (GERSTEL ChroMOH) is presented.

.png&w=3840&q=75)

.png&w=3840&q=75)


.png&w=3840&q=75)


.png&w=3840&q=75)
