High-Speed Chromatography Results — A New Solution for Working with UHPLC Data
Special Issues
This article describes a new workflow technology in a chromatography data system (CDS) software program. Using this workflow streamlines workflows in chromatography laboratories, enabling users to set-up sequences, process data, and report results in the shortest possible time. This typically speeds up the generation of results, thus, more than matching typical throughput increases found when using UHPLC technology.
As ultrahigh-pressure liquid chromatography (UHPLC) becomes more popular, the time taken to set-up and process analytical runs has increased significantly because of the higher sample throughput rates. This increase can be as much as a factor of 5 or higher. Reducing processing times has become a key goal for chromatography data system (CDS) software. This article presents a solution using a new workflow technology. The solution streamlines workflows in any chromatography laboratory and significantly reduces the time taken between receiving a sample for analysis and delivering the result.
Chromatography Workflows
All chromatography workflows are similar: injection of samples, chromatographic separation, capture of data, and generation of results. The difference lies in details such as instrument conditions, injection sequence requirements, data evaluation process, and techniques for result calculation. Setting up these details can be time-consuming and error-prone. For example, a chromatographic analysis in a regulated laboratory requires a user to set up a sequence with a set number of system suitability injections, calibration standards, and check standards. In addition, it is often required to perform two or three injections of each sample for analysis, and repeat bracketing standards at regular intervals. After data acquisition, a user must process data per the standard operating procedure (SOP) before calculating the results. An error in any step invalidates the result, and can require that all the samples be run again.
The fact that chromatography workflows all share these typical steps, but with differing details, allows for the use of a more automated approach using software tools.
An Introduction to eWorkflows
In the Chromeleon 7 CDS software (Dionex, Sunnyvale, California), such software tools are called eWorkflows.
An eWorkflow is a set of rules capturing typical aspects of a chromatography workflow so that users only provide a minimum amount of information when starting a chromatographic experiment. Using the eWorkflows feature, the user selects an instrument, enters the number of samples for analysis, sets the starting vial position, and clicks go.
The eWorkflow automatically builds the following elements for a chromatography sequence:
- Available and suitable instruments
- Sequence name and storage location
- Injection list following the rules of the workflow
- Injection settings (injection volume, injection type, calibration levels, dilution factors, and so forth)
- Custom variables for the workflow
- Associated objects for the sequence (instrument and processing methods, reports)
- Attachments for reference (for example, PDF documents)
- Data fields necessary for the workflow
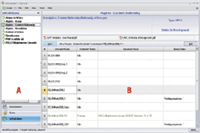
Figure 1: eWorkflows Category showing all available eWorkflows.
This automated process significantly reduces the number of steps required to create a sequence of injections. In addition, the selected instrument method includes the settings for running the analysis, the processing method contains the peak detection and calibration settings, and the report calculates all results. This further reduces the steps and time to get to the final result. Lastly, the review time is shortened significantly because of the automation; the user needs to focus only on those areas that can be modified.
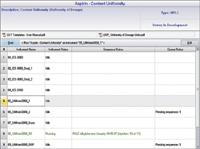
Figure 2: Select an instrument to run the eWorkflow.
Running an eWorkflow
The eWorkflows Category (Figure 1) page provides a navigation pane listing the eWorkflows available to the user (A). When the user selects an eWorkflow, the Work Area (B) lists available instruments (and their current status in the network) suitable to run the eWorkflow. Any attachments (for example, method SOP) also are accessible. In this example, we look at running an eWorkflow for the USP test for the content uniformity of aspirin.
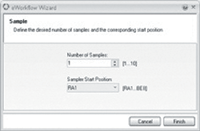
Figure 3: Enter the number of samples to analyze.
After selecting a suitable instrument, the user is now a few mouse clicks from starting and completing a run. The eWorkflow wizard is started by clicking the Start button (Figure 2). The user enters the number of samples to analyze and their starting position in the autosampler (Figure 3). The sequence is automatically created based upon the layout defined in the eWorkflow and is ready to start (Figure 4). The sequence includes the processing method, detection parameters and peak table, and report template. At the end of the sequence, the result is calculated and displayed immediately (Figure 5).
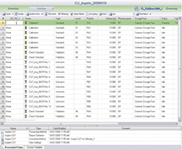
Figure 4: Run the sequence.
The eWorkflow processes are defined and managed using the eWorkflow editor, described in the following section.
The eWorkflow Editor
The eWorkflow Editor is used to define and manage eWorkflow processes. This editor consists of these three parts:
- eWorkflow General
- Sequence General
- Sequence Layout
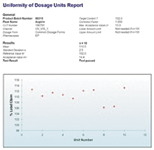
Figure 5: Report the final results.
eWorkflow General
The General Settings page (Figure 6) is where a user specifies the settings related to an eWorkflow: instruments, methods, and documents. Methods and documents can be added to the eWorkflow or included as a link. Linking is more efficient because multiple eWorkflows can link to the same file, and updating a file does not require uploading the file again to the eWorkflow.
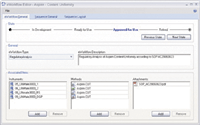
Figure 6: General eWorkflow settings.
Sequence General: The sequence name and location are set in the Sequence General page (Figure 7). Using report formulas in the sequence name and sequence location ensures data is stored in the correct location. For example, when using report formulas, the sequence location can be structured according to the instrument name, user name, and so on.
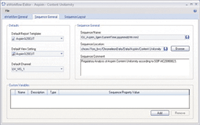
Figure 7: General Sequence settings.
Sequence Layout: An important part of the eWorkflow Editor is the Sequence Layout page (Figure 8), where the sequence layout rules are defined. The upper area (A) is used to restrict the number of samples and brackets in the sequence. The Sequence Header (B) defines injections that appear at the start of the sequence.
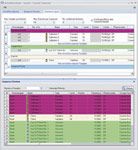
Figure 8: Sequence Layout settings.
The Sample Block (C) lists the injections to be performed for each physical sample. The Bracket (D) defines injections for each bracket. The Sequence Footer (E) defines injections to be performed at the sequence end, for example a shutdown method. Finally, the Sequence Preview (F) shows a sequence that will be created according to the set rules.
Any combination of the Sequence Layout components can be used, allowing maximum flexibility. For example, if the method does not require bracketing standards, then this area can be left blank. This flexibility permits creating eWorkflows for any type of chromatography laboratory — quality control or research and development — independent of the industry. The eWorkflow solution also allows the definition of any type of analysis, regulated, quality control, method development, and open access.
Typical Savings when Using eWorkflows
By reducing a chromatographic analysis to a few steps, the eWorkflow allows results to be generated much faster than with any normal CDS. Table I shows data for an analysis in a regulated laboratory and compares processing time using a traditional CDS and using eWorkflows.
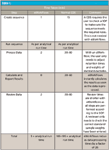
Table I.
Summary
The eWorkflow solution streamlines workflows in chromatography laboratories by quickly and easily setting up workflow rules that users can follow to set up and start an analysis in significantly less time than traditionally required. Using eWorkflows also ensures that all steps are followed correctly, reduces the need for additional verification, and saves additional laboratory time. The eWorkflows solution typically allows speed-up of the generation of results by a factor of 20 or more, thus, more than matching typical throughput increases found when using UHPLC technology.
Fraser McLeod and Barbara Van Cann
Dionex Corporation, Germering, Germany
Please direct correspondence to fraser.mcleod@dionex.com
Regulatory Deadlines and Supply Chain Challenges Take Center Stage in Nitrosamine Discussion
April 10th 2025During an LCGC International peer exchange, Aloka Srinivasan, Mayank Bhanti, and Amber Burch discussed the regulatory deadlines and supply chain challenges that come with nitrosamine analysis.


