High-Resolution Mass Spectrometry: An Ideal Premier Analytical Tool for Drug Metabolism Studies
In this instalment, a way of utilizing HR-MS systems to characterize the structures of metabolites is introduced. This results in a general workflow for metabolism studies for drug discovery and development.
In this instalment, we introduce a way of using high-resolution mass spectrometry (HR-MS) systems to characterize the structures of metabolites. This results in a general workflow for metabolism studies for drug discovery and development.
Drug metabolism (biotransformation) is a process by which lipophilic xenobiotics are converted into hydrophilic metabolites, to facilitate elimination from the body. Cytochrome P450, uridine 5'-diphosphate glucuronosyltransferase (UGT), and sulphotransferase (SULT) are commonly involved in metabolic conversions. They catalyze many different reactions including hydroxylation, dealkylation, epoxidation, reduction, glucuronidation, and sulphation.
In most cases, metabolites are less pharmacologically active and less toxic than their corresponding parent forms. Some compounds, however, can be metabolized to pharmacologically active metabolites or reactive species that result in prolonged efficacy or idiosyncratic toxicity, respectively. For example, levodopa exerts its therapeutic effect by converting to its active form, dopamine (1), and acetaminophen undergoes P450 bioactivation to a highly reactive intermediate N-acetyl-p-benzoquinone imine, which is widely accepted as the primary culprit for acetaminophen-induced acute liver failure (2).
Metabolism is one of the vital determinants of a drug's pharmacokinetic properties. High metabolic liability usually leads to high clearance and poor bioavailability. The formation of active or toxic metabolites enhances the pharmacological and toxicological effects. Thus, drug discovery and development scientists have increasingly become aware of the important role of metabolite profiling. Knowledge of the metabolic soft spots and bioactivation potential in vitro and of the metabolic pathways in vivo guide chemists in lead optimization from the earliest stages. Such knowledge is similarly valuable in the drug-development process for selecting a candidate from among several entities equally effective in their therapeutic response and for explaining pharmacokinetic or pharmacodynamic disconnects.
The primary tasks in metabolism study are the detection of metabolites and determination of the type and site of modifications. Yet performing these tasks can prove challenging. Biological matrices are complex, containing large excesses of proteins, lipids, and other endogenous compounds that can interfere with detection. In addition, metabolism often results in a number of structurally diverse metabolites with relatively low concentrations (nanomolar to micromolar).
Many analytical techniques can be utilized to identify drug metabolites (3,4). Among them, mass spectrometry (MS) has proven itself pivotal for several decades because it can greatly improve analytical sensitivity, selectivity, and speed. The molecular weight of each metabolite can be readily obtained from the measured mass-to-charge ratio (m/z) of the protonated or deprotonated molecule in positive or negative ionization mode. If the measured m/z is sufficiently accurate (<5 ppm), the elemental composition of a metabolite can also be definitely derived.
Generally speaking, metabolites share the same nuclear structure as that of the parent drug. Consequently, one can identify the various types of biotransformation by comparing the molecular weight or elemental composition of the metabolite with that of the parent. The mass changes of biotransformations most often encountered in metabolism study appear in Table 1. Furthermore, the detailed fragmentation data generated from the MS–MS experiments provide rich structural information on the metabolites (5–7).
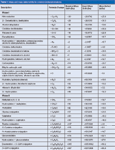
Table 1: Mass and mass defect shifts for common biotransformations.
Liquid chromatography (LC) offers the capability to separate the analytes from matrix interferences and one another, thus facilitating detection and structural elucidation. Yet the coupling of LC with MS (LC–MS) was once difficult because of the need to convert aqueous LC effluent into gas-phase ions. With the development of the atmospheric pressure ionization (API) techniques of electrospray ionization (ESI) and atmospheric pressure chemical ionization (APCI), analytical laboratories have routinely used LC–MS since the mid-1980s for rapid determination of drugs and structure elucidation of drug-related materials directly from biological matrices (8).
Mass analysers, the components of mass spectrometers that sort the ions according to their mass-to-charge ratios, come in two types: Unit-resolution and high-resolution. Two unit-resolution systems, triple-quadrupole and ion-trap mass spectrometers, have been the most frequently used in the metabolite identification field during the last decade (8–10).
A triple-quadrupole mass spectrometer can be operated in these scan modes: Full, constant neutral loss (NL), precursor ion (PI), and product ion. The ion-trap mass spectrometer can perform multiple-stage mass spectrometry (MSn), provide detailed fragmentation pathways, and thus narrow the potential sites of modification (8,11–13). Yet because of their relatively low resolution, these techniques lack the necessary selectivity to distinguish metabolites from the isobaric interferences in complex matrices. In addition, these unit-resolution-based techniques are usually performed by experienced scientists with a strong background in metabolite identification.
Innovations in ion-physics technology have prompted a paradigm shift in the field of drug metabolism, from using low-resolution triple-quadrupole or ion-trap instruments toward adopting high-resolution (HR) mass spectrometers. Modern HR-MS mass spectrometers include time-of-flight (TOF) instruments, Fourier transform-based instruments such as orbital trap systems (Thermo Fisher Scientific), FT-ion cyclotron resonance (FT-ICR), and hybrid instruments such as quadrupole TOF (QTOF), linear ion trap–orbital trap, and linear ion trap–FT-ICR systems (3,14–17). They all provide high resolution — greater than 10,000 full-width half-maximum (FWHM) — and accurate-mass capabilities, generally ≤5 ppm for QTOF and ≤2 ppm for orbital traps. Therefore, these instruments enable discrimination of metabolite ions from nominally isobaric biotransformations or background interferences.
Accurate-mass measurements by MS, MS–MS, or MSn allow for the unequivocal determination of empirical formulae of metabolites and their fragments, providing invaluable information to aid, postulate, or assign structures to the metabolites (18,19). Along with the development of the state-of-art HR-MS instrumentation, "intelligent" data acquisition and data mining tools have also emerged, which markedly accelerate and simplify the metabolite screening and identification process (20–33). For drug metabolism scientists, HR-MS is now the premier analytical tool of choice in their research.
Owing to its superior sensitivity, resolution of 20,000–40,000 FWHM, mass accuracy of ≤5 ppm, speed of ≤20 spectra/s (without sacrificing sensitivity or resolution), dynamic range of 4–5 orders of magnitude, and relatively low cost, QTOF-MS has gained wide acceptance as a highly attractive tool in small-molecule drug metabolism studies. Many applications have demonstrated the ability of the technique to determine labile spots, elucidate the structures of metabolites in the circulatory system and excreta and evaluate the bioactivation potential of drugs (24,25,34–42). In addition, QTOF-MS enables simultaneous, exact-mass, qualitative, and quantitative analysis of multiple analytes using the ful-scan mode in one injection cycle, which meets the demand for high throughput in a fast-paced, drug research and development (R&D) environment (43–47). QTOF-MS has therefore become the most often used HR-MS technique in drug discovery and development.
The development of several hybrid orbital trap instruments has expanded the application field of the orbital trap from bimolecular analysis to small-molecule research (15, 48–51). Hybrid orbital trap systems provide greater mass-resolving power (>100,000 FWHM) than QTOF-MS, and they can perform exact-mass MSn analysis (<2 ppm). Therefore, these systems increase confidence in the identification of biotransformations and localization of their sites (15,52,53). The orbital trap analyser's relatively slow scan speed (~1 s at 100,000 FWHM, ~0.25 s at 60,000 FWHM, ~0.1 s at 17,500 FWHM) is a drawback, however. When an orbital trap is coupled with an ultrahigh-pressure liquid chromatography (UHPLC) system, operators usually specify relatively low resolution (<70,000) to ensure sufficient data points across narrow chromatographic peaks (1–2 s) (54). The detection sensitivity and dynamic range (3 orders of magnitude) of orbital traps are also lower than those of the QTOF-MS. Furthermore, the orbital trap system exhibits the low-mass-cutoff problem characteristic of ion-trap mass spectrometers and is often referred as the "one-third rule." To correct this problem (at least in part), the new generation of orbital trap–based devices use dual collision cells, a collision-induced dissociation (CID) cell and a high-energy C-trap dissociation (HCD) cell (55). The HCD cell reportedly produces more abundant, low m/z ions, in a similar fashion to a QTOF instrument (56).
FT-ICR-MS can deliver ultra high mass resolution (>750,000 FWHM) with part-per-billion mass accuracy, so it is very useful for studying macromolecules like proteins with multiple charges (57–60). However, its relatively high purchase price, maintenance cost, and space requirements limit routine use in small-molecule drug metabolism research at the drug discovery stage.
In this column instalment, we introduce a way of using HR-MS systems to characterize the structures of metabolites. This approach results in a general workflow for metabolism study with HR-MS in drug discovery and development.
Paradigm Shift in the Strategy for Metabolite Profiling
The traditional strategy for metabolite identification requires numerous runs — full-scan, NL, and PI scans — to obtain the parent ions of metabolites, and then product-ion scans to produce fragment-ion information. This methodology is considered slow, cost-prohibitive, and laborious in a typical drug discovery scenario (61). Along with improved HR-MS instruments, a new HR-MS-based strategy for metabolite identification has emerged, as depicted in Figure 1 (34,37,62). The first two steps of the new strategy, metabolite generation and sample preparation using in vitro metabolic systems and in vivo animal models, are essentially the same as the first two steps of the traditional strategy.
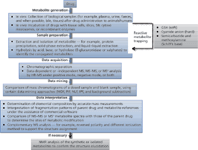
Figure 1: General strategy for metabolite profiling by HR-MS.
The significant shift in the new strategy lies in the utilization of various HR-MS-based automated data acquisition and data-mining technologies. Therefore, collecting precursor-ion and product-ion spectral data sets for profiling metabolites can be done in only a few injections (in some cases, even in a single injection), and discrimination of drug metabolites occurs via post-acquisition data mining. Thereafter, the structures of metabolites can be assigned. The assignment is accomplished by determining elemental composition changes and by comparing, on the basis of accurate masses and relevant drug biotransformation knowledge, the MS–MS or MSn spectra with the parent drug. This new approach fundamentally simplifies the metabolism tasks in drug discovery and development and allows structural elucidation with ease and high confidence.
Nevertheless, HR-MS does not always provide sufficient information for unambiguous identification of metabolite structures. In extremely difficult cases, the structures must be ascertained by chromatographic and MS fragmentation comparisons with synthesized or isolated metabolite standards whose structures are confirmed by nuclear magnetic resonance (NMR) analysis (63,64).
Mainstream Data-Mining Tools
Data interpretation has long been a rate-limiting process in elucidating metabolic pathways. Data-mining algorithms based on HR-MS systems, which have immensely improved over the past decade, streamline this process by finding the drug-related material ions against a background of endogenous matrix. The most frequently used data-mining methods included mass defect filter (MDF), background subtraction, isotope pattern filter (IPF), precursor ion filter (PIF), and neutral loss filter (NLF), which can be applied in combinatorial ways. These methods are now integrated in many post-data acquisition processing software packages, such as Metabolynx (Waters Corporation), MetWorks (Thermo Fisher Scientific), and Metabolite Pilot (AB Sciex). They are programmed to detect common metabolites as well as to reveal unexpected metabolites by virtue of dosed sample versus control comparison capabilities (27,53).
Mass Defect Filter: Mass defect is the difference between the exact mass of the molecule and its nominal mass. For example, acetaminophen has an exact molecular weight of 152.0712 and a nominal mass of 152, so the mass defect is +71.2 mDa. Any specific biotransformations do not result in a remarkable mass defect change in molecular weight. Therefore, their mass-defect values are similar: Oxidation, with a mass defect of –5.1 mDa and glucuronidation, with a mass defect of +32.1 mDa.
As summarized in Table 1, almost all the mass-defect values of metabolites fall within a defined, narrow window (approximately ±50 mDa), around that of the parent drug (20,23–25,34). Therefore, applying an MDF with a range around 50 mDa can detect metabolites by excluding ions whose mass defects fall outside this window, so that ions corresponding to metabolites can be substantially distinguished. Nevertheless, the MDF approach may be invalid for detecting metabolites from dealkylation or hydrolysis because these metabolites can exhibit significant mass defect shifts from that of the parent drug (25). For example, the mass defect values of flumatinib ([M+H]+ at 578.2366) and its amide hydrolysis metabolite ([M+H]+ at 302.1242) are 112.4 mDa apart. To remedy this weakness, an improved method was established. It applies the MDF approach to the parent drug and its major dealkylated fragments, so that all metabolites associated with the parent drug and its major dealkylated fragments can be identified (22).
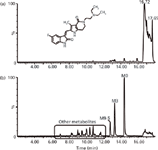
Figure 2: The TICs of famitinib metabolites in human faeces (a) without and (b) with MDF processing.
The utility of the MDF approach has been demonstrated effectively not only in the metabolism studies in liver microsomal incubations, plasma, bile, urine, and faeces, but also in the reactive metabolite screening experiments (22,36,37,65,66). Figure 2 gives an example of the effectiveness of MDF when used in the metabolite identification of famitinib (38). With mass defect filtering, a significant amount of endogenous interferences from faecal samples were removed, and the metabolites with low intensities can be easily recognized in the processed total ion chromatogram (TIC). In addition, the filtered spectra of metabolites dramatically simplified the data. As shown in Figure 3, the protonated molecule of M9-5 (m/z 427.1111), embedded among many other endogenous ions in the unprocessed spectrum, became predominant in the mass spectrum after MDF was applied.
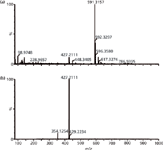
Figure 3: Mass spectra of famitinib metabolite M9-5 in human faeces obtained by QTOF-MS (a) without and (b) with MDF processing.
Background Subtraction: Background subtraction is an algorithm in MS data analysis by which ions presented in the control samples can be determined and subtracted from the spectra of the test samples (29). This method may lead to data degeneration when the unit-resolution data are used: The metabolite ion would be subtracted if its nominally isobaric interference occurs at the same chromatographic retention time in the control sample. With the aid of HR-MS, the isobaric interference is much less of an issue because the sub-part-per-million-level mass accuracy allows ions in a test sample to be discretely inspected with ions of the same m/z value in a control sample.
High-Resolution Precursor Ion Filter and Neutral Loss Filter: As post-acquisition data-mining tools, precursor ion filter (PIF) and neutral loss filter (NLF) are superior to PI and NL acquisition scans. They do not require prior knowledge of the fragmentation behaviour of the parent drug (37,53). Generally speaking, these two methods, particularly NLF, are effective in detecting conjugated metabolites. A neutral-loss value of 176.0321 Da (glucuronic acid) is commonly set for screening glucuronides, 79.9568 Da (sulphur trioxide) for sulphates, and 129.0426 Da (pyroglutamic acid moiety) for glutathione (GSH) conjugates. Applying a PIF of the anion at m/z 272.0888 (deprotonated γ-glutamyl-dehydroalanyl-glycine) to the MS–MS data set collected under negative mode provides better sensitivity than the NLF of 129.0426 Da approach to discern the GSH conjugates (67,68).
Isotope Pattern Filter: For compounds containing distinct isotope patterns arising from either the presence of natural isotopes (for example, Cl and Br) or the synthetic incorporation of stable-labelled isotopes (for example, 2H, 13C, and 15N) at a specific proportion, isotope pattern filter (IPF) has always been a favourite tool. Traditional unit-resolution-based IPF usually uses a single isotope ratio (for example, [M+2]/M), which is effective for high-abundance metabolites. It nevertheless tends to lose low-abundance ions in regions rich with matrix ions.
Recently, however, with the emergence of HR-MS systems, the improved IPF algorithm incorporated with accurate-mass options has significantly enhanced the detection sensitivity and selectivity of IPF (27,30,31). For example, Cuyckens and colleagues (30) applied IPF to profile, in rats, metabolites of R207910 with a bromine atom in its molecule. The typical IPF-processed chromatogram showed several distinct metabolite peaks, with most background peaks from the unprocessed profile eliminated.
Although this IPF is extremely powerful in detecting the isotope-remaining metabolites, it may miss the metabolites in which the isotope atom is eliminated under some biotransformations, such as dehalogenation. For example, a total of 12 metabolites of ornidazole were detected in human bile using an MDF method, as shown in Figure 4 (69). Yet only seven of them were observed in the IPF-processed chromatogram, and the other five dechlorinated metabolites were not found.
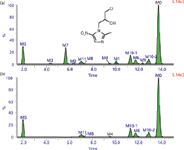
Figure 4: The TICs of ornidazole metabolites in human bile (a) with MDF and (b) with IPF processing. Adapted from reference 69.
Application of HR-MS in Determining Biotransformation Type
Because of the HR-MS data, the molecular formula of the metabolite under investigation is easily derived from the accurate mass. Therefore, one can determine the biotransformation type.
We recently reported the application of LC–QTOF-MS to identify the metabolites of famitinib, a novel inhibitor of the receptor tyrosine kinase in the plasma, urine, and faeces of cancer patients (38). After chemically "intelligent" (structure-dependent), mass defect filtering on the basis of the parent drug and its core substructure, a total of 25, 40, and 27 metabolites were detected in plasma, urine, and faeces, respectively. The structures of metabolites were then elucidated via comparisons of their elemental compositions and mass spectral fragmentations with those of the parent drug.
For example, the protonated ion of M7 was observed at m/z 409.2224 (Figure 5), nominally 2 Da less than the parent. M7 might be easily assigned as a desaturated metabolite. Yet the measured m/z difference (–1.9978 Da) between M7 and the parent was slightly lower than that of desaturation (–2.0157 Da). It was, in fact, compatible with the defluorination and the incorporation of a hydroxyl group. Another metabolite, M8, gave a protonated ion at m/z 413.2344 (Figure 5), nominally 2 Da greater than the parent. With the aid of high-resolution data, the incorporation of 2 Da was shown to result from hydrogenation (+2.0157 Da). The high-collision-energy mass spectrum of M8 revealed three fragment ions: At m/z 340.1447, 190.1067, and 189.0993. The ion at m/z 340.1447 was formed by the loss of a diethylamine moiety. The two ions at m/z 190.1067 and 189.0993 may have been generated by further cleavage of the bond between the 3-C of indolylidene and the exocyclic carbon atom of the ion at m/z 340.1447, with the charge retained on the methylpyrrolo-dihydropyridone part. The latter fragmentation pathway was specific and not observed for the parent drug or any other metabolites possessing exocyclic double bond, implying that hydrogenation may occur at the exocyclic double bond.
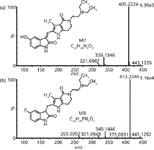
Figure 5: QTOF mass spectra of famitinib metabolite (a) M7 and (b) M8 under high collision energy in the ESI+ mode.
Further comparison of the retention time and MS fragmentation patterns with those of the synthetic standards confirmed the structure assignment of M7 and M8. Furthermore, several glucuronide and sulphate conjugates were characterized by neutral-loss filtering of 176.0321 and 79.9568 Da, respectively. β-Glucuronidase hydrolysis experiments were also conducted. The experiments sought to confirm the existence of glucuronide conjugates and discriminate the O- and N-glucuronides in this study, where the O-glucuronides can be hydrolyzed with increased, corresponding, hydroxyl metabolites, whereas the N-glucuronide is resistant to hydrolysis.
Application of HR-MS in Localization of the Metabolic Site
HR-MS can not only help to determine the biotransformation type, but also can help to better understand the fragmentation pattern of a metabolite, facilitating the localization of the metabolic site.
The metabolism of apatinib, a novel selective vascular endothelial growth factor receptor-2 inhibitor, in humans, was examined using LC–QTOF-MS (70). A total of 23, 35, and 14 metabolites were detected in human plasma, urine, and faeces, respectively. By identifying some diagnostic fragmentations, the structures of the metabolites can be tentatively elucidated.
For example, M1-6 gave the protonated ion at m/z 414.193, the molecular formula of which was calculated as C24H23N5O2, indicative of the incorporation of one oxygen atom to molecule of the parent. As show in Figure 6(a), the product ion spectrum of apatinib showed a predominant fragment ion at m/z 212.082, formed via cleavage of the nicotinamide amide bond. The fragment ion at m/z 92.049 represented the picolyl group. The product ion mass spectrum (Figure 6[b]) of M1-6 exhibited fragment ions at m/z 397.190, 228.080, and 108.044. The ions at m/z 228.080 and 108.044 were 16 Da higher than the fragment ions at m/z 212.082 and 92.049 of apatinib, respectively, indicating that oxidation had occurred at picolyl moiety. The appearance of the free radical ion at m/z 397.191 (calculated double-bond equivalent value of 16.0) formed by a loss of 17.002 Da (a hydroxyl radical) from the protonated molecule, suggested that M1-6 might be an N-oxide.
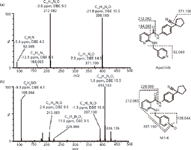
Figure 6: QTOF product ion spectra of (a) apatinib and (b) metabolite M1-6 under high collision energy in the ESI+ mode.
Treatment of human plasma with TiCl3, a selective reductant of N-oxides, resulted in the disappearance of the peak corresponding to M1-6 and an increase in the intensity of the peak related to unchanged drug in the chromatogram. The reference standard of M1-6 was also synthesized using m-chloroperoxybenzoic acid as the selective oxidant, and its structure was confirmed by NMR. Based on these data, M1-6 was unequivocally identified as apatinib-25-N-oxide.
Application of HR-MS in Bioactivation Study
Chemically reactive metabolites produced during xenobiotics metabolism are believed to contribute to drug-induced idiosyncratic toxicities (71,72). Consequently, screening and structural characterization of the reactive metabolites of a lead compound is one of the routine tests in early drug discovery (73).
These electrophilic species, generally with short half-lives, are hardly detected by analytical tools directly. Some nucleophilic trapping agents are therefore needed, among which glutathion (GSH) is the most frequently used reagent. These agents are usually added during incubations with liver microsomes and nicotinamide adenine dinucleotide phosphate (NADPH) to trap the reactive intermediates. Thereafter, the resultant products can be readily amenable to MS analysis. Results from the assessments allow the optimization of lead compounds with reduced bioactivation potential.
The NL scan of 129.0426 Da, under positive mode, and the precursor ion scan of m/z 272.0888, under the negative ionization mode, are two effective ways to rapidly screen the GSH conjugates, for both in vitro and in vivo samples (67,68,74). Currently, we found that different types (aliphatic, aromatic, benzylic, disulphide, thioester) of GSH conjugates appear to behave differently upon CID and that these characteristics can be used to differentiate the sites of GSH conjugation (68).
LC–QTOF-MS has been applied to study the bioactivation of 5-O-caffeoylquinic acid (5-CQA), the most widely occurring chlorogenic acid in dietary plants and medicinal herbs (39). Following incubations of 5-CQA with NADPH-supplemented and GSH-supplemented human liver microsomes, two types of GSH conjugates were detected and characterized with an MDF-based GSH screening template combined with PIF. For the first type of GSH conjugates (M1), the base peak ion was observed at m/z 385.059 (Figure 7), which was generated via the cleavage of the C–S bond of the glutathionyl moiety, and its occurrence suggested the presence of an aromatic-orientated thioether motif in the GSH conjugates. For the other type of GSH conjugates (M2), the predominant product ion was at m/z 306.072 (Figure 7), corresponding to the deprotonated glutathionyl moiety, which arose from a neutral loss of 5-CQA molecule. The facile neutral losses of intact 5-CQA molecules from the conjugates was indicative of alkyl-orientated GSH conjugates. By chemical synthesis and NMR analysis, M1 was found to be derived from ortho-benzoquinone intermediate, with M2 resulting from 1,4-addition of GSH directly to the α,β-unsaturated carbonyl group of the parent.
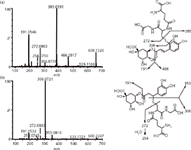
Figure 7: QTOF product ion spectra of GSH conjugates (a) M1 and (b) M2 under high collision energy in the ESI-mode.
Conclusions and Our Perspectives on the Future
Drug metabolism research is an essential component throughout the entire drug discovery and development processes. Along with the rapid and revolutionary developments in instrumentation and software, HR-MS has undoubtedly been accepted as an ideal tool for drug metabolism studies by the drug metabolism community.
Although the sophisticated data acquisition and mining software dramatically facilitate the detection of metabolites, the determination of modification sites remains challenging. Recently, some innovative tools have been made available to help resolve this problem. An ion mobility-MS model-based approach has been developed in recent years to supplement or complement traditional ways of metabolite structural elucidation. It compares the experimental collision cross-sections with the theoretical collision cross-sections based on the lowest energy conformation of the ions of the metabolites. We would like to see additional efforts made from commercial vendors to design an improved tool that can examine not only the fragmentation pathways but also the metabolism principles.
With the increasing demand for high-throughput screening, the qualitative and quantitative information about xenobiotic drugs and metabolites, even the endogenic biomarker, must be collected in the same sample and in the same analysis. Both QTOF and orbital trap systems have begun to simultaneously perform qualitative and quantitative assays (46,47,75,76), which may indeed introduce a true paradigm shift in future drug metabolism studies.
Cen Xie, PhD, is a research associate with the Shanghai Institute of Materia Medica at the Chinese Academy of Sciences in China. She has four years of experience in applying high-resolution mass spectrometry to the metabolism and bioactivation research of small molecules.
Xiaoyan Chen, PhD, is a principal investigator with the Shanghai Institute of Materia Medica at the Chinese Academy of Sciences in China. She has more than 18 years of research experience in the fields of pharmacokinetics, metabolism, and bioanalysis.
Dafang Zhong, PhD, is the director of the Center for Drug Metabolism and Pharmacokinetics Research with the Shanghai Institute of Materia Medica at the Chinese Academy of Sciences in China. During a 30-year career, he has published more than 200 papers and reviews in the fields of drug metabolism, pharmacokinetics, and LC–MS–MS methods for bioanalysis.
"MS — The Practical Art" Editor Kate Yu joined Waters in Milford, Massachusetts, USA, in 1998. She has a wealth of experience in applying LC–MS technologies to various application fields such as metabolite identification, metabolomics, quantitative bioanalysis, natural products, and environmental applications. Direct correspondence about this column should go to "MS: The Practical Art", LCGC Europe, 4A Bridgegate Pavilion, Chester Business Park, Wrexham Road, Chester, CH4 9QH, UK, or e-mail the editor-in-chief, Alasdair Matheson, at amatheson@advanstar.com
References
(1) D. Deleu et al., Clin. Pharmacokinet. 41(4), 261–309 (2002).
(2) H. Jaeschke et al., Drug Metab. Rev. 44(1), 88–106 (2012).
(3) C. Prakash et al., Mass Spectrom. Rev. 26(3), 340–369 (2007).
(4) Y. Chen et al., Pharm. Res. 24(2), 248–257 (2007).
(5) R.E. White, Annu. Rev. Pharmacol. Toxicol. 40, 133–157 (2000).
(6) D.I. Papac et al., Pharm. Res.18(2), 131–145 (2001).
(7) R.N. Xu et al., J. Pharm. Biomed. Anal. 44(2), 342–355 (2007).
(8) D.Q. Liu et al., Rapid Commun. Mass Spectrom. 16(13), 1330–1336 (2002).
(9) M. Jemal et al., Rapid Commun. Mass Spectrom. 17(24), 2732–2740 (2003).
(10) R. King et al., Curr. Drug Metab. 7(5), 541–545 (2006).
(11) L. Li et al., Drug Metab. Dispos. 39(3), 472–483 (2011).
(12) Y. Wang et al., J. Mass Spectrom. 43(8), 1099–1109 (2008).
(13) Y. Wang et al., Chem. Res. Toxicol. 22(5), 824–834 (2009).
(14) R.J. Mortishire-Smith et al., Rapid Commun. Mass Spectrom. 19(18), 2659–2670 (2005).
(15) H.K. Lim et al., Rapid Commun. Mass Spectrom. 21(12), 1821–1832 (2007).
(16) L. Cui et al., J. Am. Soc. Mass Spectrom. 19(4), 569–585 (2008).
(17) S.W. Holman et al., Rapid Commun. Mass Spectrom. 22(15), 2355–2365 (2008).
(18) A.W. Bristow, Mass Spectrom. Rev. 25(1), 99–111 (2006).
(19) G.R. Hopfgartner et al., J. Am. Soc. Mass Spectrom. 10(12), 1305–1314 (1999).
(20) H. Zhang et al., J. Mass Spectrom. 44(7), 999–1016 (2009).
(21) M. Wrona et al., Rapid Commun. Mass Spectrom. 19(18), 2597–2602 (2005).
(22) R.J. Mortishire-Smith et al., Rapid Commun. Mass Spectrom. 23(7), 939–948 (2009).
(23) H. Zhang et al., Rapid Commun. Mass Spectrom. 22(13), 2082–2088 (2008).
(24) K.P. Bateman et al., Rapid Commun. Mass Spectrom. 21(9), 1485–1496 (2007).
(25) M. Zhu et al., Drug Metab. Dispos. 34(10), 1722–1733 (2006).
(26) R.J.M. Weber et al., Anal. Chem. 83(10), 3737–3743 (2011).
(27) F. Cuyckens et al., Rapid Commun. Mass Spectrom. 23(2), 327–332 (2009).
(28) P. Zhu et al., Rapid Commun. Mass Spectrom.23(11), 1563–1572 (2009).
(29) H. Zhang et al., J. Mass Spectrom. 43(9), 1181–1190 (2008).
(30) F. Cuyckens et al., Anal. Bioanal. Chem. 390(7), 1717–1729 (2008).
(31) P. Zhu et al., Anal. Chem. 81(14), 5910–5917 (2009).
(32) A. Leblanc et al., Rapid Commun. Mass Spectrom. 24(9), 1241–1250 (2010).
(33) T. Rousu et al., Rapid Commun. Mass Spectrom. 23(6), 843–855 (2009).
(34) C. Xie et al., Bioanalysis 4(8), 937–959 (2012).
(35) J. Castro-Perez et al., Rapid Commun. Mass Spectrom. 19(6), 843–848 (2005).
(36) M. Zhu et al., Anal. Chem. 79(21), 8333–8341 (2007).
(37) M. Zhu et al., JBC 286(29), 25419–25425 (2011).
(38) C. Xie et al., Br. J. Pharmacol. 168(7), 1687–1706 (2013).
(39) C. Xie et al., Drug Metab. Dispos. 40(8), 1628–1640 (2012).
(40) R. Gao et al., Drug Metab. Dispos.40(3), 556–567 (2012).
(41) R. De Vooght-Johnson, Bioanalysis 3(4), 369–382 (2011).
(42) R. Niggeweg et al., Proteomics 6(1), 41–53 (2006).
(43) M. Jemal et al., Rapid Commun. Mass Spectrom. 12(19), 1389–1399 (1998).
(44) Y. Hsieh et al., Rapid Commun. Mass Spectrom. 7(5), 479–489 (2006).
(45) M. Jemal et al., Rapid Commun. Mass Spectrom. 7(5), 491–502 (2006).
(46) R. Ramanathan et al., J. Mass Spectrom. 46(6), 595–601 (2011).
(47) W. Korfmacher, Bioanalysis 3(11), 1169–1171 (2011).
(48) S.M. Peterman et al., J. Am. Soc. Mass Spectrom. 17(3), 363–375 (2006).
(49) R. Cho et al., J. Am. Soc. Mass Spectrom. 23(5), 880–888 (2012).
(50) T. Liu et al., J. Mass Spectrom. 46(8), 725–733 (2011).
(51) T. Liu et al., Rapid Commun. Mass Spectrom. 25(21), 3303–3313 (2011).
(52) A. Scherl et al., J. Am. Soc. Mass Spectrom. 19(6), 891–901 (2008).
(53) Q. Ruan et al., J. Mass Spectrom. 43(2), 251–261 (2008).
(54) T. Rousu et al., Rapid Commun. Mass Spectrom. 24(7), 939–957 (2010).
(55) J.L. Bushee et al., Rapid Commun. Mass Spectrom. 25(10), 1356–1362 (2011).
(56) M. Bantscheff et al., Mol. Cell. Proteomics 7(9), 1702–1713 (2008).
(57) M. D'Auria et al., Nat. Prod. Res. 26(15), 1368–1374 (2012).
(58) A.V. Tolmachev et al., Int. J. Mass Spectrom. 281(1–3), 32–38 (2009).
(59) J.S. Sampson et al., J. Am. Soc. Mass Spectrom. 20(4), 667–673 (2009).
(60) S. Kim et al., J. Am. Soc. Mass Spectrom. 20(2), 263–268 (2009).
(61) P. Wright, Xenobiotica 41(8), 670–686 (2011).
(62) K. Cox, in Using Mass Spectrometry for Drug Metabolism Studies, W.A. Korfmacher, Ed., (CRC Press, New York, New York, 2005) pp. 229–252.
(63) G.S. Walker et al., Drug Metab. Dispos. 39(3), 433–440 (2011).
(64) G.S. Walker et al., Expert Opin. Drug Metab. Toxicol. 4(10), 1295–1305 (2008).
(65) A. Gong et al., Drug Metab. Dispos. 38(8), 1328–1340 (2010).
(66) H. Zhang et al., J. Mass Spectrom. 38(10), 1110–1112 (2003).
(67) C.M. Dieckhaus et al., Chem. Res. Toxicol. 18(4), 630–638 (2005).
(68) C. Xie et al., Anal. Chim. Acta 788, 89–98 (2013).
(69) J. Du et al., Acta Pharm. Sin. B 2(2), 159–167 (2012).
(70) J. Ding et al., Drug Metab. Dispos. 41(6), 1195–1210 (2013).
(71) J. Uetrecht, Chem. Res. Toxicol. 21(1), 84–92 (2007).
(72) A.F. Stepan et al., Chem. Res. Toxicol. 24(9), 1345–1410 (2011).
(73) J.C. Erve, Expert Opin. Drug Metab. Toxicol. 2(6), 923–946 (2006).
(74) J. Castro-Perez et al., Rapid Commun. Mass Spectrom. 19(6), 798–804 (2005).
(75) M. Scigelova et al., Bioanalysis 1(4), 741–754 (2009).
(76) R.L. Wong et al., Bioanalysis 3(8), 863–871 (2011)

Understanding FDA Recommendations for N-Nitrosamine Impurity Levels
April 17th 2025We spoke with Josh Hoerner, general manager of Purisys, which specializes in a small volume custom synthesis and specialized controlled substance manufacturing, to gain his perspective on FDA’s recommendations for acceptable intake limits for N-nitrosamine impurities.
University of Rouen-Normandy Scientists Explore Eco-Friendly Sampling Approach for GC-HRMS
April 17th 2025Root exudates—substances secreted by living plant roots—are challenging to sample, as they are typically extracted using artificial devices and can vary widely in both quantity and composition across plant species.
Determining the Serum Proteomic Profile in Migraine Patients with LC–MS
April 17th 2025Researchers used liquid chromatography–mass spectrometry (LC–MS) in their proteomic analysis to compare the serum proteome of migraine patients with healthy controls and to identify differentially expressed proteins as potential migraine biomarkers.


