Qualitative LC–MS Analysis of Pesticides Using Monolithic Silica Capillaries and Potential for Assay of Pesticides in Kidney
LCGC Europe
This work describes a simple and sensitive high performance liquid chromatography (HPLC) method with mass spectrometry (MS) and ultraviolet (UV) detection for the analysis of mixtures of up to 32 pesticides.
This work describes a simple and sensitive high performance liquid chromatography (HPLC) method, with mass spectrometry (MS) and ultraviolet (UV) detection, for the analysis of up to 32 pesticides in a mixture. The analytes from substance classes such as carbamates, organophosphates, pyrazoles, triazines, or ureas were separated on C18 reversed-phase monolithic silica capillary columns using a gradient elution profile and directly transferred to a mass spectrometer. To improve resolution, capillaries were coupled, enabling identification of all pesticides. In addition, a porcine kidney sample was spiked with a set of seven pesticides and after a typical solid-phase extraction (SPE) procedure all analytes were detected using liquid chromatography–mass spectrometry (LC–MS). For selected compounds, calibration curves were prepared as well as limits of detection (LODs) determined.
Since humans started to settle and grow crops, fighting pests has been an important issue to securing food supply. Approximately 4500 years ago, sulphur was used in pest control; and approximately 2500 years ago, arsenic was used for the repelling of insects (1). Until the middle of the 19th century, various inorganic chemicals were applied in pest control, including copper sulphate (smut or bunt), mercury (rats or insects), sodium chloride (weeds), or even simple water (to protect plants from caterpillars or lice [2]). Since then methods have become increasingly elegant. In the late 19th century, herbal agents, such as pyrethrum or rotenon, were discovered and used as insecticides (3,4). Over time, synthetic pesticides were developed — copper-, lead-, or mercury-containing compounds and organic molecules, such as dithiocarbamates, became the first choice of fungicides (5,6), with dinitrocresol as the first synthetic insecticide. Later developments in the field of pesticide synthesis resulted in tetraethylpyrophosphate, dichlorodiphenyltrichloroethane (DDT), 2,4-dichlorophenoxyacetic acid, esters of thiophosphoric acid, and triazines (6). In the late 1970s, traps were developed containing the pheromone of the spruce bark beetle Ips typographus.
According to the US Environmental Protection Agency (EPA), any substance intended for preventing, destroying, repelling, or mitigating any pest is referred to as a pesticide (7). However, pesticides differ in their properties — while molecules such as pyrethroids (for example, allethrin) or esters of thiophosphoric acid are easily biodegradable, other active agents from substance classes such as organochlorines (DDT, dieldrin), organophosphates (chlorfenvinphos, parathion), carbamates (carbetamide, carbofuran), or phenylureas (isoproturon, or linuron) are persistent and can accumulate in the environment (8).
Pesticides can be divided into three categories based on their half-lives (9):
- Nonpersistent pesticides: Half-life = <30 days; for example, pyrethroids.
- Moderately persistent: Half-life = 30–100 days; for example, many carbamates, chloroacetanilides, organophosphates, or ureas.
- Persistent pesticides: Half-life = >100 days; for example, organochlorines.
The toxicological risk of persistent compounds is high, especially with regards to accumulation in ground water resources or the food chain and the list of incidents is almost endless. In the US, atrazine and its microbial degradation products, deisopropylatrazine and deethylatrazine, were found to contribute to both surface and groundwater contamination in samples from coastal sediments, golf courses and a commercial harbour. Isoproturon and chlortoluron were found to be contaminating the Rhine as a drinking water resource. These important findings demonstrate the importance of establishing methods such as liquid chromatography–mass spectrometry (LC–MS) (10) for fast, sensitive and accurate analysis of pesticides.
This article describes the qualitative analysis of different pesticide standard mixtures, as well as of a spiked porcine kidney sample, using monolithic silica column technology combined with liquid chromatography–ultraviolet (LC–UV) and LC–MS detection. The pesticides analysed are applied as herbicides, algaecides, acaricides, insecticides, fungicides, nematicides, and rodenticides and belong to substance classes such as triazinones, carbamates, triazines, carbamates, phenylureas, chloroacetanilides, pyrazoles, chloroacetanilides, organophosphates, and ureas (see Figure 1). This list shows that the analysis of this substance class is challenging because of the different nature of the target molecules. To improve resolution, column coupling was performed. Limits of detection (LOD), as well as calibration curves, were determined for two of the pesticides.

Figure 1: Chemical structures of pesticides from different substance classes analysed in this work. 1 = metamitron (substance class: triazinone), 2 = carbetamide (carbamate), 3 = prometryne (triazine), 4 = carbofuran (carbamate), 5 = isoproturon (phenylurea), 6 = metazachlor (chloroacetanilide, pyrazole), 7 = metolachlor (chloroacetanilide), 8 = chlorfenvinphos (organophosphate), 9 = pencycuron (urea).
Experimental
Materials and Methods: The HPLC system used was a Dionex Ultimate 3000 nano (Thermo Fisher Scientific) including Chromolith CapRod RP-18 endcapped 300 mm × 0.1 mm and 150 mm × 0.1 mm analytical monolithic silica capillary columns (Merck Millipore). A UV detector was operated at 254 nm and the data acquisition was performed with Chromeleon software (Thermo Fisher Scientific). For column coupling a Teflon sleeve (IDEX) was used.
A Bruker Esquire 3000plus mass spectrometer (Bruker Daltonics) with an ion trap and a nano-electrospray ionization (ESI) source operated in positive mode was utilized with a m/z scan in the range of 170–365 (depending on the run type).
Sample Preparation: Stock solution I containing 32 pesticides was prepared by dissolving the compounds in acetonitrile/0.1 M formic acid (FA) and water 10:90 (v/v). This undiluted solution was utilized for UV detection, analyte concentrations are given in Table 1. For the MS analysis the stock solution was diluted by a factor of 150.
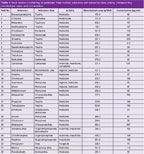
Table 1: Stock solution I containing 32 pesticides: Peak number, substance and substance class, activity, corresponding monoisotopic mass, and concentration.
Stock solution II contained seven pesticides and was prepared by dissolving the analytes in pure acetonitrile. For the MS analysis this stock solution was diluted by a factor of 1000. All analyte concentrations in the stock solution are given in Table 2.
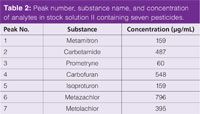
Table 2: Peak number, substance name, and concentration of analytes in stock solution II containing seven pesticides.
To prepare the calibration data for metamitron (MM) and metolachlor (MC) stock solution II was diluted to final concentrations of 159.0, 79.5, 31.8, 15.9, 8.0, 3.2, 1.6, 0.8, 0.3 and 0.1 μg/mL (MC); and 395.0, 197.5, 79.0, 39.5, 19.8, 7.9, 4.0, 2.0, 0.8 and 0.40 μg/mL (MM).
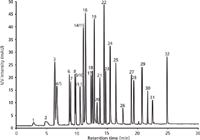
Figure 2: LCâUV chromatogram displaying the separation of a mixture of 32 pesticides on a 300 mm à 0.1 mm monolithic silica capillary column. Detection wavelength: 254 nm; mobile phase A: water with 0.1% formic acid, mobile phase B: acetonitrile with 0.1% formic acid; gradient: 5â85% B in 30 min. For peak annotations see Table 1.
For the preparation of the porcine kidney samples, 1 g of kidney was homogenized utilizing a Grindomix GM 200 knife mill (Retsch). The homogenized sample was subsequently spiked with 2 mL of pesticide stock solution II. The sample was vortexed and centrifuged at 4500 rpm for 20 min. The yellowish to reddish supernatant was decanted and acetonitrile removed during 120 min and at 50 °C under nitrogen stream (1 bar) using a TurboVap II (Biotage). To remove salts and tissue the residue was transferred to a LiChrolut RP-18e 500 mg cartridge (Merck Millipore) conditioned with acetonitrile and water prior to use. After a typical solid phase extraction (SPE) protocol and a final water washing step, the yellow band was eluted with 5 mL acetonitrile, followed by the addition of 2.5 mL of water to the eluate. After another concentration step (40 min, 50 °C, 1 bar nitrogen), the sample was filtered using a 0.45 μm syringe filter (Merck Millipore) and transferred to HPLC vials. Unspiked kidney samples were prepared in an identical manner.
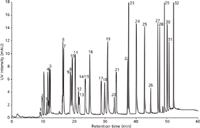
Figure 3: LCâUV chromatogram displaying the separation of a mixture of 32 pesticides on two coupled 300 mm à 0.1 mm monolithic silica capillary columns. Detection: Wavelength 254 nm; mobile phase A: water with 0.1% formic acid, mobile phase B: acetonitrile with 0.1% formic acid; gradient: 0’ 10% B, 5’ 22% B, 22’ 28% B, 30’ 35% B, 45’ 85% B, 55’ 85% B.
Results and Discussion
Figure 2 shows the separation of 32 pesticides on a 300 mm × 0.1 mm monolithic silica capillary column utilizing UV detection. A simple ramp allowed for the identification of most analytes within just 25 min.
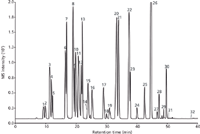
Figure 4: LCâMS base peak chromatogram of a mixture of 32 pesticides on two coupled 300 mm à 0.1 mm monolithic silica capillary columns (m/z = 170â365). Mobile phase A: water with 0.1% formic acid, mobile phase B: acetonitrile with 0.1% formic acid; gradient: 0’ 10% B, 5’ 22% B, 22’ 28% B, 30’ 35% B, 45’ 85% B, 55’ 85% B.
To further improve resolution column coupling was used. Coupling is quite common when handling analytical columns with internal diameters of 2 mm × 4.6 mm. However, when it comes to particle packed capillary columns that often bear frits with end fittings, coupling adds a huge dead volume to the system and decreases the quality of a separation in terms of efficiency and resolution. In contrast, monolithic silica capillaries do not require frits or any bulky end fittings; this is the reason why coupling is quite easy. Such column coupling can be performed by means of different connector types: So-called zero dead volume unions, sometimes being a bit intricate in handling, cause minimal dead volume, or a simple solution: A Teflon sleeve with an internal diameter of 250 μm for direct "head to tail" connection of two capillaries allows for dead volume free coupling. Because of the limited pressure stability of the latter technique it was used to connect the outlet of the analytical column to the inlet of the detector capillary, while the union with the high pressure stability served to connect two analytical columns. Figures 3 and 4 show the results. Compared to figure 2, this setup delivers a clear improvement in terms of resolution in both UV and MS detection for at least some peak clusters (3; 4 and 5; 8; 9 and 10). Gradient profiles were optimized in both chromatographic runs as indicated in the figure captions.
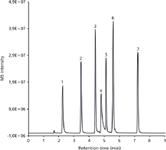
Figure 5: Typical LCâMS base peak chromatogram of a mixture of seven pesticides on a 150 mm à 0.1 mm monolithic silica capillary column utilized for the preparation of a calibration curve and the determination of the limit of detection for both metamitron and metolachlor (m/z = 200â290). Mobile phase A: water with 0.1% formic acid, mobile phase B: acetonitrile with 0.1% formic acid; gradient: 20% B to 80% B in 10 min. For peak annotations see Table 2.
Calibration curves were prepared for both metamitron (MM) and metazachlor (MC), as shown in Figure 5. Data was obtained at concentrations of 159.0 μg/mL, 79.5 μg/mL, 31.8 μg/mL, 15.9 μg/mL, 8.0 μg/mL, 3.2 μg/mL, 1.6 μg/mL, 0.8, μg/mL μg/mL 0.3 μg/mL, and 0.1 μg/mL (MM); and 395.0 μg/mL, 197.5 μg/mL, 79.0 μg/mL, 39.5 μg/mL, 19.8 μg/mL, 7.9 μg/mL, 4.0 μg/mL, 2.0 μg/mL, 0.8 μg/mL, and 0.40 μg/mL (MC). The linear range of the calibration was from 0.2–5.0 pg (0.16–3.33 ng/μL) for MM and 0.6–5.9 pg (0.40–3.93 ng/μL) for MC and the limits of detection (LOD) for the setup were 0.24 pg (0.16 ng/μL) and 0.59 pg (0.40 ng/μL) for MM and MC, respectively (see Figure 6). The column used for the linearity and LOD experiments had a length of 150 mm, while in the chromatograms separating the 32 compounds-mixture are 300 mm and 2 × 300 mm variants, that offered higher peak capacities.

Figure 6: Calibration curves for both metamitron (open circles, a) and metolachlor (closed triangles, b). The insets show the complete concentration range while the large diagrams display the linear regions of the curves. The limits of detection for the setup are 0.24 pg (0.16 ng/μL) for metamitron and 0.59 pg (0.40 ng/μL) for metolachlor.
The chromatograms obtained from analysing both blank and pesticide-spiked kidney samples are displayed in Figure 7. The spiked sample was diluted by a factor of 1:100 prior to injection and the chromatogram does not show any traces of matrix. For comparison, the blank kidney sample analysed without further dilution shows that some peaks that can be attributed to the matrix. When diluting the unspiked sample by a factor of 1:100 these matrix peaks disappear.

Figure 7: LCâMS base peak chromatogram of a mixture of seven pesticides spiked in porcine kidney on a 150 mm Ã 0.1 mm monolithic silica capillary column (m/z = 200â290). (a): Blank sample (undiluted), (b): spiked sample (diluted 1:100). Mobile phase A: water with 0.1% formic acid, mobile phase B: acetonitrile with 0.1% formic acid; gradient: 20% B to 80% B in 10 min. For peak annotations see Table 2.
Conclusion
Monolithic silica capillaries were used or the qualitative analysis of complex pesticide samples. It was shown that fritless capillaries can be coupled in a simple manner, minimizing dead volume for an increase in chromatographic resolution, although doubling analysis time. A calibration curve was prepared for a set of two pesticides and the linear range of this curve, as well as the LOD, was determined for both analytes. An SPE protocol was developed for the analysis of porcine kidney fortified with a pesticide standard and the extract was analysed using robust monolithic silica capillary technology. These results clearly indicate that the experimental capillary setup used in this work can be easily adapted for high sensitivity and sample restricted applications.
Simon Forster is a PhD student in the Analytical Chromatography section of Merck Millipore, Darmstadt, Germany. Under the supervision of H. Kolmar (Technical University Darmstadt) and S. Altmaier, he focuses on the synthesis and development of monolithic and open tubular capillaries for liquid chromatography.
Stephan Altmaier received his PhD in inorganic chemistry from Hannover University (Hannover, Germany) in 2003. Today, he is a laboratory manager in the Analytical Chromatography section of Merck Millipore. His focus is on the development of applications on monolithic silica HPLC columns of various dimensions and selectivities using UV and MS detection.
References
(1) A.E. Smith and D.M. Secoy, J. Agric. Food Chem. 23(6), 1050–1055 (1975).
(2) A.E. Smith and D.M. Secoy, J. Agric. Food Chem. 24(6), 1180–1186 (1976).
(3) B. Fugmann, F. Lieb, H. Moeschler, K. Naumann, and U. Wachendorff, Chemie in unserer Zeit 25(6), 317–330 (1991).
(4) G.T. Miller, Living in the Environment (Wadsworth/Thomson Learning, 12th Ed. Belmont, California, USA, 2002).
(5) Roland Dittmeyer, Wilhelm Keim, Gerhard Kreysa, Karl Winnacker, and Leopold Küchler, Chemische Technik (Band 8, Ernährung, Gesundheit, Konsumgüter. 5. Auflage. Wiley-VCH, 2004), pp. 218–223.
(6) Ulmanns Encyklopädie der technischen Chemie. Bd. 18. Uran (Fortsetzung) bis Zellwolle. 4. Auflage, Urban & Schwarzenberg, S. 4–15 (Stichwort: Pflanzenschutzmittel, Toxikologie).
(7) http://www.epa.gov/pesticides/about/index.htm
(8) J.S. Van Dyk and B. Pletschke, Chemosphere 82(3), 291–307 (2011).
(9) E.A. Kerle, J.J. Jenkins, and P.A. Vogue, EM 8561-E, (Oregon State University, Oregon, USA, 1994).
(10) L. Alder, K. Greulich, G. Kempe, and B. Vieth, Mass Spec. Rev. 25(6), 838–865 (2006).

Characterizing Polyamides Using Reversed-Phase Liquid Chromatography
May 5th 2025Polyamides can be difficult to characterize, despite their use in various aspects of everyday life. Vrije Universiteit Amsterdam researchers hoped to address this using a reversed-phase liquid chromatography (RPLC)-based approach.
New Method Explored for the Detection of CECs in Crops Irrigated with Contaminated Water
April 30th 2025This new study presents a validated QuEChERS–LC-MS/MS method for detecting eight persistent, mobile, and toxic substances in escarole, tomatoes, and tomato leaves irrigated with contaminated water.
University of Tasmania Researchers Explore Haloacetic Acid Determiniation in Water with capLC–MS
April 29th 2025Haloacetic acid detection has become important when analyzing drinking and swimming pool water. University of Tasmania researchers have begun applying capillary liquid chromatography as a means of detecting these substances.
Prioritizing Non-Target Screening in LC–HRMS Environmental Sample Analysis
April 28th 2025When analyzing samples using liquid chromatography–high-resolution mass spectrometry, there are various ways the processes can be improved. Researchers created new methods for prioritizing these strategies.

.png&w=3840&q=75)

.png&w=3840&q=75)


.png&w=3840&q=75)


.png&w=3840&q=75)


