High Analytical Performance for Untargeted Aroma Profiling by Combining Dynamic Headspace Sampling, Capillary Gas Chromatography and Time‐of‐Flight Mass Spectrometry
Food and beverage companies rely on accurate and detailed aroma profiling to deliver high-quality products with consistent key flavour compound profiles and to develop new products. Additionally, off-flavour compounds, which are occasionally present at ultra-trace levels, need to be carefully monitored. Quality and reliability of aroma analysis by capillary gas chromatography (GC) is greatly affected by the applied sample preparation technique and by the type of mass spectrometric detector used. Conventional solvent-based extraction techniques are increasingly being replaced by solventless techniques, such as dynamic headspace sampling (DHS), which is suitable for the characterization of aromas in food and beverages. The technique can also be fully automated and delivers full aroma profiling covering a wide volatility range. Hyphenation of DHS with capillary GC equipped with time-of-flight mass spectrometry (TOF-MS) further extends the range of aroma compounds detected. TOF-MS offers high sensitivity in full scan mode which is ideal for untargeted screening. Additionally, spectral continuity and increased acquisition speed allow deconvolution of chromatographically coeluting aroma compounds. Applications of DHS–GC–TOF-MS for the analysis of strawberry yoghurt, chocolate, and red wine are described.
Aroma is one of the most important characteristics of food and beverage products and has a major impact on the overall perception of quality by consumers. Aroma profiling analysis is therefore of utmost importance in the food and beverage industries. Accurate aroma profiling helps manufacturers to ensure quality through proper selection of the raw materials and to provide product consistency. Additionally, it supports the development of new products and the understanding of the influences of ingredients on the aroma of the final products. Aroma monitoring also allows us to investigate the influence of processing, such as roasting, development of the desirable odours during wine and cheese aging, and the shelf‐life.
Aromas are characterized by volatile and semi‐volatile compounds that reach our sense of smell through the air we inhale. Food products contain aroma compounds with a broad range of odour thresholds, values ranging from high parts per million (ppm, or mg/L, or mg/kg) for solutes such as 2,5‐dimethylpyrazine (roasted nut smell) to low or sub parts per trillion (ppt, or ng/L, or ng/kg) for solutes such as 2,4,6‐trichloroanisol (cork off‐flavour). This means that quantitatively minor compounds can have a major odour contribution, while highly abundant constituents might have little to no olfactory significance (1). A specific product odour can consist of a few up to hundreds of different aroma molecules of which key aroma compounds are often present at very low levels. In general, only a fraction of the volatile compounds are aroma‐active compounds, also called key aroma compounds, like furaneol in strawberry, citral for lemon aroma, 1‐octen‐3‐one for mushrooms, and so on. Approximately 10,000 different volatile and semi‐volatile compounds have been identified in foods and beverages covering nearly all chemical classes and functionalities (2). During food processing and storage, many chemical reactions involving sugars, amino acids, and lipids occur, for example, Maillard reactions, oxidations, and so forth. These chemical reactions lead to the formation of additional volatile aroma compounds and, potentially, to the formation of important off‐flavours. Complex food matrices—such as coffee, chocolate, and cooked/roasted meat—are known to contain as much as 1,000 aroma compounds (3). Many of these compounds are common to several different foods, such as pyrazines in both coffee and chocolate. On the other hand, aroma loss as well as off-flavour development is a serious problem in the food industry. Off‐flavours are caused by the presence of one or several molecules that are formed during processing but not expected above their threshold value in the final food product. A typical example is diacetyl (2,3‐butanedione) giving a buttery note to beer. Other examples are the formation of 3‐methyl‐2‐butene‐1‐thiol under light by reaction of the bitter acids and S‐containing amino acids in beer stored under non‐optimal conditions or the contamination of wine by 2,4,6‐trichloroanisol from non‐product‐related sources such as corks. Additionally, in recent years aroma profiling is more frequently used in food adulteration control and wine fraud. Several studies have already shown that aroma analysis of food products can be highly specific and can allow the discrimination of an original product from its adulterated counterpart (4) and even allows classification of botanical origin, such as is the case of wine (5).
The analysis of aroma compounds in food and beverages is challenging due to their presence at a broad concentration range (ppt to ppm), broad polarity range, volatility (high vapour pressures), and the instability of some important classes of aroma compounds. Aroma profiling can be performed either by sensory or instrumental analysis. There are numerous analytical approaches that can be used for aroma profiling, all involving isolation and concentration via extraction, separation, identification, and quantification of individual compounds. The choice of the instrumental method greatly depends on the goal of the analysis, namely research or quality control, on the expected concentration range of the aroma compounds and on the complexity of the aroma profile. The instrumental methods allow us to identify the individual compounds that are responsible for characteristic sensorial observations (either key aroma compounds or off‐flavours). Furthermore, instrumental methods implemented to run in routine laboratories to provide continuous information about the quality of the products (QA/ QC) should be easily validated. Proper isolation and correct identification of minor components with aroma significance are major challenges. Often key aroma compounds or specific off‐flavours are present at concentrations below the detectability of state‐of‐the‐art instrumentation. A solution can be found in combining the most exhaustive extraction techniques with the most sensitive mass detectors able to operate in full scan mode. Additionally, major aroma contributors often coelute with compounds that are less relevant or have no sensory significance, making their identification even more challenging. Instrumental methods can also be combined with olfactometric methods (such as sniffing port) providing correct insight into the aroma profile of the analyzed food and beverage products. If needed, organoleptic evaluation can be combined with heart‐cutting techniques to trap and enrich important aroma compounds for further fractionation and characterization. For isolation of aroma compounds from foods and beverages, classical liquid–liquid extractions (LLE) with organic solvents have been used for decades. However, these methods are costly, time consuming, labour intensive, and above all harmful to the environment. Furthermore, these methods are prone to analyte degradation and artefact formation, and the presence of significant amounts of co‐extracted non‐volatile material contaminating the instrumentation that is used. In recent years, headspace analysis has become a much more sustainable method for extraction of aroma compounds because the headspace contains most of the volatiles responsible for the overall odour of the food and beverage samples. Headspace sampling techniques include static headspace (SHS), solid phase micro‐extraction (SPME), headspace sorptive extraction (HSSE), dynamic headspace (DHS), and purge and trap (P&T). All these techniques are extensively used because of their automation, solventless character, and absence of interferences from the non‐volatile matrix.
From the range of headspace sampling techniques applied in our laboratory, DHS has proven to be one of the most exhaustive extraction techniques for aroma analysis. In DHS, a flow of an inert gas (helium or nitrogen) is continuously passed through the headspace of the sample (liquid or solid) so the equilibrium between the gas and liquid/solid phases is continuously shifted. The volatile and semi‐volatile compounds are then enriched on a trap that is subsequently heated to desorb the solutes to a cold inlet for focussing. Finally, the inlet is rapidly heated to inject the compounds into the capillary column. DHS sampling is one of the most versatile sampling techniques for trace compounds because of its flexibility in terms of volume of purge gas, sample incubation conditions, and the range of available trapping materials. A range of different traps filled with adsorbent (Tenax, carbon, for example) or absorbent (polydimethylsiloxane or PDMS) is available for different chemical classes of compounds. Tenax traps are probably the most frequently used for aroma analysis in food and beverage analysis because of the high retention of aroma compounds and low affinity towards water and ethanol, making them especially suitable for alcoholic and non‐alcoholic beverages. Additionally, recent developments in DHS techniques, such as full evaporation DHS (FEDHS), which is suitable for analysis of hydrophilic and low vapour pressure aroma compounds (6) and multi‐volatile DHS methods (MVM‐DHS), applying multiple traps in combination with a single gas chromatography (GC) run (7) have extended the applicability range.
In this article, the benefits of combining DHS with gas chromatography time‐of‐flight mass spectrometry GC–TOF‐MS are illustrated with three representative food samples: strawberry yoghurt, chocolate, and red wine.
Materials and Instrumentation
Materials: Red wine, strawberry yoghurt, and milk chocolate were purchased in a local store. Samples were stored according to the instructions on the labels, before analysis. For DHS and SPME analysis, 5 mL of red wine, 2 g of yoghurt, or 1 g of chocolate were placed in 20 mL headspace vials.
Instrumentation: All analyses were conducted on an Agilent 7890A GC (Agilent Technologies), coupled to a BT‐TOF mass spectrometer (Leco Corporation, St. Joseph, Michigan, USA). The gas chromatograph was equipped with a split/splitless inlet (for comparative analyses by SPME), a Gerstel CIS4 PTV inlet, and a Gerstel thermal desorption unit (TDU) (Gerstel). Enrichment via DHS, desorption, and injection were fully automated using the MPS‐Robotic Pro autosampler (Gerstel) and operated using Maestro software (Gerstel).
For wine analysis, DHS was performed at 70 °C. The sample headspace was purged with 300 mL helium and the volatile compounds were trapped on a Tenax trap. A dry purge step, flushing the Tenax trap with 2500 mL helium was applied to remove excess alcohol and water. For yoghurt, DHS was performed at 60 °C using a DHS sampling volume of 300 mL and a dry purge volume of 1500 mL helium. For chocolate, DHS was performed at 80 °C using a 1000 mL sampling volume. No dry purge was required for this sample type. Thermal desorption from the Tenax trap and injection of samples was carried out using the TDU.The TD trap was desorbed at 280 °C for 6 min onto the cold trap at −40 °C. The injection was carried out by ramping the cold trap from −40 °C (0.1 min) to 250 °C (7 min) with a ramp of 12 °C/s. A solvent vent injection with a 1:10 split ratio was used to introduce the aroma compounds on the column. The column was a DB‐WAX Ultra Inert (UI) (30 m × 0.25 mm i.d. × 0.25‐μm df, Agilent Technologies, Folsom, California, USA) and the oven temperature was programmed from 40 °C (5 min) to 250 °C (9 min) with a rate of 10 °C/min. The carrier gas was helium, at a flow of 1 mL/min. The column effluent was subsequently ionized by electron impact at 70 eV. Scan range was m/z 35–450 and acquisition was done at a rate of 10 spectra/s. The interface temperature was 260 °C and the ion source was maintained at 250 °C.
Data Analysis: A series of n‐alkanes (C7–C30) were analyzed for calculating retention indices (RI) using the integrated automated functions in the ChromaTOF software. Data acquisition and data processing were performed using ChromaTOF (Leco, v. 4.72). Data processing included peak finding, mass spectral deconvolution, peak area integration, and library searching with retention index match. For peak detection, an S/N cutoff was set at 25, and detected peaks were tentatively identified using the NIST 2017 library (700 minimum similarity was applied) and using retention index information (± 30 RI tolerance was considered). Comparative analyses were performed on an equivalent system equipped with an Agilent 5977B MSD, with an extractor lens source.
Results and Discussion
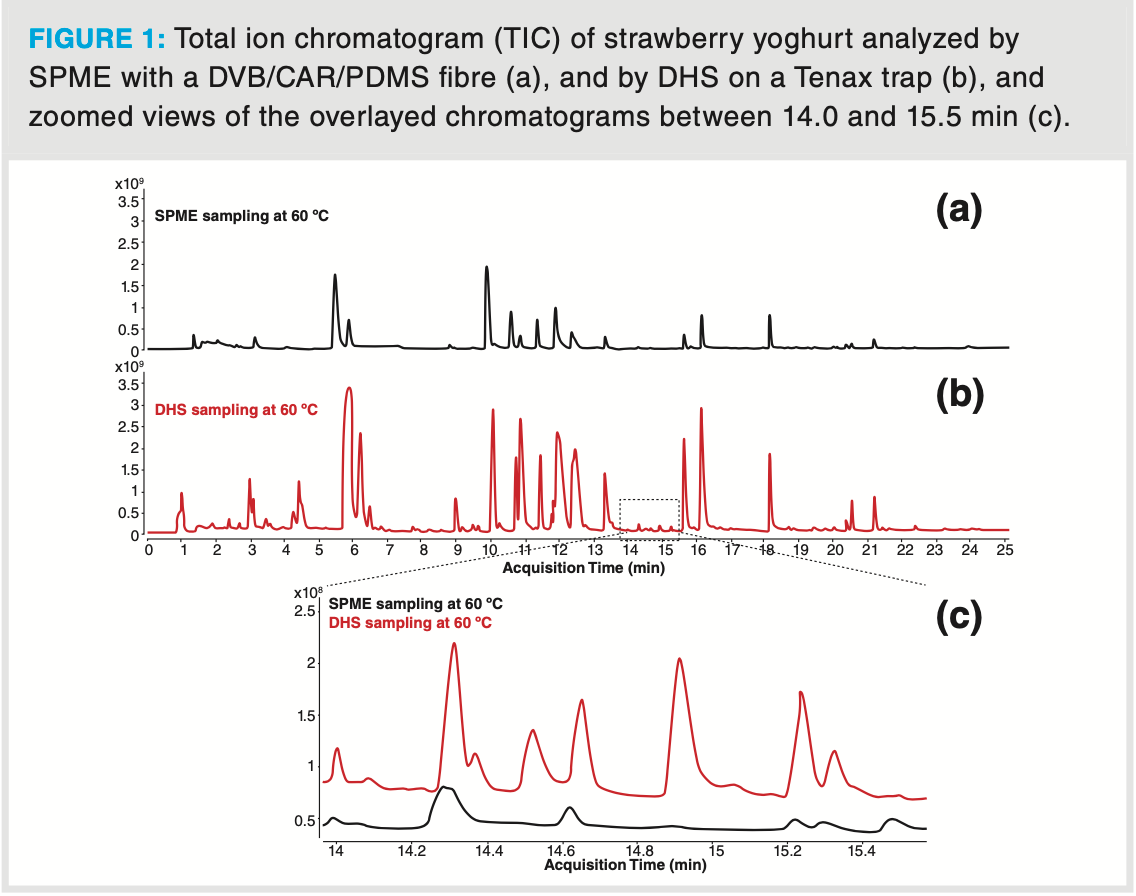
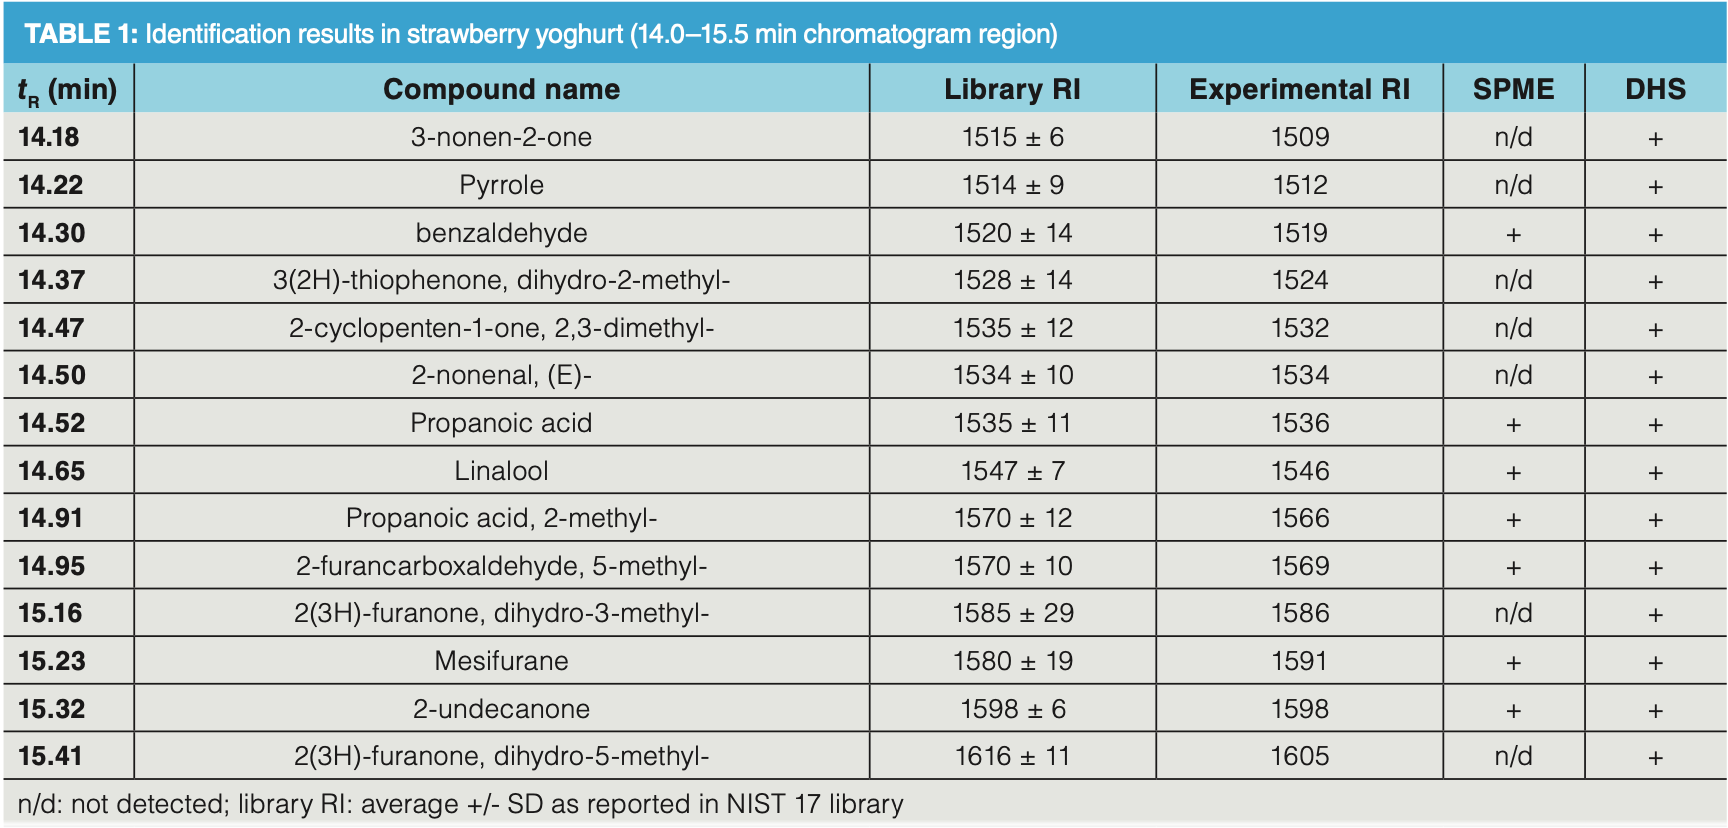
The exhaustive extraction performance of DHS is illustrated by the analysis of a strawberry yoghurt sample. Such a matrix is representative for dairy products. The profiles obtained by SPME and DHS are compared in Figure 1. Although it is true the selectivity of the SPME fibre was optimized for this experiment (divinylbenzene/ Carboxen/polydimethylsiloxane, DVB/ CAR/PDMS fibre), some very volatile compounds as well as semi‐volatile compounds were not detected by SPME sampling. For the majority of detected compounds, peak abundances obtained by DHS are 2–10 times higher compared to SPME. A detailed view of the elution region between 14.0 and 15.5 min shows that, using DHS, more “aroma‐relevant” compounds could be detected and identified. The odour compounds detected in this elution window are listed in Table 1, with their retention time (tR), identification based on the NIST mass spectral library search, library RI from the NIST library, experimental retention index, and detectability by SPME and DHS.
The success of aroma profiling of foods and beverages also greatly depends on the efficiency of the separation and the deconvolution performance and sensitivity of the detector used.
Although it has been demonstrated that comprehensive GC (GC×GC) has the potential to substantially increase peak capacity, one‐dimensional GC is still the industry standard, both in research and for quality control (QC). Therefore we preferred to focus on a standard GC approach using a 30 m capillary column operated at 1 mL/min constant flow rate and using a 10 °C/min. Estimated peak capacity under these conditions is in the order of 300–350.
Hyphenation of capillary GC with mass spectrometry (MS) provides the most powerful and effective method for aroma characterization. The characterization of complex aroma samples is done by comparing recorded mass spectra with mass spectral libraries after spectral deconvolution. The spectral match of an acquired mass spectrum with a library mass spectrum, expressed in % or promille, is a first indication of correct identification of the analyte. Additional confirmation can be further clarified using RI and comparison of experimental RI with RI databases. Comparison of retention indices is of especially high value for aroma profiles containing a large number of terpene isomers with similar mass spectra.
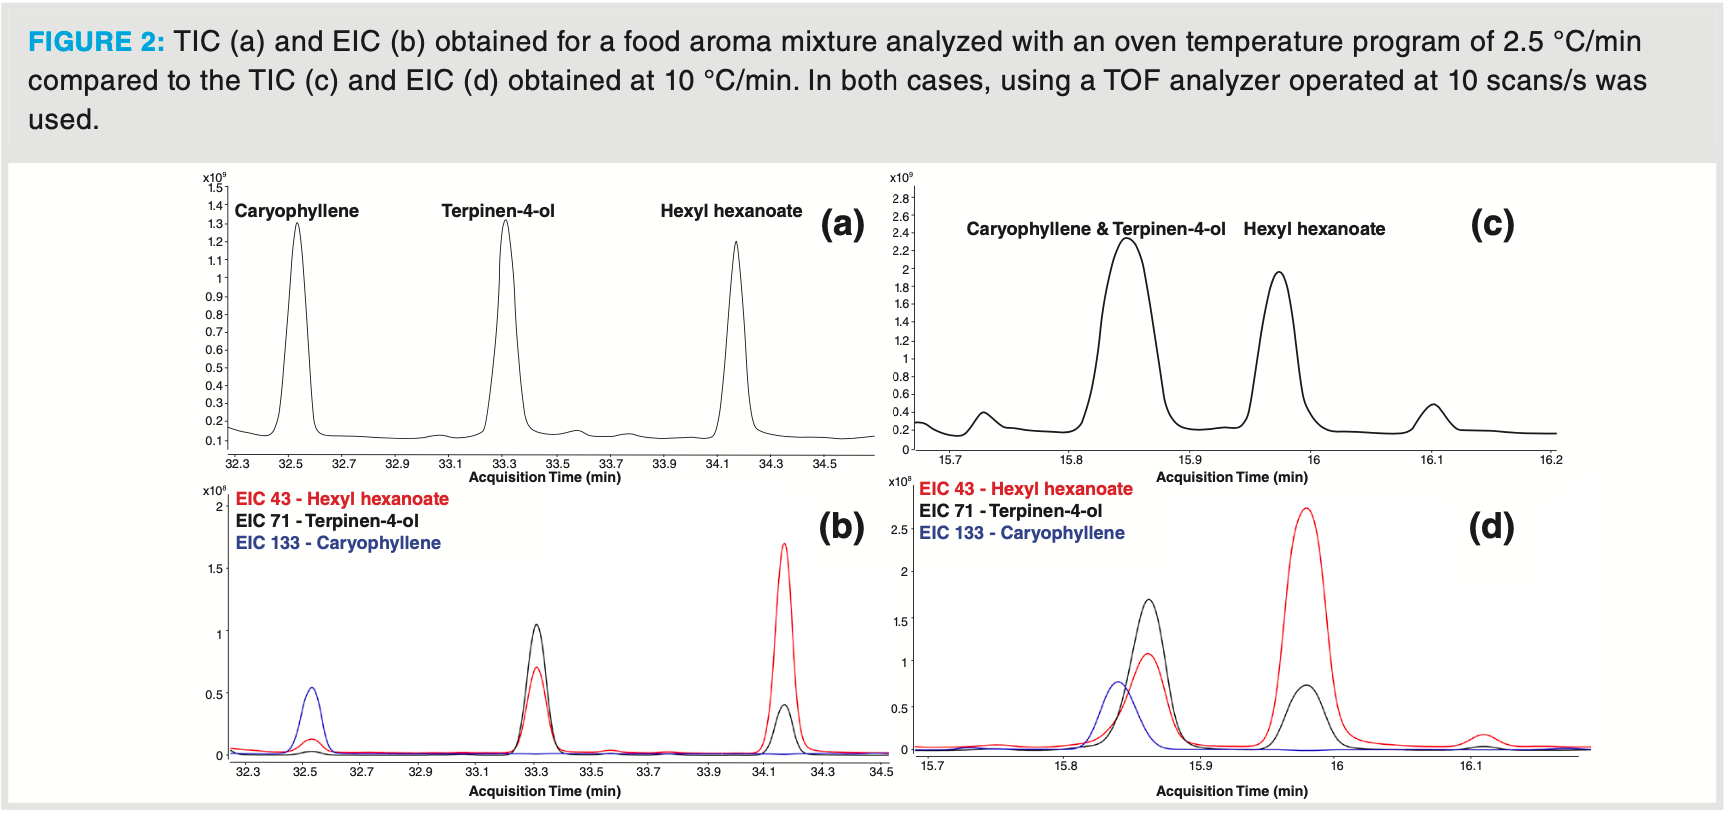
While single quadrupole mass spectrometers can be considered as the workhorse in gas chromatography‐mass spectrometry, time‐of‐flight (TOF) analyzers are gaining interest in the past decade. This is mainly due to their high sensitivity, while acquiring “full scan” spectra. Additionally, the acquisition speed is independent from the mass range for analysis, unlike the case with a quadrupole analyzer. Higher scan speeds of TOF analyzers offer the possibility to reduce GC run time and increase sample throughput, while maintaining correct peak detection (sufficient datapoints per peak), correct deconvolution (without mass skewing) and sensitivity. This is illustrated by the analysis of an artificial food aroma mixture, analyzed by DHS–GC– TOF‐MS under different GC conditions. As can be seen from Figure 2(a) and 2(b), analysis with a slow temperature program of 2.5 °C/min (run time per sample, including DHS method: (120 min) ensures complete separation of caryophyllene, terpinene‐4‐ol and hexyl hexanoate. However, when working with such a method, no more than 12 samples can be analyzed in 24 h. Increasing the oven temperature rate to 5 °C/min (run time, including DHS method: 80 min) will still allow separation of these compounds but with a sample throughput of 18 samples/24 h. By increasing the oven temperature rate to 10 °C/min, the throughput increases to 25 samples/24 h, but now caryophyllene and terpinene‐4‐ol are no longer chromatographically separated (Figure 2c and 2d). When operating with an acquisition speed below 5 scans/s, as usually done with the quadrupole analyzer, deconvolution and correct identification of terpinene‐4‐ol was not possible due to the lack of sufficient data points to extract a high quality mass spectrum from the caliper (= nondeconvoluted) mixed spectrum. Operating at higher acquisition speeds allows the deconvolution algorithms to extract a high‐quality mass spectra for both compounds, resulting in good matches with library spectra and correct identification.
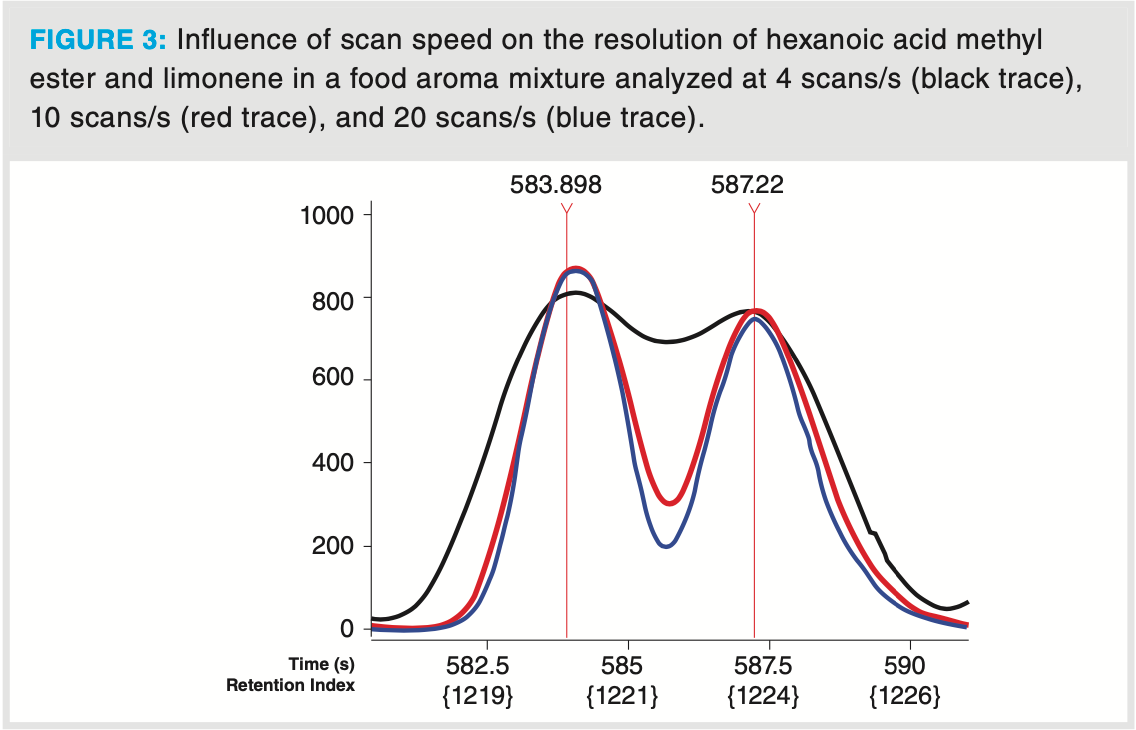
It should be noted that high acquisition speed also reduces the apparent peak width (full width at half height [FWHH]). This is illustrated in Figure 3, showing the separation of two closely eluting solutes in the artificial food aroma mixture. When analyzed at 4 scans/s, hexanoic acid methyl ester coelutes with limonene (valley > 80% of peak heights). When MS acquisition is done at 10 scans/s and 20 scans/s, separation increases, and at 20 scan/s almost baseline separation (valley < 20% peak height) is obtained. In addition, better spectral match factors of identified compounds are observed. This is illustrated in Table 2. While 5‐(hydroxymethyl) dihydrofuran‐2(3H)‐one is not identified when acquisition speed was 4 scans/s, the similarity increases to almost 800 when analyzing at 20 scans/s. The influence of scan speed on FWHH is also confirmed for these compounds. Mass spectra are
not “deformed” or altered by scan speed, but the deconvolution algorithm works much better at high acquisition speed, resulting in mass spectra that correspond better with library spectra. This explains the data presented in Table 2.

Analysis of a red wine sample further illustrates the high analytical performance of a TOF mass analyzer combined with DHS sampling (Figure 4). Deconvolution and NIST library search (match factor threshold of ≥ 700) provides identification of about 240 aroma compounds in the sample analyzed by TOF‐MS. When the analysis was performed on a parallel single quadrupole MS system, about 120 aroma compounds were identified in the same sample using the same DHS and GC conditions (Table 3). The difference in the number of identified compounds is, however, not only caused by the difference in sensitivity of the mass analyzer but mainly by the acquisition speed difference. When operating at 10 scans/s some of the coeluted compounds were efficiently deconvoluted which could not be done when operating at lower acquisition speeds.
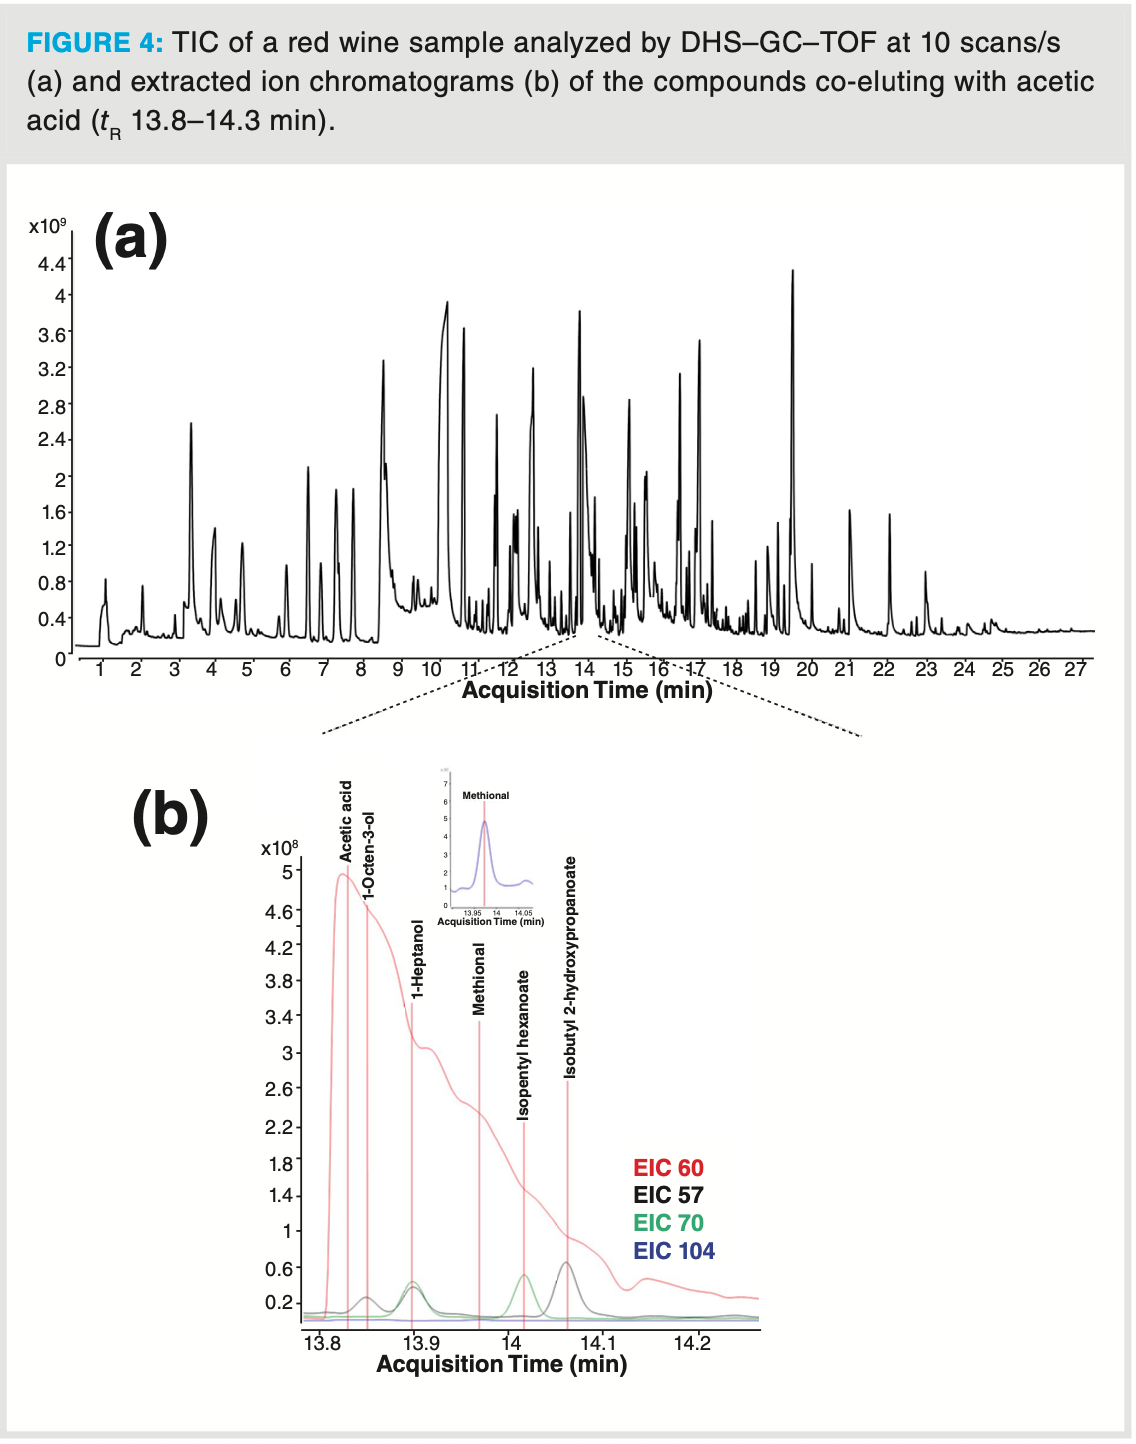

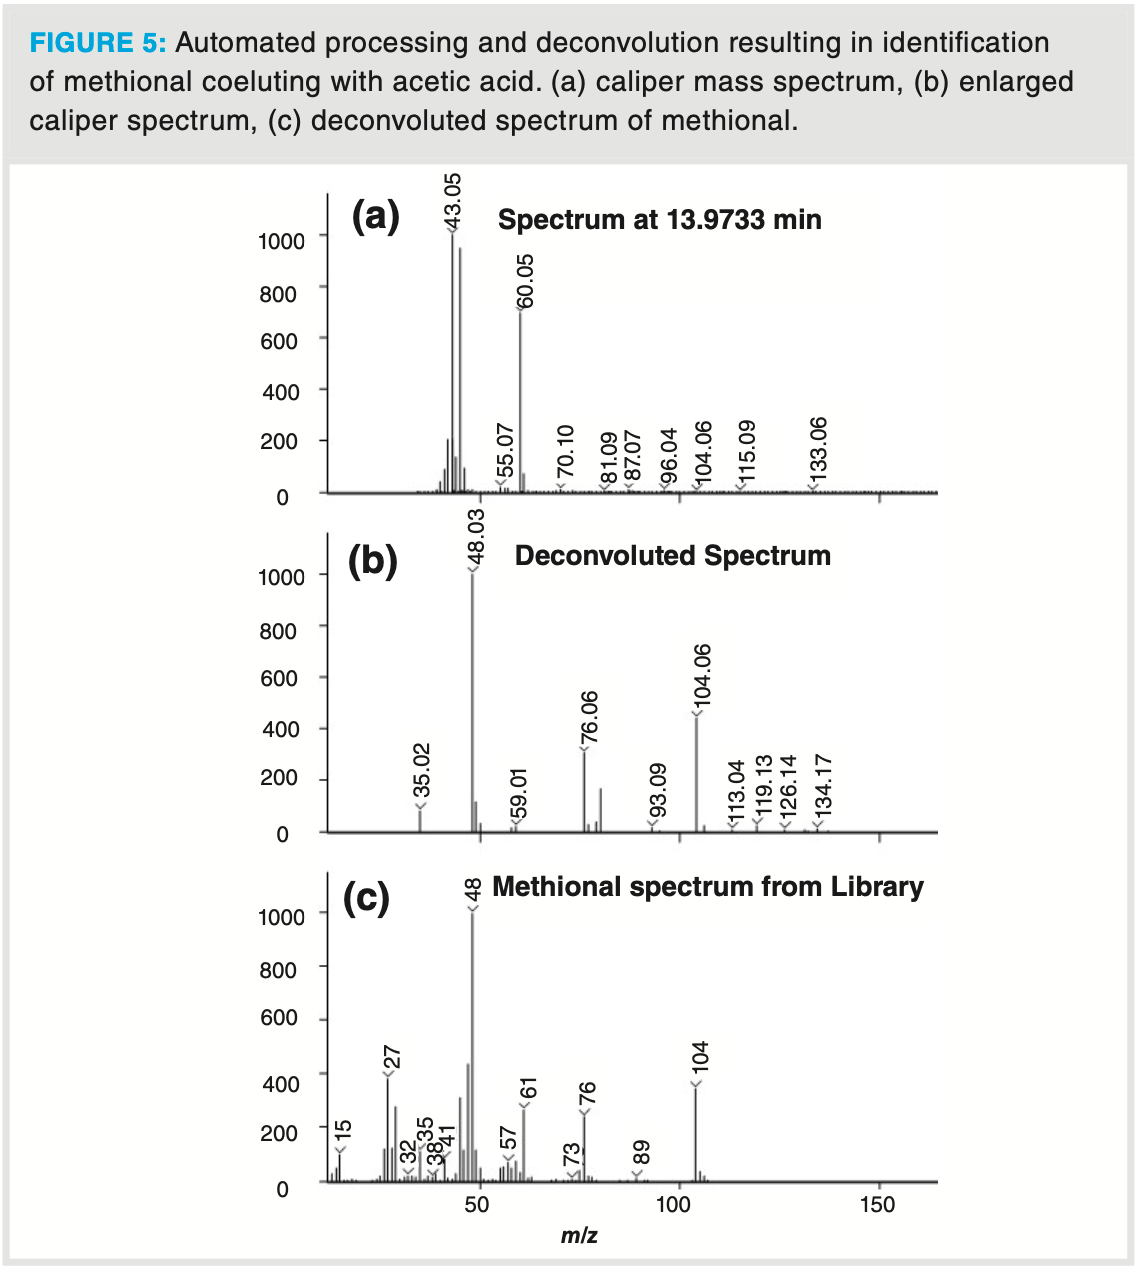
As an illustration of the deconvolution power of a fast scanning TOF‐MS, several compounds—including some known aroma compounds such as 1‐octen‐3‐ol and methional, co‐eluting with the tailing acetic acid peak—were successfully identified (Figure 4b and Table 4). These compounds are present at trace levels compared to acetic acid. Nonetheless, thanks to the extended dynamic range of the TOF analyzer, the low abundant ions in the total ion chromatogram (TIC) are correctly detected which allows correct deconvolution and identification as illustrated for methional (Figure 5). The relative abundance of the ions originating from methional are present below 1% relative ratio compared to the abundances of the ions originating from acetic acid (m/z 43, 60). Still this compound could be identified with a relatively high similarity factor and was additionally confirmed by its retention index (1454 library retention index vs. 1455 experimental retention index).

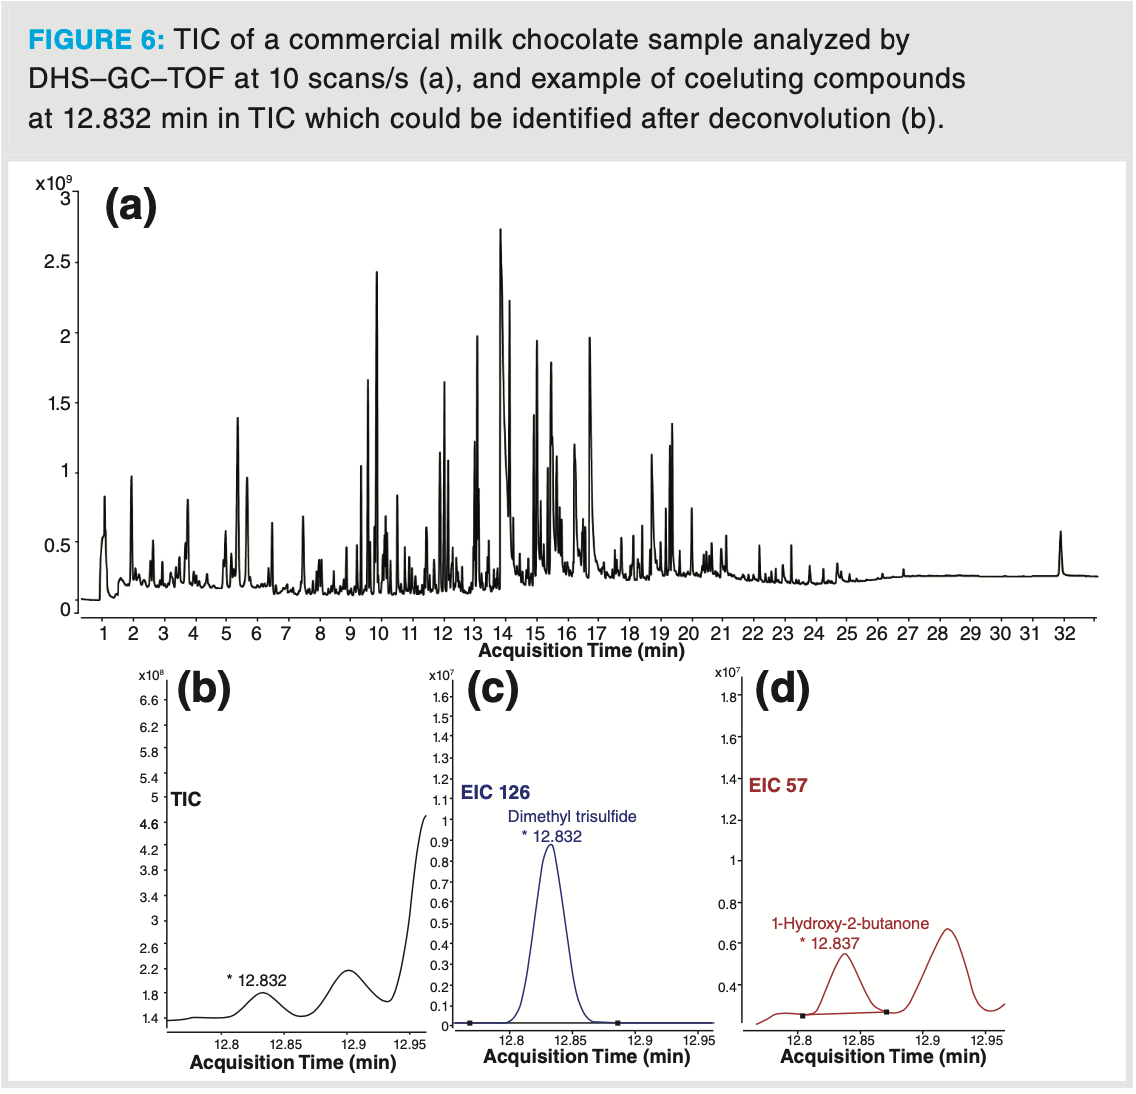
Finally, the analysis of a milk chocolate sample further illustrates how a complex aroma profile can be unravelled by DHS–GC–TOF‐MS (Figure 6). The complex chocolate aroma profile originates from the processing steps in the chocolate production, including cocoa beans fermentation, drying, and roasting. In this analysis, almost 280 different aroma compounds were identified in the chocolate headspace, which is about two times more than a similar analysis with a single quadrupole mass analyzer in full scan mode (Table 3). The identified aroma compounds belong to different chemical classes including acids and esters, pyrazines and furans, lactones, monoterpenes, aldehydes, ketones, and sulfur compounds. Thanks to the high sensitivity of the detector, trace sulfur compounds such as dimethyl disulfide and dimethyl trisulfide could easily be detected by the TOF analyzer with signal‐to‐noise ratios of 340 and 450, respectively. Again, deconvolution was of utmost importance in the elucidation of dimethyl trisulfide. In Figure 6 (b), the TIC profile at 12.832 min shows one distinctive symmetrical peak. After deconvolution, two compounds could be clearly identified and quantified, namely dimethyl trisulfide (extracted ion chromatogram [EIC] at 126) and 1‐hydroxy‐2‐butanone (EIC at 57) even though the apex difference was less than 500 ms. Identification of such closely coeluting compounds is possible due to the high acquisition speed which allowed us to obtain sufficient data points for deconvolution.
Conclusion
The combination of DHS with capillary GC–TOF‐MS is a great tool for untargeted analysis of aroma compounds in food and beverages. Compared to SPME sampling, DHS sampling provides a broader coverage of very volatile, volatile, and semi‐volatile aroma compounds due to dynamic purging and concentration of the headspace above the sample, resulting in a more exhaustive extraction and increased sensitivity. Dynamic headspace sampling is a universal technique for aroma analysis in various matrices, but DHS parameters—such as sample equilibration temperature, sampling volume, and dry purge conditions—need to be carefully optimized depending on the matrix type.
TOF‐MS offers unique features in terms of sensitivity and acquisition speed that can be exploited in fast untargeted screening. Even in one‐dimensional GC, the advantages of high acquisition speed, spectral integrity (lack of mass skewing), and low picogram sensitivity result in more detected, and positively identified compounds in a given matrix using a generic chromatographic separation. The TOF mass analyzer is without any doubt a valuable addition to the portfolio of mass spectrometers that can be successfully hyphenated to capillary GC.
References
(1) L.J. van Gemert. Odour thresholds: Compilations of odour threshold values
in air, water, and other media (Oliemans Punter & Partners, Utrecht, 2011).
(2) B. d’Acampora Zellner, P. Dugo, G. Dugo, and L. Mondello, J. Chromatogr. A. 1186, 123–143 (2008).
(3) D.S. Mottram and J.S. Elmore, in Encyclopedia of Food Sciences and Nutrition, L. Trugo and P.M. Finglas, Eds. (Cambridge, Massachusetts, USA, Academic Press, 2nd ed., 2003.)
(4) M.A. Farag, N. Hegazi, E. Dokhalahy, and A.R. Khattab, Food Chem. 331, 127358, (2020).
(5) A. Springer, J. Riedl, S. Esslinger, T. Roth, M. Glomb, and C. Fauhl‐Hassek, J. Agric. Food Chem. 62, 6844–6851 (2014).
(6) N. Ochiai , K. Sasamoto, A. Hoffmann, and K. Okanoya, J. Chromatogr. A. 1240, 59–68 (2012).
(7) N. Ochiai, J. Tsunokawa, K. Sasamoto, and A. Hoffmann, J. Chromatogr. A. 1371, 65–73 (2014).
AUTHORS
Tatiana Cucu and Christophe Devos are Senior Scientists at RIC group, Kortrijk, Belgium. Frank David is Principal Scientist at RIC group. Pat Sandra is Founder and advisor of RIC group and Emeritus Professor, Ghent University, Belgium. Direct correspondence to the Editor-in-Chief, Alasdair Matheson: amatheson@mjhlifesciences.com

New Study Reviews Chromatography Methods for Flavonoid Analysis
April 21st 2025Flavonoids are widely used metabolites that carry out various functions in different industries, such as food and cosmetics. Detecting, separating, and quantifying them in fruit species can be a complicated process.
University of Rouen-Normandy Scientists Explore Eco-Friendly Sampling Approach for GC-HRMS
April 17th 2025Root exudates—substances secreted by living plant roots—are challenging to sample, as they are typically extracted using artificial devices and can vary widely in both quantity and composition across plant species.
Miniaturized GC–MS Method for BVOC Analysis of Spanish Trees
April 16th 2025University of Valladolid scientists used a miniaturized method for analyzing biogenic volatile organic compounds (BVOCs) emitted by tree species, using headspace solid-phase microextraction coupled with gas chromatography and quadrupole time-of-flight mass spectrometry (HS-SPME-GC–QTOF-MS) has been developed.


