Hydrophobic Interaction Chromatography (HIC) for the Characterization of Therapeutic Monoclonal Antibodies and Related Products, Part 2: Practical Considerations
Hydrophobic interaction chromatography (HIC) is one of the historical analytical methods applied for the separation and purification of proteins. In the first part of this series, the elution and separation mechanisms were discussed. In this second part, some practical considerations such as method development, selection of the phase system, combined salt systems, and possibilities to combine HIC with other chromatographic modes are explained. Applications are critically discussed and the hyphenation to mass spectrometry (MS) briefly tackled.
Historically, a kosmotropic salt— typically 1.5–2 M ammonium‐sulfate—has been used as a mobile phase additive in hydrophobic interaction chromatography (HIC) (as well as 50–100 mM phosphate buffer). However, various salts can be applied, for example, ammonium acetate, sodium sulfate, ammonium chloride, sodium chloride, or sodium citrate. Salts follow the lyotropic (Hoffmeister series for their protein precipitation affinity in aqueous solutions. Kosmotropic salts are known to promote hydrophobic interactions and protein precipitation.
Salt nature may affect retention to a different extent on different stationary phases and for different types of proteins (1,2). This is probably due to several processes occurring at the same time as a mix of different mechanisms, including binding, unfolding, repulsion, steric effects, and so on, as discussed in Part 1 (3). Therefore, the effect of a salt is hardly predictable, but should be experimentally determined as an early step of the method development (1). Depending on the lyotropic strength of the salts, different concentrations are required to maintain the same salting‐out effect. Stronger salts result in appropriate retention already at relatively low concentration (such as 1–1.5 M), while weaker salts require higher concentration (up to 3–5 M) to maintain the same retention.
Peak widths might also vary with salt concentration because it impacts the gradient steepness and therefore the gradient band‐focusing effect. It has been demonstrated that for antibody drug conjugates (ADCs) and drug‐to‐antibody ratio (DAR) separations, quite similar selectivity could be achieved with any type of salts, once the lyotropic strength is corrected on a given stationary phase (1,2). Equivalent molarities of the salt systems can be determined for various columns on the basis of hydrophobicity index, that is, can be derived from the parameters of the linear solvent strength model (2).
An important practical aspect—in case of a mono salt system—is the required salt concentration, which has to be maintained as low as possible. In addition, it is suggested to dedicate high and ultra‐high performance liquid chromatography (HPLC/UHPLC) systems for hydrophobic interaction chromatography (HIC) measurements because there is a huge risk of salt precipitation and therefore clogging. Systems and columns need to be regularly rinsed and purged with water to avoid precipitation through the entire system. Dedicated inert HPLC/UHPLC systems more resistant to high salt concentration have, in recent years, been commercially introduced as well.
Salt Mixtures (Binary, Ternary) and Mobile Phase pH
Using salt mixtures instead of single salts can be interesting for HIC separations. Not only retention and selectivity, but also loading and binding capacity can be improved with salt mixtures (4–6). Besides the salt nature, the mobile phase pH also impacts the retention of proteins as a part of the electrolyte system. Depending on pH, both the proteins’ net charge and their conformation can change. In addition, hydrophobic interactions are stronger when the mobile phase pH is close to the isoelectric point of the protein. Therefore, the electrostatic repulsion between the protein molecules becomes smaller, favouring a closer arrangement on the surface of the stationary phase. A recent study reported on the effect of the pH on protein adsorption from mobile phase containing mixed salts (7). Binary and ternary salt mixtures of sodium chloride, ammonium chloride, sodium sulfate, and ammonium sulfate, as well as pure salts were used. The mobile phase pH was adjusted so that protein carried either positive, negative, or zero net charge. For each studied pH, the salt composition was varied keeping the overall ionic strength constant at a given value. Mixed salts could have either positive, negative, or no cooperative effects. The magnitude and sign of the effect depended on the net charge of the protein.
Besides mobile phase pH optimization and the use of binary salt systems, ternary salt systems are not really considered today for HIC method development, but it can be an interesting topic for future work.
State-of-the-art HIC Columns
In HIC, mildly hydrophobic stationary phases are commonly used (less hydrophobic than in reversed‐phase liquid chromatography [RPLC]). Most common stationary phase modifications include short n‐alkyls (butyl, ethyl), phenyl, ether, or alkylamide, linked to silica or polymeric based materials (1).
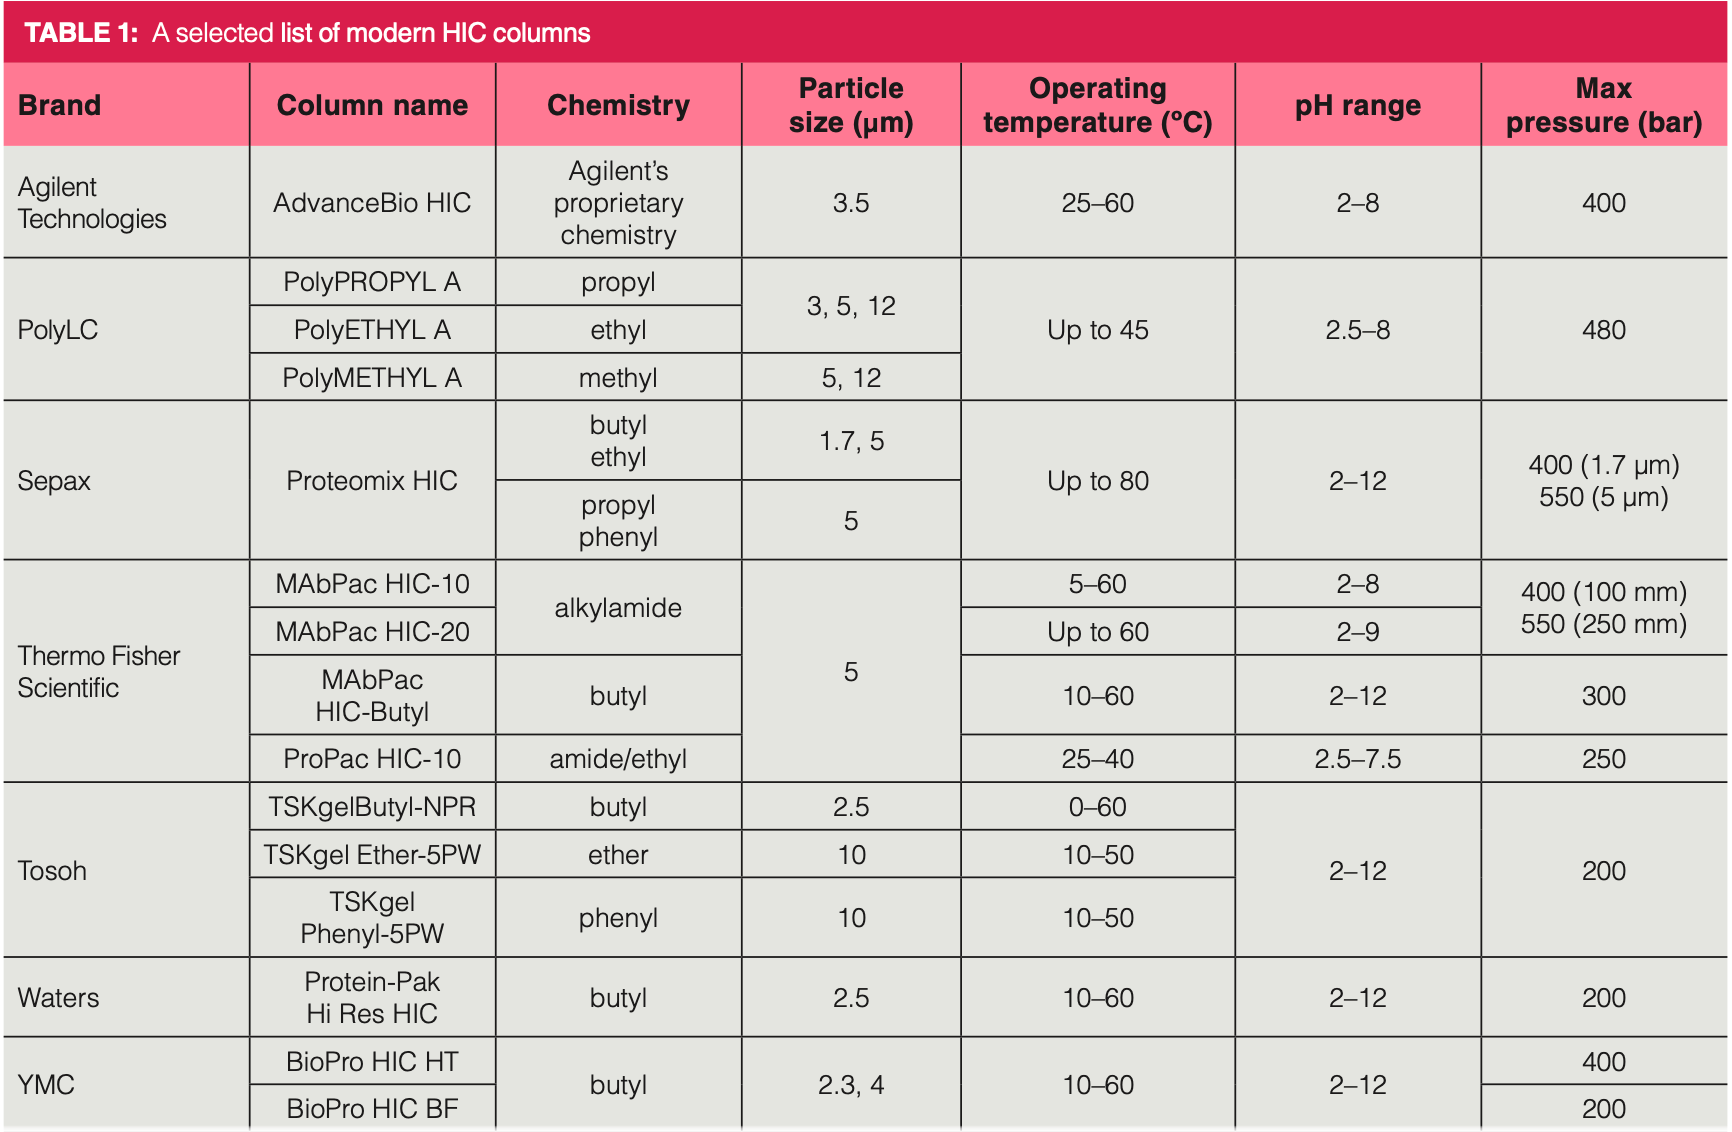
The strength of hydrophobic interactions between the protein and stationary phase ligand can be controlled mostly by the ligand density (8). Ligand density also impacts the access to the hydrophilic parts of the stationary phase. In addition, ligand hydrophobicity may impact the rate of protein unfolding in adsorbed state, while ligand size can influence steric effects. Aromatic ligands can provide some additional π–π interactions which can increase retention (9). An updated version of the most popular HIC columns (10) applied for the analytical separations of biopharmaceuticals is provided in Table 1. Most HIC columns are packed with 2.5–5 μm particles, but columns packed with sub‐2‐μm particles have also been commercialized. Some of the providers offer columns dedicated for mAb and ADC analysis.
Method Development in HIC
Historically, most HIC applications use butyl phases operated in ammonium sulfate and phosphate buffer as mobile phase. However, any salts having salting‐out properties (and appropriate solubility) can be considered as potential buffer components for HIC separations. Mobile phase pH, salt concentration and type, as well as organic modifiers and temperature can also change selectivity and retention. Therefore, it is valuable to perform a systematic method development rather than just applying the historical conditions or executing random or trial‐and‐error runs. Here, we provide a brief overview on the steps of a systematic approach (more details can be found elsewhere [1,11]).
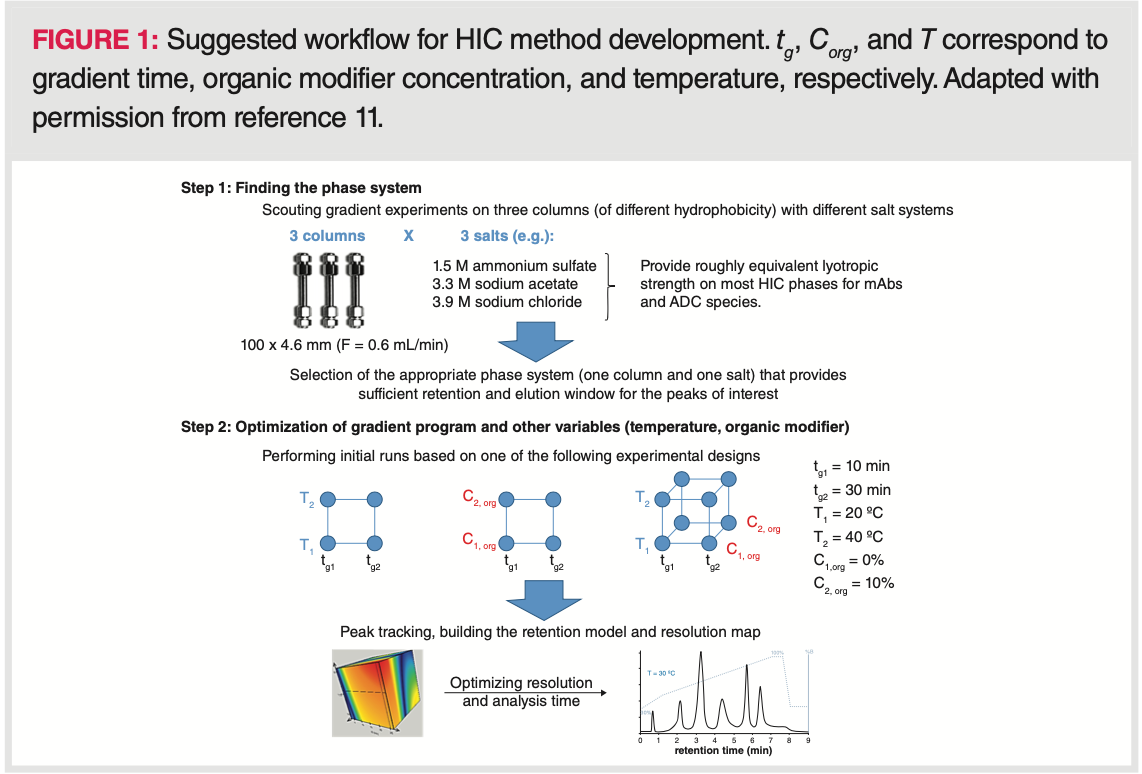
As a first step, it is recommended to find the most appropriate phase system. For this purpose, a few stationary phases (such as butyl, propyl, and phenyl phases) can be tested with different salt systems (for example, ammonium‐sulfate, sodium‐acetate, and sodium‐chloride) by running a generic linear gradient, and then the retention window, selectivity, peak shape, and recovery should be checked. Based on these scouting gradient experiments (corresponding to nine experiments when screening three columns and three salts), the best combination of the column and salt can be selected.
After the screening procedure, the gradient program and other variables, such as organic modifier, pH, or temperature, can be optimized by performing experimental design or retention modelling (11). Both require only a limited number of experiments (typically 4–9 experiments). The important thing is the selection of the most appropriate variables. The gradient steepness (program) can always be considered as an influential variable. Besides that, the organic modifier often impacts both the selectivity and recovery (especially for very hydrophobic samples) and sometimes mobile phase temperature has a significant impact as well. Figure 1 shows the schematic workflow of HIC method development.
Applications of HIC for Therapeutic Proteins
HIC is currently considered a reference technique for the analysis of cysteine‐linked ADCs (to determine DAR distribution and average DAR), for monoclonal antibody (mAb) analysis at intact and sub‐unit levels, for monitoring post‐translational modifications (such as oxidation, deamidation, and isomerization), and for determining the heterodimerization efficiency when the parental mAbs of a bispecific antibody (bsAb) possess different hydrophobicity (1,11–16).
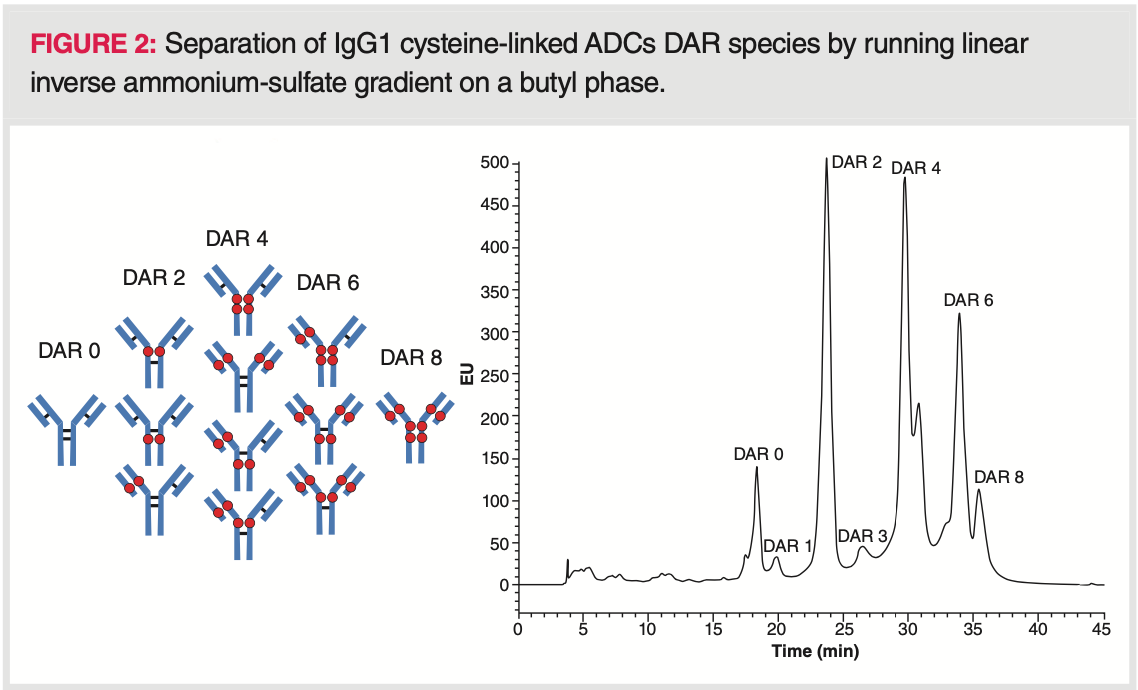
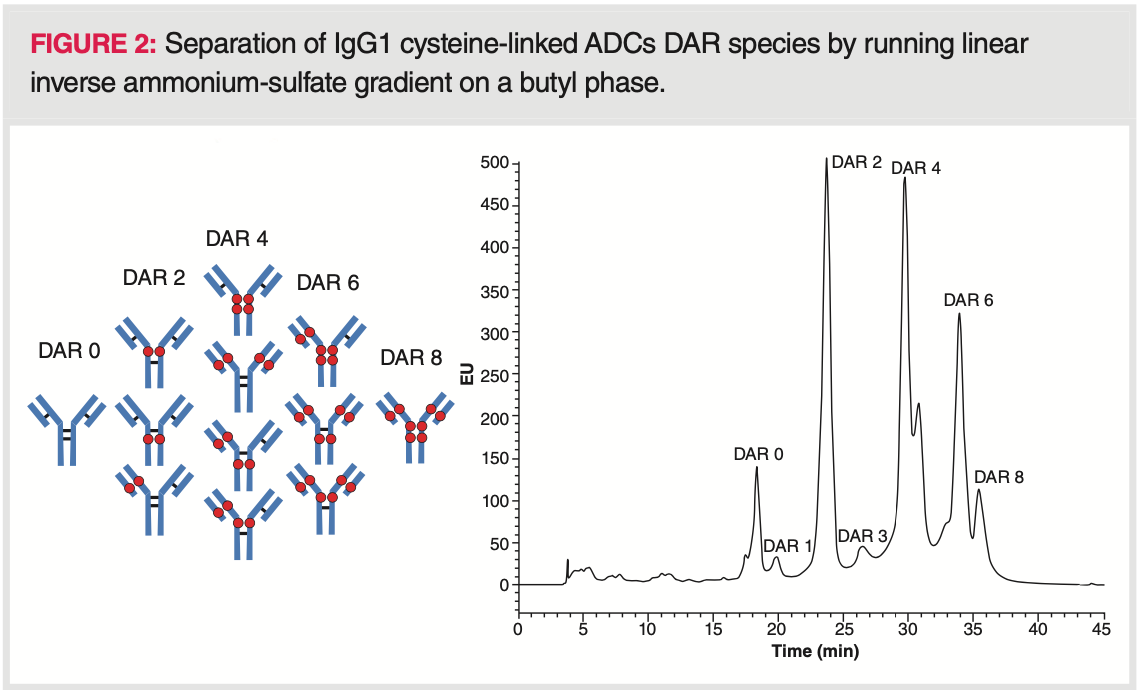
The drug‐loading, distribution, and conjugation sites of cysteine‐linked ADCs are known to influence pharmacokinetics, toxicity, and therapeutic index, therefore average DAR and distribution are considered as some of the most important quality attributes. A fully conjugated IgG1 type ADC has a maximum DAR of 8, while an IgG2 type has a maximum DAR of 12. IgG1 ADCs are composed of a heterogeneous mixture of 0, 2, 4, 6, and 8 DARs while IgG2 ADCs of 0, 2, 4, 6, 8, 10, and 12 DARs (17). An odd DAR number (for example, DAR1 or DAR3) of the conjugated drug is typically indicative of incomplete conjugation or degradation, and mostly observed in small amounts (12). A given DAR value can correspond to different positional isomers (for example, DAR4 of IgG1 ADC is possible to be formed in four different positional isomers). Because the cytotoxic drug linked to the IgG has a lipophilic character, the conjugation increases the hydrophobicity of the higher DAR species, and thus retention increases with the conjugation number. In most cases, a simple linear inverse salt gradient (such as 1.5–0 M ammonium‐sulfate) enables the separation of all different DAR species. Figure 2 shows a typical DAR separation performed by running linear inverse salt gradient.
The average DAR can then be calculated from the HIC profile. Chromatograms have to be acquired at 214 or 280 nm (using UV detection) or at λex: 280 nm, λem: 350 nm (using fluorescence detection). Peak area percentages of the different species have to be determined. Then, the weighted peak areas have to be calculated by multiplying the peak area percentage by the corresponding drug load. Finally, weighted average DAR can be obtained by summing the weighted peak area percentages and dividing their sum by 100 (18,19). Please note that the recovery of the most hydrophobic DARs (DAR6 and DAR8) is incomplete in some cases. Therefore, the addition of a small portion (5–15%) of organic modifier can be helpful. In such cases, the apparent average DAR may depend on the amount of organic modifier (20). Non‐linear gradients can also be applied to improve peak resolution for the late‐eluting species (21).
Very recently, HIC was applied for site‐specific PBD‐ADCs (PBD: pyrrolobenzodiazepine dimer) to separate DAR0, DAR1, and two DAR2 species (22). The HIC method had the advantage to determine not only DAR values and drug‐load distribution, but also to separate unique DAR2 conformations existing as a resultof the N‐glycan heterogeneity.
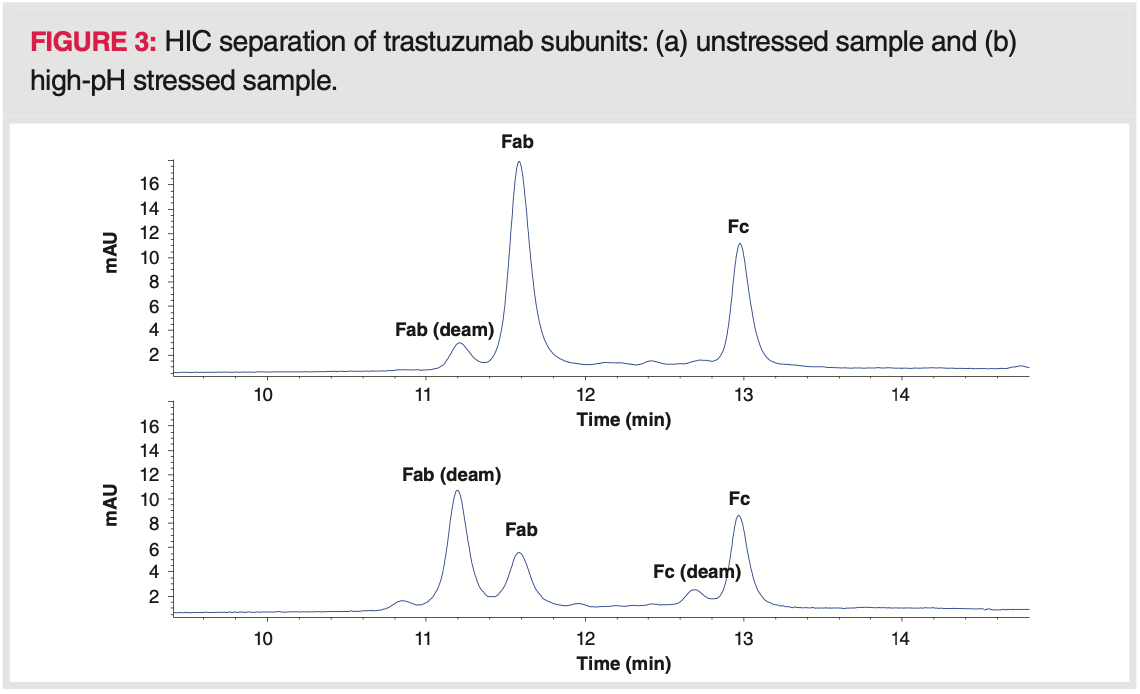
HIC is also a useful tool to separate hydrophilic and hydrophobic intact mAb variants (23). For example, several variants can be separated for infliximab, rituximab, and ofatumumab (23). However, HIC analysis at sub‐unit level is more informative and often used to separate oxidized Fab and Fc variants, which are less retained than the native forms (24). Figure 3 shows the HIC analysis of trastuzumab highlighting a deamidation event in the Fab fragment.
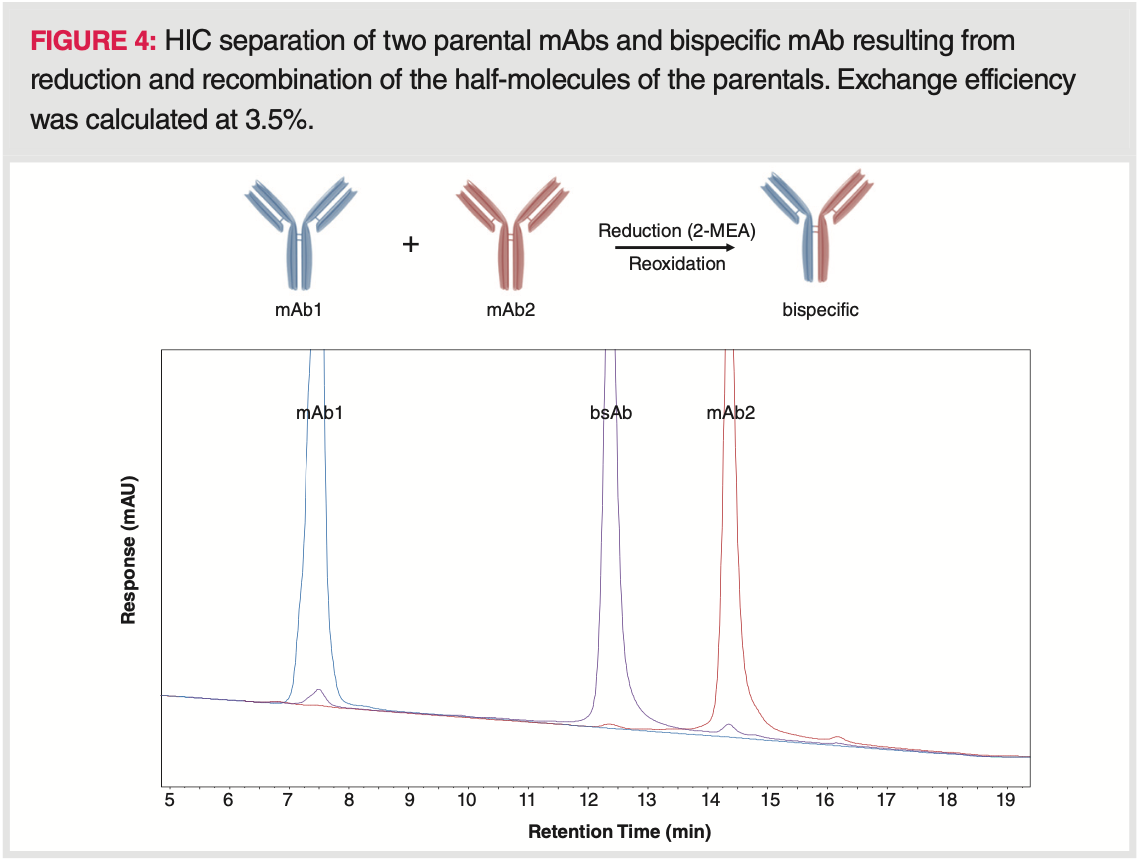
BsAbs are composed of fragments of two different mAbs (mAbA and mAbB) and therefore bind to two different types of antigens. If the parental antibodies show significant differences in charge and/or hydrophobicity, the heterodimerization efficiency of the bsAb can be evaluated by chromatographic techniques (15,16). In HIC, the bsAb peak elutes between that of parental antibodies. Residual parental mAb content and the distribution of mAbA, mAbB, and bsAb species can be determined on the basis of peak area percentages as illustrated in Figure 4. Recently, an interesting combination of peptide mapping and HIC has been developed to quantify succinimide in bsAbs (25). Deamidation product, unmodified bsAb, and succinimide were efficiently separated and the method was applied in a quality controlled environment for release and stability testing studies.
2D-LC Applications of HIC
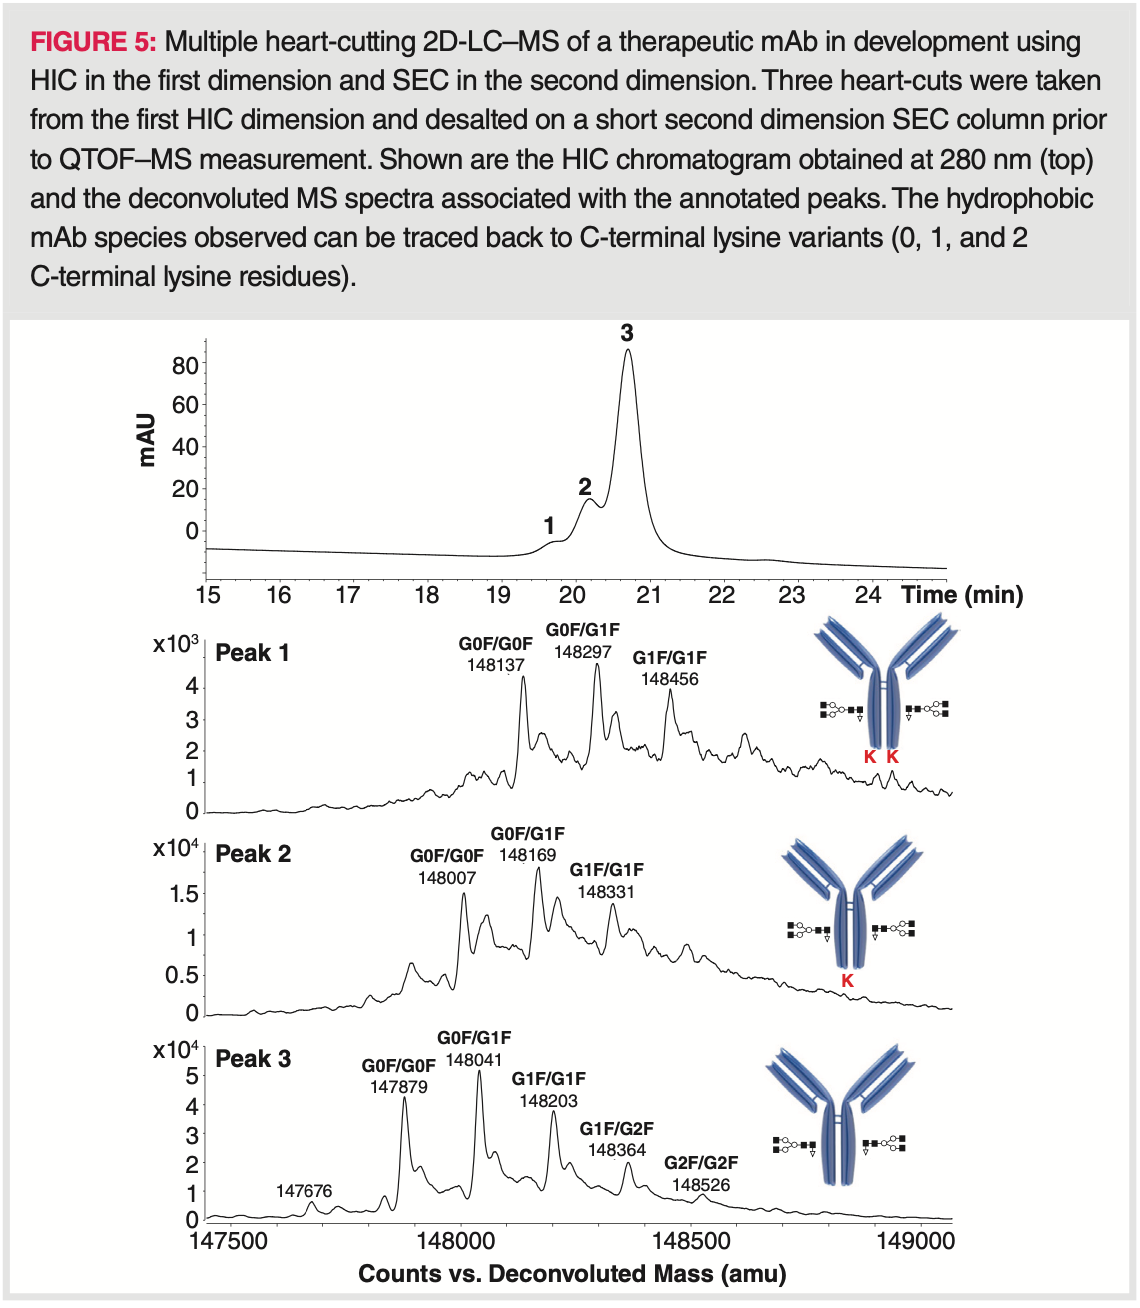
Two‐dimensional liquid chromatography (2D‐LC) is a powerful technique for mAb and ADC characterization, since it enables the hyphenation of a non‐mass spectrometry (MS)‐compatible chromatographic mode (for example, HIC as the first dimension) to MS instrumentation, via a suitable interface (such as by using RPLC or size‐exclusion chromatography [SEC] as a desalting step prior to MS) (Figure 5) (1). In addition, such setup improves peak capacity too and therefore increases peak resolution. One of the very first 2D‐LC applications of HIC was developed by Birdsall et al. who showed the potential of an on‐line HIC‐RPLC–MS setup for the characterization of isoforms of cysteine‐conjugated ADCs (26). The methodology was tested using an IgG1 mAb modified by cysteine conjugation with a non‐toxic drug mimic. Structural elucidation of peaks observed in the HIC analysis (first dimension) were successfully identified based on their unique sub‐unit masses via MS techniques once dissociation occurred under denaturing reversed‐phase conditions (second dimension).
A comprehensive on‐line HIC×RPLC–MS method was also successfully developed and applied to obtain important information on drug load profile and structural information on positional isomers of DARs of a commercial cysteine‐linked ADC (27). The method was applied for stability studies and confirmed that odd DAR species can be produced by heat stress.
Another comprehensive 2D‐LC approach was based on the combination of HIC and SEC (HIC×SEC), as coupled to ion mobility spectrometry and mass spectrometry (IM–MS) for the analytical characterization of ADCs under non‐denaturing conditions (28). The DAR species were separated in the HIC phase while the SEC dimension was used as desalting process. The role of the SEC dimension was simply to separate HIC salts from ADC species and to direct the HIC salts towards the waste. With this setup, all fractions eluted from the SEC column could be continuously infused into the electrospray ionization (ESI) source, followed by ion‐mobility spectrometry (IMS) and MS dimensions.
The loops in a heart‐cutting system can be replaced by a HIC phase. In such a 2D‐LC system, HIC can work as a capture phase between Protein A and SEC separation for mAb analysis (29).
On‐line coupling of HIC with RPLC and charged aerosol detector (CAD) and MS was performed to characterize polysorbates in therapeutic protein formulations (30). Polysorbates are complex mixtures of over a thousand components possessing a wide range of hydrophobicity. This online 2D setup was used to evaluate the heterogeneity and stability of polysorbates. Adding a low concentration of formic acid and organic solvent in the mobile phase, enabled the use of the HIC column to separate small molecule excipients (including major components of polysorbates) and the large protein molecules by a mixed mechanism. The protein and the charged excipients, which eluted early from the HIC column, were directed to the waste, while the polysorbates and other neutral excipients, which eluted later from the HIC column, were directed to the RPLC column for further separation and analysis.
HIC–MS
HIC is inherently incompatible with MS because of the significant amount of salts used in the mobile phase. However, fraction collection and off‐line connection is feasible or on‐line 2D‐LC–MS making use of desalting in the second dimension (see above). Debaene et al. applied HIC for off‐line native MS characterization of a commercial ADC (31). HIC fractions have been collected, desalted, and then analyzed by IMS and native MS. Conventional HIC provides good separation of proteins under non‐denaturing conditions, but requires high concentrations of nonvolatile salts. Therefore, a new strategy has been proposed, to increase the retentivity of the HIC column (pentyl‐, hexyl‐, and heptyl-phases were developed), while decreasing salt concentration—and preferentially use ammonium acetate instead of ammonium sulfate—and also to add about 50% organic modifier into the mobile phase (32).
This way the highly retentive column can be directly coupled to MS. This methodology is probably a hybrid form of conventional HIC and RPLC. The salt seemed to preserve protein structure rather than promoting only retention (according to the authors). This approach has been applied for top‐down proteomics and intact mAb characterization (33).
Conclusion
HIC is a reference method to separate the hydrophobic variants of protein species. In most HIC separations, the same (historical) conditions are usually applied (such as a 1.5–2 M ammonium‐sulfate buffer at pH 6–7 for the mobile phase with a butyl stationary phase), although many other options and conditions can be used that could improve the quality of the separation. For example, using salt mixtures instead of a single (mono) salt, working at a pH less than 6 or using phenyl‐, amide‐, or pentyl stationary phases could all have an impact on the overall quality of the separation in terms of selectivity, peak width, analysis time, and so on. This article has reviewed these possibilities hoping that chromatographers will benefit from them. In addition, a systematic method development scheme was also provided, which can significantly decrease the time spent on method optimization. Finally, some common and recent applications have been presented including uni‐ and multi‐dimensional (2D) separations. Possibilities of coupling HIC to MS detection were also reviewed.
References
1) S. Fekete, J.L. Veuthey, A. Beck, and D. Guillarme, J. Pharm. Biomed. Anal. 130, 3–18 (2016).
2) A. Cusumano, D. Guillarme, A. Beck, and S. Fekete, J. Pharm. Biomed. Anal. 121, 161–173 (2016).
3) S. Fekete, A. Murisier, K. Sandra, and D. Guillarme, LCGC Europe 34(3), 101–105 (2021).
4) A. Werner and H. Hasse, J. Chromatogr. A. 1315, 135–144 (2013).
5) E. Müller, J. Vajda, D. Josic, T. Schröder, R. Dabre, and T. Frey, J. Sep. Sci. 36(8), 1327–1334 (2013).
6) Z.E. Rassi, L.F. de Ocampo, and M.D. Bacolod, J. Chromatogr. A. 499, 141–152 (1990).
7) E. Hackemann and H. Hasse, J. Chromatogr. A. 1521, 73–79 (2017).
8) J.T. McCue, Methods Enzymol. 463, 405–414 (2009).
9) J. Porath and B. Larsson, J. Chromatogr. 155, 47–68 (1978).
10) S. Fekete, J.-L. Veuthey, and D. Guillarme, LCGC Europe 28(s10), 8–15 (2015).
11) S. Fekete, I. Molnár, and D. Guillarme, J. Pharm. Biomed. Anal. 137, 60–69 (2017).
12) B. Wiggins, L. Liu-Shin, H. Yamaguchi, and G. Ratnaswamy, J. Pharm. Sci. 104(4), 1362–1372 (2015).
13) D. Boyd, T. Kaschak, and B. Ya, J. Chromatogr. B. 879, 955–960 (2011).
14) J.V. Douglass, A. Wallace, and A. Balland, J. Chromatogr. A. 1214, 81–89 (2008).
15) S. Paul, J. Connor, T. Nesspor, P. Haytko, K. Boakye, M.L. Chiu, and H. Jiang, Exp. Rev. Proteom. 121, 133–140 (2016).
16) A.F. Labrijn, J.I. Meesters, P. Priem, R.N. de Jong, E.T.J. van den Bremer, M.D. van Kampen, A.F. Gerritsen, J. Schuurman, and P.W.H.I. Parren, Nat. Protoc. 9(10), 2450–2463 (2014).
17) L.N. Le, J.M. Moore, J. Ouyang, X. Chen, M.D. Nguyen, and W.J. Galush, Anal. Chem. 84(17), 7479–7486 (2012).
18) J. Ouyang, in Methods in Molecular Biology: Antibody-Drug Conjugates, 1045, L. Ducry Ed. (Humana Press, New Jersey, USA, 2013).
19) K.J. Hamblett, P.D. Senter, D.F. Chace, M.M.C. Sun, J. Lenox, C.G. Cerveny, K.M. Kissler, S.X. Bernhardt, A.K. Kopcha, R.F. Zabinski, D.L. Meyer, and J.A. Francisco, Clin. Cancer Res. 10(20), 7063–7070 (2004).
20) B. Bobaly, A. Beck, J.L. Veuthey, D. Guillarme, and S. Fekete, J. Pharm. Biomed. Anal. 131, 124–132 (2016).
21) B. Bobaly, G.M. Randazzo, S. Rudaz, D. Guillarme, and S. Fekete, J. Chromatogr. A. 1481, 82–91 (2017).
22) T. Janaratne, X.C. Wang, C. Becker, Y. Zhao, R. Leanna, and W. Pritts, J. Pharm.
Biomed. Anal. 179, 113027 (2020).
23) A. Goyon, V. D’Atri, B. Bobaly, E. Wagner-Rousset, A. Beck, S. Fekete, and D. Guillarme, J. Chromatogr. B. 1058, 73–84 (2017).
24) https://theanalyticalscientist.com/app- notes/analysis-of-oxidised-monoclonal- antibodies-using-biopro-hic-bf
25) M. Cao, S.H.R. Mulagapati, B. Vemulapalli, J. Wang, S.V. Saveliev, M. Urh, A. Hunter, and D. Liu, Anal. Biochem. 566, 151–159 (2019).
26) R. Birdsall, H. Shion, F.W. Kotch, A. Xu, T.J. Porter, and W. Chen, mAbs 7(6), 1036–1044 (2015).
27) M. Sarrut, A. Corgier, S. Fekete, D. Guillarme, D. Lascoux, M.C. Janin-Bussat, A. Beck, and S. Heinisch, J. Chromatogr. B. 1032, 103–111 (2016).
28) A. Ehkirch, V. D’Atri, F. Rouviere, O. Hernandez- Alba, A. Goyon, O. Colas, M.Sarrut, A. Beck, D. Guillarme, S. Heinisch, and S. Cianferani, Anal. Chem. 90(3), 1578–1586 (2018).
29) L. Wang, H.K. Trang, J. Desai, Z.D. Dunn, D.D. Richardson, and R.K. Marcus, Anal. Chim. Acta 1098, 190–200 (2020).
30) Y. He, P. Brown, M.R.B. Piatchek, J.A. Carroll, and M.T. Jones, J. Chromatogr. A. 1586, 72–81 (2019).
31) F. Debaene, A. Boeuf, E.W. Rousset, O. Colas, D. Ayoub, N. Corvaia, A.V. Dorsselaer, A. Beck, and S. Cianférani, Anal. Chem. 86(21), 10674–10683 (2014).
32) B. Chen, Y. Peng, S.G. Valeja, L. Xiu, A.J. Alpert, and Y. Ge, Anal. Chem. 88(3), 1885–1891 (2016).
33) B. Chen, Z. Lin, A.J. Alpert, C. Fu, Q. Zhang, W.A. Pritts, and Y. Ge, Anal. Chem. 90(12), 7135–7138 (2018).
AUTHORS
Szabolcs Fekete is a Scientific Collaborator at the University of Geneva, Switzerland, in the Analytical Pharmaceutical Chemistry group. He was the awardee of the LCGC Emerging Leader Award in Chromatography in 2020. Amarande Murisier is a PhD student at the University of Geneva, in Switzerland. Her PhD thesis focuses on novel chromatographic and electrophoretic techniques for the analysis of therapeutic proteins in the group of Jean-Luc Veuthey and Davy Guillarme. Liesa Verscheure is an Associate Scientist at RIC group (Kortrijk, Belgium) and industrial PhD student at Ghent University (Ghent, Belgium). Davy Guillarme is a Senior Lecturer and Research Associate at the University of Geneva, in Switzerland. He is also an editorial board member of LCGC Europe. Koen Sandra is the editor of “Biopharmaceutical Perspectives”. He is CEO at RIC group (Kortrijk, Belgium) and Visiting Professor at Ghent University (Ghent, Belgium). He is also a member of LCGC Europe’s editorial advisory board. Direct correspondence to: amatheson@mjhlifesciences.com




New Study Reviews Chromatography Methods for Flavonoid Analysis
April 21st 2025Flavonoids are widely used metabolites that carry out various functions in different industries, such as food and cosmetics. Detecting, separating, and quantifying them in fruit species can be a complicated process.
New Study Reviews Chromatography Methods for Flavonoid Analysis
April 21st 2025Flavonoids are widely used metabolites that carry out various functions in different industries, such as food and cosmetics. Detecting, separating, and quantifying them in fruit species can be a complicated process.

.png&w=3840&q=75)

.png&w=3840&q=75)


.png&w=3840&q=75)


.png&w=3840&q=75)