Green Chromatography (Part 1): Introduction and Liquid Chromatography
LCGC Europe
Part one focusses on ways of reducing and replacing solvents commonly used as mobile phases
Green chemistry is an overarching philosophy of chemistry defined by a set of 12 principles introduced by Anastas and Warner.1 The principles can be applied to organic chemistry, inorganic chemistry, biochemistry, physical chemistry and analytical chemistry. In all disciplines, the focus is on minimizing the risks and maximizing the efficiency of any chemical process. Green chemistry seeks to reduce and, ideally, eliminate pollution at its source to protect human health.
In the last ten years, green chemistry has gained momentum: many universities created green-chemistry curricula; symposia were organized on green chemistry and green engineering all over the world; and journals and websites dedicated to this topic were launched.
Moreover, this momentum was not only occuring in academia but also in industrial and pharmaceutical environments (e.g., the Pfizer Analytical Green Chemistry Network).2
The relationship between green chemistry and analytical chemistry is two-fold. On the one hand, analytical chemistry is by definition 'green' as it can measure the greenness of a chemical product or technology, the environmental pollution of a chemical process, the consequences of chemicals on health and so on. On the other hand, analytical chemistry is also a target for green chemistry (alongside other areas of chemistry) because several of its principles apply to analytical chemistry (e.g., the use of hazardous solvents in chromatographic analysis and in sample preparation methods).
Important in the discussion of green analytical chemistry, a term coined by J. Namiesnik at the end of the nineties,3,4 is its definition. At present, the definition of L.H. Lawrence5 is the most comprehensive one: "the use of analytical chemistry techniques and methodologies that reduce or eliminate solvents, reagents, preservatives and other chemicals that are hazardous to human health or the environment and that may also enable faster and more energy-efficient analyses without compromising performance criteria." The latter prerequisite is often the bottleneck in translating existing methods to green methods.
We also have to state that 'thinking green' in analytical chemistry is not always straightforward. We often receive remarks during presentations on green chromatography that what is considered green is actually not green and vice versa. Consider the following examples:
(i) Water as a mobile phase in LC. Aqueous waste streams are more difficult to clean than organic waste streams.
(ii) Replacing acetonitrile with biodegradable ethanol. Some sources indicate that acetonitrile, ranked by the EPA as a hazardous solvent, produces NO2 by incineration (jointly reponsible for acid rain) while other sources claim that NO2 is not formed. Note, however, that the production of LC-grade acetonitrile, a by-product of the synthesis of acrylonitrile needs much more energy than the production of pure ethanol.
(iii) Using CO2 as the mobile phase. Highly appreciated in green chromatography (sub- and supercritical fluid chromatography) but carbon dioxide is also linked to global warming.
We do not want to go into these controversial discussions in this series of articles and would simply prefer to describe approaches that are generally accepted as less harmful to the environment.
Part 1 of the series discusses reducing solvent usage or switching to benign solvents in liquid chromatography (LC). Part 2 will mainly concentrate on gas chromatography (GC) and supercritical fluid chromatography (SFC), both, by definition, greener than LC. Part 3 will present and discuss the features of green sample pretreatment techniques, that are often much more productive and cost-effective than classical enrichment/fractionation methods.
Reducing the Internal Diameter of LC Columns
In the last year, because of the shortage and high price of acetonitrile, we have been overloaded with documentation, leaflets, e-mails and so on from the different instrument manufacturers and column suppliers on how to reduce the consumption of acetonitrile. The emphasis here was on practical and economical reasons, rather than on ecological ones.
Acetonitrile is by far the most used solvent in LC because of its reputed unique characteristics such as dissolving a wide range of solutes, low acidity, minimal chemical reactivity, low UV cut-off and MS compatibility. Reducing acetonitrile consumption is by far the first option in greening LC but the principles in doing so also apply to other organic solvents and additives. As an example, replacing the additive trifluoro-acetic acid (TFA) which is cytotoxic, corrosive and persistent in the environment with formic acid which has low toxicity and decomposes to CO2 and H2O.
One analytical LC instrument, equipped with a conventional LC column (15 to 25 cm in length, 4.6 mm i.d. packed with 5 μm particles) operated at the commonly used flow rate of 1 mL/min, generates, upon continuous operation, nearly 1.5 L solvent each day which is approximatley 500 L solvent in a year, of which typically 50% is organic solvent, in most cases acetonitrile. This is enormous and strategies to reduce the consumption of LC solvents are being actively pursued.
Relevant column-related parameters towards a lower solvent consumption include reduction of the internal diameter and, using shorter column lengths and smaller particles.
An obvious way to reduce solvent consumption without losing efficiency is to reduce the flow rate. Longstanding theory shows that, at least in LC, the efficiency (N) of the column is independent of the internal diameter (Equation 1). This is in contrast with gas chromatography where the separation is improved by reducing the internal diameter. In LC, N is dependent upon the length of the column (L) and the particle size (dp).

The maximum plate number is obtained at the optimal velocity (uopt) and, when the internal diameter of the column is reduced, the flow rate has to be down-scaled by a factor (F) according to Equation 2 to work at uopt.

Upon switching from a 4.6 mm i.d. column to an identical 2.1 mm i.d. column, F equals 4.8. Knowing that a 4.6 mm column is typically operated at 1 mL/min, the 2.1 mm column should be operated at 0.21 mL/min. A major advantage that evidently arises is the reduced solvent consumption with a factor of 4.8 without compromising separation. Switching from a 4.6 mm i.d. to a 2.1 mm column is no problem on state-of-the-art LC instrumentation, although analysis times can increase slightly due to the gradient delay caused by the volume of both the pump and injector. Reduction of the internal diameter is often accompanied with an increase in sensitivity. This is a direct consequence of the reduced dilution of the solutes in the mobile phase and the appearance of more concentrated bands at the detector. This sensitivity gain is typically experienced with UV, fluorescence and electrospray ionization mass spectrometry (ESI-MS), which are concentration sensitive. The increase in sensitivity for UV and fluorescence is equal to the down-scaling factor F. Examples of extreme down scaling are shown in Figure 1.
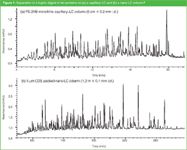
Figure 1
A tryptic digest of 10 proteins was analysed on (a) a 5 cm × 0.2 mm i.d. PS-DVB monolithic capillary column operated at 2.5 μL/min (total mobile phase volume 55 μL) and on (b) a 1.2 m × 0.1 mm i.d. packed with 5 μm ODS particles and operated at 450 nL/min (total mobile phase volume 135 μL).6 The mobile phase consisted of acetonitrile, water, TFA. Detailed experimental conditions can be found in reference 6. Note the long analysis time on the second column. For most applications and definitely in a QA/QC environment such analysis times are unacceptable. In the omics field, however, analysis time and thus solvent consumption can be related to the obtained information in a certain time interval. The second column, because of its high peak capacity, enabled the identification of more proteins. The more information obtained in a given time, the greener the method is.
Note that the green character of these miniaturizations is only valid when micro- and nanolitre pumps are used. High volume pumps operated in the split-flow mode are not green in this respect (see further). Capillary and nano-LC are typically used in the bio-field (e.g., proteomics) because in addition to high efficiency, very high sensitivity is obtained for small sample sizes due to the concentration-sensitive nature of nanospray-ESI-MS. Other examples of extreme down-scaling in LC can be found in the literature (e.g., Smith et al.7 and Karger et al.8).
Capillary- and nano-LC have further developed into chip-based microfluidic systems in which injection, sample concentration, separation and electrospray-needle are integrated.
A classification of LC techniques according to the internal diameter and the impact on the flow rate, and, therefore, solvent consumption and sensitivity is presented in Table 1.
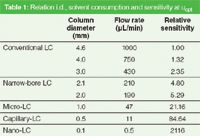
Table 1: Relation i.d., solvent consumption and sensitivity at uopt
A reduction of the solvent consumption by column miniaturization requires instrument adjustments. Extra-column volumes must be minimized, accordingly to control pre- and post-column band broadening. These include the injector and detector cell volume and the volumes of all connections between the injector and detector. In principle, the down-scaling factor applies here as well. Down-scaling from a 4.6 mm column to a 2.1 mm column can readily be achieved without major instrumental adaptations.
However, one has to realize that a gradient delay is to be expected. Further down-scaling requires a more thorough rewiring. While a 20 cm tubing with an internal diameter of 0.17 mm and a volume of 4.54 μL is ideally suited to connect a 4.6 mm column to a detector, it will induce peak broadening when using a 1 mm column. When working in gradient mode, pre-column dead volumes are less of an issue because one can generally benefit from on-column focusing due to the weak-eluting power of the initial mobile phase conditions. In isocratic mode, pre-column volumes should be carefully evaluated as well.
Note that at present, 1 mm i.d. columns are seldom used. As well as instrument requirements, 1 mm i.d. columns commonly exhibit lower plate numbers compared with similar columns in terms of length and particle size. Apparently, packing 1 mm i.d. columns is more difficult and challenging than larger i.d. columns and Equation 1 is not respected.
Apart from the extra-column volumes, the pumps themselves should be adapted. There is not a single pump available covering the flow rate range of nL/min (nano-LC) till mL/min (conventional-LC). Standard LC pumps successfully work from 50 μL/min to 5 mL/min. While 4.6 mm, 2.1 mm and to a lesser extent 1 mm columns can be operated using the same pump, sub-mm columns require a different pump or the use of flow splitting. Instrument vendors opt for both approaches. While a number of vendors cover the mid μL/min–mid nL/min range making use of splitters, others deliver these flows without splitting. As mentioned before, the former can no longer be considered as green chromatography given the fact that the majority of the mobile phase is diverted to the waste.
Reducing the Particle Size in LC Columns
Another option to decrease solvent consumption is by increasing the 'chromatographic productivity'. This is generally achieved by reducing the particle size in combination with shortening the column length. From Equation 1 it can be derived that a column with 5 μm particles and 15 cm in length should give approximately 15000 theoretical plates. When using sub-2 μm particles, a column length of 5 cm is sufficient to obtain the same number of plates. As the column length is reduced by a factor of three, analysis time is, in the first instance, reduced by the same factor. However, efficiency versus mobile phase velocity curves for sub-2 μm columns are flat and high flow rates can be applied without losing efficiency.
Choosing sub-2 μm particles comes with instrumental adaptations. A major downside of smaller particles is the column-pressure increase. When the particle size is halved, pressure goes up by a factor of four. In the example discussed before, switching from a 15 cm × 2.1 mm i.d. × 5 μm dp column to a 5 cm × 2.1 mm i.d. × 1.8 μm dp column operated at a flow rate three times higher results in approximately an eight-fold increase in back-pressure. Instrumentation has to be capable of operating at higher pressures. A variety of ultra-high pressure LC (UHPLC) systems are currently on the market and are gradually replacing more conventional LC instrumentation.
The interplay of particle size and pressure on chromatographic productivity is best illustrated by means of kinetic plots. We refer the reader to some recent publications for detailed information.9,10 Typical kinetic plots are shown in Figure 2.
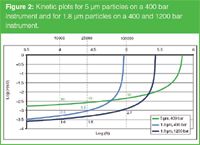
Figure 2
In the plots speed of analysis for conventional 5 μm and 1.8 μm particles for a 400 bar instrument are compared with 1.8 μm particles on a 1200 bar instrument. The x-scale represents the log N and the y-scale the analysis time. Above the plots, we arbitrary selected separations for which 10000 plates (high throughput), 25000 plates (high productivity) and 100000 plates (high resolution) are needed. For the high throughput separations, relative analysis times will be 10 (5 μm at 400 bar), 2.5 (1.8 μm at 400 bar) and 1.6 (1.8 μm at 1200 bar). This means that the same analysis is six times faster on the 1.8 μm (1200 bar) than on the 5 μm (400 bar) column. A factor of 5 is noted for 25000 plates and a factor of 4 for 100000 plates. Note that 100000 plates can never be reached with 1.8 μm particles on a 400 bar instrument. Obviously high plate numbers means long analysis times and thus huge amounts of solvent.
High throughput analysis for the determination of antioxidants in vegetable oils (European Parliament and Council Directive No. 95/2/EC — 1995) is illustrated in Figure 3.
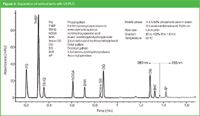
Figure 3
All antioxidants included in the EC directive are separated in less than 2 min on a C18, 5 cm × 2.1 mm i.d., 1.8 μm dp column operated at 1070 bar and 45 °C (see further). Total solvent consumption was 3.8 mL (flow 1.9 mL/min). The same analysis on a 15 cm × 4.6 mm i.d., 5 μm dp particles was 18 min with 18 mL solvent consumption.11
It is important to note — and this is often misleading in leaflets by instrument and column manufacturers when they describe solvent savings exceeding 90% — this result is a combination of reduced particle size and reduced internal diameter.
Another point of discussion is the speed of analysis! Speed of analysis is often confused with solvent saving. Figure 4 shows the optimized analysis of an active pharmaceutical ingredient (metoclopramide) and its impurities on a sub-2 μm particle column. Because uopt spans a broad range (efficiency versus mobile phase velocity curve is flat), the mobile phase flow can be increased from 0.22 to 0.66 mL/min to speed up the analysis (a to b). However, in both analyses the solvent consumption is approximately 3 mL. Note that at high pressure (1020 bar) selectivity changes occur because of frictional heating12 and the temperature had to be decreased to obtain the same separation (c). Nevertheless, according to the definition of green analytical chemistry by L.H. Lawrence "more energy efficient" can be an argument here.
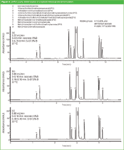
Figure 4
Operating at Elevated Temperature
Temperature is a powerful variable in LC to tune speed, selectivity, efficiency and detectability.13 By operating at higher temperature, the viscosity of the mobile phase decreases and diffusion in the mobile phase becomes faster. The consequences are illustrated in Figure 5 showing the kinetic plots for the 1.8 μm column installed on a 1200 bar LC system operated at 30 °C and 80 °C. Analysis times are further reduced with a factor of about 2.
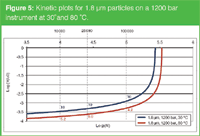
Figure 5
If speed is not important and the analysis time at ambient temperature is acceptable, the amount of organic modifier in the mobile phase can be reduced significantly and, in some cases, be eliminated completely resulting in pure aqueous mobile phases.14 The eluotropic strength of water in reversed-phase LC increases drastically as a function of temperature and at 200 °C is close to that of acetonitrile at ambient temperature.
In Figure 6, the influence of the temperature and flow rate on the separation of seven phenylurea pesticides on a 5 cm × 2.1 mm i.d., 1.8 μm dp column is shown. At 40 °C and a flow rate of 0.35 mL/min (a), all compounds elute within 11.5 min with the mobile phase acetonitrile/water (30:70). At 80 °C (b), the analysis time is reduced to about 5 min (less than half mobile phase consumption) while the selectivity for compounds 4 and 5 is significantly enhanced. Elevated temperature also allows the use of higher flow rates without losing efficiency.13 The flow rate was increased to 0.85 mL/min (c) leading to an analysis time of 2 min (about 1/5 of the initial analysis time). In the latter case the solvent consumption is the same as at 0.35 mL/min and 80 °C.
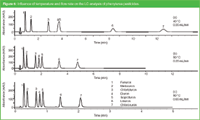
Figure 6
The reduced backpressure at elevated temperature also enables the replacement of acetonitrile or methanol with the more viscous ethanol. Figure 7 shows the analysis of amines on a cyanopropyl column (15 cm × 3 mm i.d., 3.5 μm dp) at 80 °C and a flow rate of 1.2 mL/min. The mobile phase was a gradient of water/ethanol from 90:10 to 40:60 in 10 min. An LC instrument with a pressure limit of 400 bar was used.

Figure 7
A special case of elevated temperature LC is temperature responsive LC (TRLC) pioneered by the group of Okano et al.15 The temperature responsive aspect of polymers such as poly-N-isopropylacrylamide (PNIPAAm) have been successfully exploited as stationary phases in LC. The change in hydrophobicity of the polymer as a function of the temperature allows control of the retention and separation using only water as mobile phase.16 Above the lower critical solution temperature (LCST), similar elution profiles are obtained as in conventional reversed phase LC, but without the need for environmentally harmful organic modifiers in the mobile phase. We recently described the synthesis and characteristics of thermoresponsive poly(N-vinylcaprolactam) as stationary phase for aqueous and green (water/ethanol) liquid chromatography.17
Switching to Benign Solvents and Additives
Most of the mobile phases used today consist of acetonitrile/water or methanol/water mixtures. Acetonitrile and methanol have indeed many properties that are favourable for LC use (i.e., complete miscibility with water, excellent UV transmission, low viscosity of aqueous solutions, available in high purity and low reactivity). According to the green solvent selection guide,18 water, acetone, ethanol and methanol can be considered environmentally friendly for LC applications.
Methanol should thus be selected over acetonitrile whenever possible. Both methanol and acetonitrile show some toxicity but of utmost importance in green chemistry is that the disposal of both mobile phase ingredients requires special waste treatment steps. High disposal costs are especially valid for acetonitrile (detoxification of HCN, NO2 formation, etc.). However, in practice, replacing acetonitrile by methanol is not straightforward as selectivity changes will occur, which hinders a more general use of methanol. This, however, is a question of method development. For validated methods, it makes no sense to replace acetonitrile with water/acetone or water/ethanol. Reduction of the internal diameter and/or the application of smaller particles/shorter column lengths is advised. For methods to be developed, selection of methanol or another green solvent should be considered.
Ethanol has been intensively used in the early days of LC. It has similar characteristics as acetonitrile and methanol with the additional favourable characteristic of low volatility rendering the mobile phase composition more stable upon long storage, much lower toxicity and cheap disposal costs (biodegradable). Negative factors of ethanol are the high viscosity of ethanol/water solutions and ethanol control regulations rendering routine use of ethanol complicated and problematic. With the advent of LC instrumentation with pressures up to 1200 bar, viscosity issues are no longer of concern. This is illustrated in Figure 8 showing the analysis of 5-methoxypsoralen (5-MOP) in a lemon oil sample used in the cosmetic industry on a sub-2 μm column. The International Agency for Research on Cancer (IARC) has classified 5-MOP when combined with UV radiation as probably carcinogenic to humans. Compared with acetonitrile and methanol as organic constituents of the mobile phase, the back pressure using ethanol increased to 770 bar compared with 440 bar for acetonitrile and 590 bar for methanol. In this particular case, the selectivity with ethanol (c) for the separation of 5-MOP from the preceding large peak was far better compared with methanol (b) and acetonitrile (a).
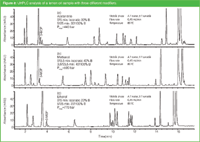
Figure 8
Acetone has excellent solubilizing characteristics and is fully miscible with a wide range of solvent classes, including water. Acetone is seldom used in LC mainly because it is a strong UV absorber in the region up to 340 nm. Acetone is, however, chromatographically acceptable when universal detection is used such as refractive index detection (RID), evaporative light scattering detection (ELSD), corona discharge detection (CAD) and mass spectrometry (MS). A typical example is the analysis of sugars on an aminopropyl column with RID detection using acetone as the main mobile phase ingredient. Recently, acetone was proposed as an alternative to acetonitrile in LC–MS analysis of peptides.19 Acetone was superior to methanol for most of the tested model proteins reaching similar sequence coverage and number of identified peptides as acetonitrile.
During the acetonitrile shortage, we translated several LC methods using water/acetonitrile gradients into methods with a water/ethanol or water/acetone gradient. A typical example is shown in Figure 9 for the determination of the impurities in metoclopramide, using the example discussed previously in Figure 4.
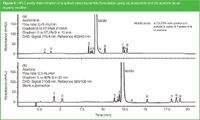
Figure 9
The standard method, according to the European Pharmacopoeia, is analysis by reversed-phase LC on octadecyl silica with a water/acetonitrile gradient at 275 nm [Figure 9(a)]. Complete separation, albeit with different selectivity, can be performed with a water/acetone gradient using MS detection. The application of RID, ELSD and CAD is not successful because the former detector does not allow gradient analysis while the CAD and ELSD sensitivity is problematic at the 0.05% impurity level. However, due to the fact that acetone has a UV minimum at about 210 nm, analysis can be performed at that wavelength in combination with baseline substraction [Figure 9(b)] or solvent compensation.20 In the latter method, a reversed gradient is added via a T-piece before the detector, so that the acetone concentration in the detector is constant.
At present, hydrophilic interaction chromatography (HILIC) is the preferred LC mode for the separation of polar and ionizable compounds. In HILIC, separation is primarily achieved by partitioning between a water-enriched layer on the surface of a polar stationary phase and a mobile phase that contains a high percentage of an organic solvent.21 Although several solvents have been evaluated in HILIC, acetonitrile is by far the most generic solvent. We recently described the use of ethanol mixed with CO2 in HILIC.22 In this enhanced fluidity mode (water/ethanol/CO2), the separation of the nucleobases could be performed with the same performance as using water/acetonitrile. The influence of CO2 is illustrated in Figure 10. Without CO2 (a) the separation is very poor while by adding 1.5 mL/min CO2 an excellent separation was obtained. The elution window could be further widened by increasing the CO2 flow to 2.5 mL/min (c). Note that in this application ammonium acetate at 20 mM was selected as the additive. This can be considered a green additive together with ammonia (if the mobile phase needs to be alkaline) or formic acid/acetic acid (if the mobile phase needs to be acidic). Moreover, these additives are much more MS-friendly compared with phosphate and borate buffers.
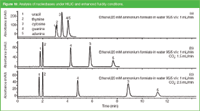
Figure 10
Reversing the mobile phase constituents in HILIC [i.e., high concentrations of water and low concentrations (or zero) of an organic constituent] is another alternative to make HILIC greener for the analysis of ionizable and polar compounds. The features of the aqueous reversed-phase technique called peraqueous liquid chromatography (PALC)23 is illustrated with the analysis of some amino acids without derivatization (a green approach!) on 2 × 25 cm × 4.6 mm i.d., 5 μm dp silica operated at a flow of 0.5 mL/min. Figure 11 compares the separation with 60% acetonitrile [i.e., pure HILIC mode (a) 30% acetonitrile (b)] and no acetonitrile [i.e., pure aqueous (c)]. It is clear that the best separation is obtained under pure aqueous conditions.
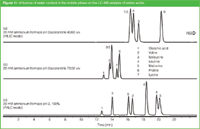
Figure 11
A similar retention mechanism was described by Pesek et al.24 on silica hydride columns. The authors named the method aqueous normal-phase LC.
Conclusion
The recent redesigning of the column parameters in combination with ultra high pressure and elevated temperatures has resulted in substantial solvent savings. Strategies discussed include a reduction of the internal diameter of the column and a productivity increase by selecting smaller particles and shorter columns. Upon combining these two features, huge solvent savings exceeding 90% may be expected. While a couple of years ago miniaturized columns and columns packed with small particles were merely considered as specialist research tools and unmature, they are currently attracting much attention and starting to find widespread use.
Several strategies have been described using benign solvents in LC. It is our belief that a large number of LC applications can be performed with water/ethanol(methanol)/CO2 and environmentally friendly additives such as ammonium acetate or formate, formic or acetic acid and ammonia. In Part 2 we will illustrate how a LC separation can be realized using a pre-selected mobile phase only composed of green ingredients in combination with stationary phase tuning.
Pat Sandra is director of the Research Institute for Chromatography (RIC), Kortrijk, Belgium, professor in Separation Science at the Ghent University, Belgium and director of the Pfizer Analytical Research Centre-UGent, Belgium.
Koen Sandra is R&D manager of Metablys, a research centre in Omics, Kortrijk, Belgium.
Alberto Pereira is a researcher specializing in fluid-based separation techniques (LC and SFC) at RIC, Kortrijk, Belgium.
Gerd Vanhoenacker is head of the LC and LC–MS division at RIC, Kortrijk, Belgium.
Frank David is R&D manager at RIC, Kortrijk, Belgium and visiting professor at the Ghent University, Belgium.
References.
1. P.T. Anastas and J.C. Warner, "Green Chemistry: Theory and Practice", Oxford University Press, New York, USA (1998) www.epa.gov/greenchemistry/pubs/principles.html
2. www.healthlinks-events-bpc2008.co.uk/presentations/13.30%20harding_mark.pdf
3. J. Namiesnik, Environ. Sci. Pollut. Res., 6, 243 (1999).
4. J. Namiesnik, J. Sep. Sci., 24, 151 (2001).
5. L.H. Lawrence, www.ChemistsHelpingChemists.org
6. K. Sandra et al., J. Chromatogr. B, 866, 48 (2008).
7. Y. Shen et al., Anal. Chem., 74, 4235 (2002).
8. G. Yue et al., Anal. Chem., 79, 938 (2007).
9. G. Desmet, D. Clicq and P. Gzil, Anal. Chem., 77, 4058 (2005).
10. U.D. Neue, LCGC Europe, 22(11), 570 (2009).
11. G. Vanhoenacker, F. David and P. Sandra, Agilent Technologies Application Note 5990-4378EN (2009).
12. A. de Villiers et al., J. Chromatogr. A., 1113, 84 (2006).
13. G. Vanhoenacker and P. Sandra, J. Sep. Sci., 29, 1822 (2006).
14. K. Hartonen and M.-L. Riekkola, Trends in Anal. Chem., 27, 1 (2008).
15. H. Kanazawa et al., Anal. Chem., 68, 100 (1996).
16. F. Lynen et al., Chromatographia, 66, 143 (2007).
17. B. Miserez et al., Chromatographia, 71, 1 (2010).
18. P.J. Dunn and D.A. Perry, Green Chemistry, 9, 31 (2008).
19. R. Fritz, W. Ruth and U. Kragl, Rapid Commun. Mass Spectrom., 23, 2139(2009).
20. A. de Villiers et al., J. Chromatogr. A, 1161, 183 (2007).
21. A. J. Alpert, J. Chromatogr., 499, 177 (1990).
22. A. Pereira et al., J. Sep. Sci., 33, 834 (2010).
23. A. Periera et al., J. Sep. Sci., 32, 2001 (2009).
24. J.J. Pesek et al., J. Chromatogr. A, 1216, 1140 (2009).
Polysorbate Quantification and Degradation Analysis via LC and Charged Aerosol Detection
April 9th 2025Scientists from ThermoFisher Scientific published a review article in the Journal of Chromatography A that provided an overview of HPLC analysis using charged aerosol detection can help with polysorbate quantification.
Removing Double-Stranded RNA Impurities Using Chromatography
April 8th 2025Researchers from Agency for Science, Technology and Research in Singapore recently published a review article exploring how chromatography can be used to remove double-stranded RNA impurities during mRNA therapeutics production.


