Gradient Elution, Part VI: Ghost Peaks
LCGC North America
Where do all those extra peaks come from?
Where do all those extra peaks come from?
This is the final installment in the recent series of "LC Troubleshooting" discussions on gradient elution (1–6). In the last two columns, we've considered problems related to gradients when we looked at dwell volume (5) and drift (6). This month, we'll look at what many users consider the nemesis of gradient elution — ghost peaks. Also referred to as artifact peaks, ghost peaks occur in gradients even when no sample is injected. That is, if you run the gradient program without cycling the sample injection valve, peaks often appear in the chromatogram. We'll look at two examples of such problems that have been resurrected from the archives of "LC Troubleshooting."
A Long Time Coming
I often refer to the "Rule of Three" as a guide to help us estimate what happens to retention time when we change the mobile-phase concentration in reversed-phase liquid chromatography (LC). The rule of three states that the retention factor, k, changes by approximately threefold for each 10% change in the organic solvent concentration (%B, usually acetonitrile or methanol). So, for example, if we had an analyte in our sample that normally was retained with k = 5 under isocratic conditions of 50% B, at 40% B, we would expect k ≈ 3 × 5 = 15. Another 10% change to 30% B would yield k ≈ 3 × 15 = 45. Similarly, 20% B would give k ≈ 135. We can convert this to retention time from the formula for k:

where tR is the retention time and t0 is the column dead time (retention time of the solvent front). Rearrange equation 1 to solve for the retention time:

For discussion purposes, let's assume we're using a 150 mm × 4.6 mm column operated at 2 mL/min. This will generate t0 ≈ 0.75 min. Now we can calculate retention times for each of our conditions. For k = 5, tR = 4.5 min; for k = 15, tR = 12 min; for k = 45, tR ≈ 35 min; and for k = 135, tR ≈ 102 min. So, you can see that by the time we reduce the mobile-phase concentration to 30% less than the starting concentration, at tR = 102 min the peak is so strongly retained, it is unlikely that we'll wait around for it to come off the column.
We've been looking at isocratic retention, but the same process will occur during gradient elution. Because many gradients start at very weak mobile-phase conditions (small %B), we would expect that many analytes would be very strongly retained under such conditions. This is the basis of on-column compression, a process whereby the sample becomes concentrated or held in a very narrow band at the inlet of the column when it is injected under very weak mobile phase conditions or is injected in a very weak injection solvent. Sometimes it is possible to inject a large-volume sample — for example, 5–10 mL — in a very weak injection solvent, such as water, and have the same chromatographic result as if we injected a much higher concentration of the sample in a few microliters. This can be a practical way to preconcentrate water-based samples when gradient elution is used.
So, we can see that on-column concentration can be a very useful analytical tool if we have very dilute samples. However, the LC column is not very clever — it can't tell the difference between peaks that originated from an intentionally injected sample and those that result from preconcentrating impurities from the starting, weak mobile phase. Peaks originating from contaminants in the weak component of the mobile phase (the A-solvent, generally water or buffer) are the most common source of ghost peaks in gradient elution.
Case Study 1, Dirty Water
The data for this case study were first presented in LCGC in 1996 (7), but similar problems occur daily in laboratories around the world. The method comprised a gradient of 5–83% B in 13 min, where A = 0.1% trifluoroacetic acid in water and B = acetonitrile. The separation was performed on a 150 mm × 4.6 mm C18 column packed with 5-μm diameter particles operated at 1.5 mL/min and 35 °C with ultraviolet (UV) detection at 255 nm. When a no-injection blank gradient was run, the results of Figure 1a were obtained. The specifications for high performance liquid chromatography (HPLC)–grade water and acetonitrile state that no peaks greater than 0.001 absorbance units (AU) should appear under similar conditions. Only the peak at tR ≈ 11.5 min exceeds these specifications. However, the method was for stability indication of a drug, and peaks of ~0.0005 AU = 0.5 mAU needed to be quantified, so the blank baseline obviously is not satisfactory for this method.
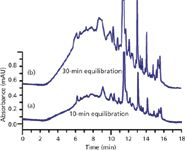
Figure 1: Isolation of the source of background peaks: (a) No-injection blank gradient with a 10-min equilibration between runs; (b) same as (a), but with a 30-min equilibration. See text for details. Adapted from reference 7.
We suspected that the water was the source of the problem. Our initial clue was that in the morning, the water faucet in the sink produced a slightly orange liquid, suggesting a rusty pipe feeding water to the laboratory. We used the principle of on-column concentration to confirm the source of the impurities. Instead of using the normal 10-min equilibration period between runs (Figure 1a), we increased this threefold to 30 min, with the results shown in Figure 1b. You can see that the peak sizes in Figure 1b increased by approximately the same amount compared to those observed in Figure 1a, confirming that the source of the problem was the A-solvent. The column was simply extracting the impurities in the water and holding them at the head of the column until a strong enough solvent was delivered during the gradient to elute them.
When trying to solve any LC-related problem, it is important to proceed in a systematic manner. I always like to remember to apply the "Rule of One" and the "Rule of Two." The rule of one reminds us to apply the scientific method and change just one thing at a time. We do this naturally for many things in the laboratory, but unfortunately we seem to forget it when we start to troubleshoot a problem. If we change several variables at once, it is difficult or impossible to definitively identify the root cause of the problem. The rule of two reminds us to make sure the problem is reproducible. By repeating each experiment, we can be sure we aren't trying to chase down a one-off, random occurrence.
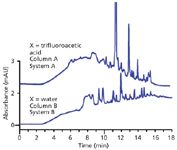
Figure 2: Further isolation of the problem in Figure 1. Top is repeat of Figure 1a; bottom trace obtained after eliminating trifluoroaceitic acid from the mobile phase and running a blank gradient on a different LC system with a different column installed. Adapted from reference 7.
Although we were fairly sure that the source of the present problem had to do with water quality, there were other potential sources, as well. Trifluoroacetic acid can age and generate spurious peaks in gradients. We were using helium sparging to degas the solvents, and possible contamination of the helium or sparging apparatus could have been the problem source. The operator, column, instrument, laboratory glassware, pipettes, and many other variables also were potential contributors to the contamination.
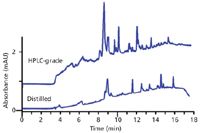
Figure 3: Comparisons of blank chromatograms from two water sources. Top, blank gradient for 0â83% acetonitrile over 13 min using contaminated water; bottom, same gradient with grocery-store-quality distilled water. Adapted from reference 7.
We systematically worked our way through potential problem sources, substituting new or known-good components for questionable ones or eliminating exposure to certain variables. As we expected, everything pointed to a problem with the water. This is shown for the lower trace in Figure 2, in which trifluoroacetic acid has been removed from the mobile phase and the method was run on a different HPLC system and column — most of the ghost peaks persist. But we had no other ready source of HPLC-grade water than our laboratory-generated water that originated from the contaminated tap water. For a quick check, we went to the local grocery store and bought a bottle of distilled water for comparison. The results are shown in Figure 3, where the top trace is a blank gradient of 0–83% acetonitrile–water run over 13 min using the questionable HPLC-grade water. The bottom trace is the same gradient, but using the grocery-store grade water. You can see that, although the grocery store water also has impurities, many of the peaks are different than the ones from the contaminated HPLC-grade water.
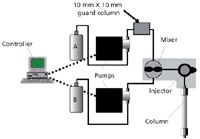
Figure 4: High-pressure-mixing LC system with scrubber column installed for A-solvent. See text for details.
Now that we had proof that the water was the problem source, we had to find a satisfactory solution. Our landlord was not willing to fix the faulty pipe, we didn't have the option of moving, and we didn't want to go to the expense of buying HPLC-grade water. The solution involved taking further advantage of on-column concentration. Our logic was that if we could extract the contaminants from the water on the head of the column during a normal gradient, why couldn't we remove them intentionally and not release them onto the analytical column. We were using a high-pressure-mixing LC system, in which the solvents are blended after the pumps. By inserting a C18 guard column between the A-pump and the mixer, we could strip off the contaminants using the guard column, and the resulting clean water was then mixed with acetonitrile from the B-pump, as shown in Figure 4. This procedure would work until the guard column became overloaded and spilled contaminants onto the analytical column. To increase the capacity of the guard column, we replaced it with a preparative guard column 10 mm in diameter and 10 mm long. We packed this with C18 material taken from an old analytical column. This device lasted for approximately two weeks before we needed to replace the packing or strip the contaminants from it using 100% acetonitrile. The setup in Figure 4 gave the results for the blank gradient shown at the bottom of Figure 5. It was not perfect, but the remaining ghost peaks were <1 mAU, so they did not compromise the analysis. This technique was used successfully until we moved to a new laboratory with better quality water. We still use it occasionally when the method requires extremely low-background baselines. It should be noted that the technique of Figure 4 will only work with high-pressure-mixing LC systems.
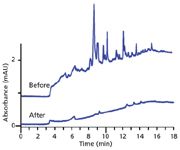
Figure 5: Comparison of blank gradient for 0â83% acetonitrile gradient using contaminated water before (top) and after (bottom) scrubbing with setup of Figure 4. Adapted from reference 7.
Case Study 2, pH Probe Contamination
The second example also comes from a previous "LC Troubleshooting" column (8). In this case, we had moved to a new laboratory and felt that our contaminated-water days were behind us. Then one day we were working on a method when the baseline of Figure 6a appeared. The method was run on a 150 mm × 4.6 mm C18 column at 1.5 mL/min and a gradient of 0–100% B over 15 min with a 5-min hold at 100% B, with UV detection at 215 nm. A buffer of 10 mM phosphate, pH 7, was used to prepare mobile-phase A (5:95 [v/v] acetonitrile–buffer) and B (80:20 [v/v] acetonitrile–buffer).
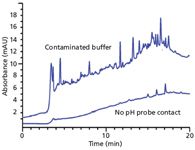
Figure 6: Comparison of blank gradients obtained by preparing buffer with exposure of bulk buffer to pH probe (top) and without exposure to pH probe (bottom). See text for details. Adapted from reference 8.
We used the same isolation technique illustrated in Figure 1 to verify that the A-solvent was the source of the problem. We systematically isolated several potential problem sources with no success. Four different sources of phosphate were checked and, although there were minor differences in background peaks, none could account for the majority of the ghost peaks. We checked our glassware for contaminants, as well as our solvent filtration apparatus, and degassing equipment — none of these were the problem source. Finally, we discovered that if we prepared the buffer by dipping the pH probe in the bulk buffer while adjusting the pH, the problem persisted, but if we took a small aliquot of buffer to check the pH, then discarded it so that the pH probe never contacted the bulk buffer solution, the chromatogram of Figure 6b was obtained. After checking the calibration buffers and other possible sources for contamination, we found that the potassium chloride filling solution for the pH probe was the source of the problem. The solution was simple — don't dip the pH probe in the bulk buffer.
Conclusions
On-column concentration can be a useful technique to enable you to load dilute samples on the column before analysis, but it can inadvertently concentrate contaminants from the aqueous component of the mobile phase. By using the isolation techniques discussed here, you can isolate the source of the problem if you take care and approach the problem in a stepwise fashion. Yes, ghost peaks in gradients are the nemesis of the chromatographer, and it is rare that they can be eliminated completely. However, by taking care to avoid obvious sources of contamination and using the contaminant-stripping process described above, you should be able to have usable gradient baselines under most situations. For more details on the two examples discussed here, consult references 7 and 8. For discussion of these and other gradient-related problems, reference 9 is an excellent resource.
References
(1) J.W. Dolan, LCGC North Am. 31(1), 30–35 (2013).
(2) J.W. Dolan, LCGC North Am. 31(3), 204–209 (2013).
(3) J.W. Dolan, LCGC North Am. 31(4), 300–305 (2013).
(4) J.W. Dolan, LCGC North Am. 31(5), 382–389 (2013).
(5) J.W. Dolan, LCGC North Am. 31(6), 456–463 (2013).
(6) J.W. Dolan, LCGC North Am. 31(7), 538–543 (2013).
(7) J.W. Dolan, J.R. Kern, and T. Culley, LCGC North Am. 14(3), 202–208 (1996).
(8) M.D. Nelson and J.W. Dolan, LCGC North Am. 16(11), 992–996 (1998).
(9) L.R. Snyder, J.J. Kirkland, and J.W. Dolan, Introduction to Modern Liquid Chromatography, 3rd. ed. (Wiley, Hoboken, New Jersey, 2010).
John W. Dolan "LC Troubleshooting" Editor John Dolan has been writing "LC Troubleshooting" for LCGC for more than 25 years. One of the industry's most respected professionals, John is currently the Vice President of and a principal instructor for LC Resources, Walnut Creek, California. He is also a member of LCGC's editorial advisory board. Direct correspondence about this column via e-mail to John.Dolan@LCResources.com

John W. Dolan

Understanding FDA Recommendations for N-Nitrosamine Impurity Levels
April 17th 2025We spoke with Josh Hoerner, general manager of Purisys, which specializes in a small volume custom synthesis and specialized controlled substance manufacturing, to gain his perspective on FDA’s recommendations for acceptable intake limits for N-nitrosamine impurities.


