Gradient Elution, Part V: Baseline Drift Problems
LCGC North America
Can anything be done to correct for baseline drift in gradient separations?
Can anything be done to correct for baseline drift in gradient separations?
This is the fifth "LC Troubleshooting" installment in a series focusing on gradient elution (1–4) in liquid chromatography (LC). Last month (4) we considered problems related to the system dwell volume. This month, we'll continue looking at gradient problems with a focus on baseline drift. If you're just moving from isocratic separations to gradients, one of the first observations you make when you examine a chromatogram is that the gradient baseline often is not flat. With both isocratic and gradient separations, the baseline can drift when the column temperature is not stable, but if you use a column oven and the laboratory temperature is relatively stable, this usually is not a problem. Drifting baselines under gradient conditions are common. Usually the drift is minor, and you learn to live with it. In other cases, it may be possible to compensate for the drift by adjusting the mobile phase. In still other cases, there isn't much you can do. Let's look at each of these cases next.
Mobile-Phase Absorbance
When ultraviolet (UV) absorbance is used for detection, it is common to find that the A and B mobile phases differ in their UV absorbance at the detection wavelength. This difference means that the baseline will drift during a gradient run, as is seen in the upper trace in Figure 1. In this case, a gradient is run from 100% water (A) to 100% methanol (B) at 215 nm. Because methanol has significantly stronger UV absorbance at 215 nm than water, the baseline rises — approximately 1 absorbance unit (AU) in this case. If the display setting is set to a range of <1 AU, the baseline will drift off scale during the run. This is inconvenient, but with many detectors today, the detector range is >1 AU, so peak data will still be collected, even though they do not appear on the computer monitor until the scale is changed. However, in the days of strip-chart recorders, before computerized data collection was used, an off-scale baseline or peak meant that no data were collected under those conditions. In any event, we would like to be able to see the entire chromatogram without having to change from one display scale to the next. For this reason, drift, such as that observed for methanol in Figure 1, is unacceptable for most of us. From a practical standpoint, methanol has sufficient absorbance at low wavelengths that full-range water–methanol gradients seldom are used below approximately 220 nm.

Figure 1: Baselines obtained from linear gradients of waterâmethanol at 215 nm and water-acetonitrile at 200 nm.
Contrast the plot for methanol at 215 nm with that for acetonitrile at 200 nm in Figure 1. The water–acetonitrile gradient baseline looks flat at the same display scale because acetonitrile has very low UV absorbance relative to water under these conditions. This is one reason why acetonitrile often is the preferred organic solvent when low-wavelength (<220 nm) UV detection is used.
Compensating for Drift
In the water–acetonitrile gradient of Figure 1, water and acetonitrile have approximately the same UV absorbance at 200 nm, so the baseline does not drift. It may be possible to create analogous conditions with other solvents by adjusting the absorbance of a solvent mixture used as the A and B solvents of the mobile phase. An example of this is shown in Figure 2, where 10 mM potassium phosphate (pH 2.8) is used instead of water as the A-solvent and methanol is used as B. Under these conditions, phosphate has nearly the same UV absorbance as methanol, so the baseline has very little drift. Note that the y-axis of Figure 2 is 0.1 AU full scale compared to 1 AU full scale in Figure 1, so the reduction in drift is impressive. From a practical standpoint we've solved the gradient drift by adding phosphate buffer to the A solvent. Because phosphate is such a common buffer for reversed-phase LC, its use means that methanol can be used as the B solvent at much lower wavelengths than when water is used as A.
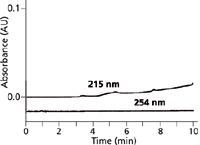
Figure 2: Baselines for phosphateâmethanol gradients of 5â100% B in 15 min at 215 and 254 nm. A: 10 mM potassium phosphate (pH 2.8); B: methanol. Adapted from reference 5.
Most organic solvents have lower UV absorbance as the detection wavelength is increased, so simply increasing the wavelength also may help to flatten out the baseline. For example, the lower plot of Figure 2 is under the same conditions as the upper one, but at 254 nm the baseline is flat. So even if we don't add a UV absorbing compound to the A solvent, simply increasing the detection wavelength may be a sufficient change to mitigate baseline drift. Of course, a reduction in sample response may also occur with an increase in detection wavelength, so making this change may not be a viable option.
Although using a buffer instead of water as the A solvent may correct for baseline drift, it doesn't always produce the desired results. An example of this is seen in Figure 3, where the A solvent is 25 mM ammonium acetate (pH 4) and B is 80% methanol in water. A negative baseline drift of >1 AU is seen at 215 nm for this gradient, and the baseline curves sharply downward as the gradient progresses. A negatively drifting baseline can cause additional problems besides the inability to fit the entire chromatogram on a reasonable vertical scale. Many data systems stop collecting data when the baseline drifts more than approximately 10% below the initial baseline. In the example at 215 nm, the only way to collect this baseline for display was to turn off the autozero function on the data system and manually set the baseline at 1.0 AU before the gradient was started. In this manner, the baseline signal was always >0 AU, so it could be collected by the data system. This certainly is not a technique that is amenable to unattended sample analysis. The reduced UV absorbance at higher wavelengths that was mentioned earlier holds here, as well, where the same gradient at 254 nm is flat. Another option that might help to flatten out the baseline, would be to add ammonium acetate to both the A and B solvents to try to cancel the negative drift as the gradient progresses. It should also be noted that although the present conditions at 215 nm are unacceptable for UV detection, if mass spectrometry (MS) was used for detection instead of UV absorbance, the baseline drift would not be a problem because UV absorbance does not affect the MS signal; ammonium acetate–methanol gradients commonly are used with LC–MS.
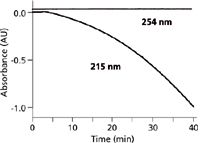
Figure 3: Baselines for ammonium acetateâmethanol gradients of 5â100% B in 40 min at 215 and 254 nm. Mobile-phase A: 25 mM ammonium acetate (pH 4); B: 80% methanol in water. Adapted from reference 5.
In still other cases, the baseline drift during a gradient may not be amenable to correction by adding something to the mobile phase. An example of this is seen in Figure 4, where 50 mM ammonium bicarbonate is used as the A solvent and methanol as the B solvent. At 215 nm, the baseline drifts downward as it approaches the middle of the gradient, then starts back up again. In this case, the change in absorbance is worse for a mixture of A and B than with either solvent alone, so it is unlikely that the absorbance of either mobile phase could be manipulated to compensate for the midgradient dip. As with the other examples of baseline drift with methanol as the B solvent, an increase in the detection wavelength to 254 nm minimizes the problem.
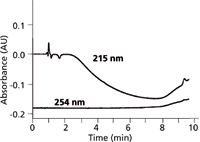
Figure 4: Baselines for ammonium bicarbonateâmethanol gradients of 5â60% B in 10 min at 215 and 254 nm. A: 50 mM ammonium bicarbonate (pH 9); B: methanol. Absorbance scale is relative, not absolute. Adapted from reference 5.
Trifluoroacetic Acid: A Special Case
Trifluoroacetic acid is an additive commonly used in LC separations of biomolecules, such as proteins and peptides. Trifluoroacetic acid acts to acidify the mobile phase (0.1% trifluoroacetic acid gives pH ≈ 1.9) as well as acting as an ion-pairing reagent, both of which are beneficial to many biomolecule separations. In addition, trifluoroacetic acid has low UV absorbance at wavelengths <220 nm, making it especially attractive as an additive for acetonitrile-containing mobile phases. Trifluoroacetic acid is volatile, so it is easily evaporated with the aqueous acetonitrile mobile phase for compatibility with LC–MS detection, as well as other evaporative detection methods, such as evaporative light scattering detection (ELSD) or charged aerosol detection (CAD).
Figure 5 shows gradient baselines at selected wavelengths where A is water with 0.1% trifluoroacetic acid added and B is acetonitrile with 0.1% trifluoroacetic acid added. It is seen that the curvature of the baseline depends on the wavelength chosen. At 215 nm, the baseline is nearly flat, making this an especially attractive wavelength for the detection of proteins and peptides at trace concentrations. At other wavelengths, a little additional trifluoroacetic acid (for example, 0.11% instead of 0.1%) can be added to the A or B solvent to help reduce the baseline drift.
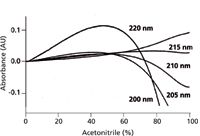
Figure 5: Baselines for trifluoroacetic acidâacetonitrile gradients of 0â100% B in 100 min. A: 0.1% trifluoroacetic acid in water; B: 0.1% trifluoroacetic acid in acetonitrile. Absorbance scale is relative, not absolute. Adapted from reference 6.
Conclusions
We have seen that a major component of baseline drift in gradient LC methods and UV detection often is the result of differences in detector response to the A and B components of the mobile phase. At higher wavelengths, such as >250 nm, the UV absorbance of mobile-phase components usually is minimal, so baseline drift under these conditions is seldom a concern. At wavelengths <220 nm, however, baseline drift caused by differential solvent absorbance can be sufficient to prevent practical use of certain solvents, such as methanol or tetrahydrofuran. Sometimes it is possible to compensate for differences in UV absorbance by adding a UV absorbing component to one solvent or the other. A good example of this was shown in Figure 2 for the addition of phosphate buffer at 215 nm. In other cases, the drift characteristics are such that it is not possible to compensate for drift by modifying the mobile phase. However, by judiciously choosing the mobile-phase components and detection wavelength, it usually is possible to find gradient LC conditions where baseline drift does not compromise the analysis.
References
(1) J.W. Dolan, LCGC North Am. 31 (3), 204–209 (2013).
(2) J.W. Dolan, LCGC North Am. 31 (4), 300–305 (2013).
(3) J.W. Dolan, LCGC North Am. 31(5), 382–389 (2013).
(4) J.W. Dolan, LCGC North Am. 31 (6), 456–463 (2013).
(5) N.S. Wilson, R. Morrison, and J.W. Dolan, LCGC North Am. 19 (6), 590–596 (2001).
(6) C.T. Mant and R.S. Hodges, High-Performance Liquid Chromatography of Proteins and Peptides: Separation, Analysis, and Conformation (CRC Press, Boca Raton, Florida, 1991), p. 90.
John W. Dolan "LC Troubleshooting" Editor John Dolan has been writing "LC Troubleshooting" for LCGC for more than 25 years. One of the industry's most respected professionals, John is currently the Vice President of and a principal instructor for LC Resources, Walnut Creek, California. He is also a member of LCGC's editorial advisory board. Direct correspondence about this column via e-mail to John.Dolan@LCResources.com

John W. Dolan

New Study Reviews Chromatography Methods for Flavonoid Analysis
April 21st 2025Flavonoids are widely used metabolites that carry out various functions in different industries, such as food and cosmetics. Detecting, separating, and quantifying them in fruit species can be a complicated process.
Extracting Estrogenic Hormones Using Rotating Disk and Modified Clays
April 14th 2025University of Caldas and University of Chile researchers extracted estrogenic hormones from wastewater samples using rotating disk sorption extraction. After extraction, the concentrated analytes were measured using liquid chromatography coupled with photodiode array detection (HPLC-PDA).

.png&w=3840&q=75)

.png&w=3840&q=75)


.png&w=3840&q=75)


.png&w=3840&q=75)


