Ghost Peaks from Nitrile Glove Contamination in Reversed-Phase LC Drug Analysis
LCGC North America
An unusual source of contamination was found in the reversed-phase LC analysis of a 0.4% (w/w) drug product during the development stability studies at levels much greater than the 4 ppm limit of quantitation. System-related sources (mobile phase, injector carryover and contamination), formulation components (drug substance, excipients), and the sample-handling procedure were studied by a systematic approach. The evaluation of the sample-handling procedure identified extractables from the sample vial (different from that specified in the analytical method) and the rubber-lined vial cap, and incidental transfer of residue from commonly used nitrile gloves as the sources of unintended contamination in sample analysis.
An unusual source of contamination was found in the reversed-phase liquid chromatography (LC) analysis of a 0.4% (w/w) drug product during the development stability studies at levels much greater than the 4 ppm limit of quantitation. System-related sources (mobile phase, injector carryover and contamination), formulation components (drug substance, excipients), and the sample-handling procedure were studied by a systematic approach. The evaluation of the sample-handling procedure identified extractables from the sample vial (different from that specified in the analytical method) and the rubber-lined vial cap, and incidental transfer of residue from commonly used nitrile gloves as the sources of unintended contamination in sample analysis.
Ghost peaks in liquid chromatography (LC) analyses have been reported in the literature (1–6). Their sources include instrumentation, solvents, glassware, and closure systems. It is important to address their occurrences in the early phases of drug development because they may be an indication of a lack of robustness of the analytical method. When unexpected new impurity peaks appear during stability studies, identifying whether the unexpected peaks are ghost peaks or degradation products is of highest priority. In both cases a thorough investigation needs to be performed. After the new peaks have been determined to be unrelated to stability, the investigation has to identify the source of contamination. When the usual sources are exhausted, then the unlikeliest of sources must be considered.
A validated, stability-indicating reversed-phase LC method used for the analysis of trace impurities in a dry powder inhaled formulation was adapted to support a lower dosage form containing the same excipients as the higher dose formulation. The main differences in the analytical method for the new formulation were the sample diluent used in the extraction and the sample concentration. For the old formulation (2.5% w/w drug load), samples were extracted with a diluent containing 80:20 (v/v) methanol-water followed by centrifugation, and the supernatant was analyzed with a 10-µL injection volume. For the new formulation (0.4% w/w drug load), samples were extracted with a diluent containing 10 mM didodecyldimethylammonium bromide (DDAB, a cationic surfactant) and 1.3 mM ammonium hydroxide (to ensure complete extraction and solubilization of drug substance and impurities) in 40:60 (v/v) methanol-water. The required limit of quantitation (LOQ) for the new formulation was 4 ppm relative to the overall formulation-that is, 0.1% of the 0.4% w/w drug content. After extraction, an equal volume of 1.3 mM ammonium hydroxide in water was added to precipitate the main formulation excipient (less soluble in aqueous media) and DDAB, thus, making the solution less viscous. After centrifugation, a 50-µL volume of the supernatant was injected to achieve approximately the same mass load of the active pharmaceutical ingredient (API) as the old formulation.
The same C18 reversed-phase column and gradient elution conditions were used for the old and new formulations. The binary gradient mobile phases were 0.1% (v/v) trifluoroacetic acid in water and 0.1% (v/v) trifluoroacetic acid in 90:10 (v/v) acetonitrile–methanol.
When this method was transferred to associates performing analysis on development stability samples of the new formulation, seven new degradation peaks (Figure 1) were detected that were out of trend (OOT) with the storage condition of the samples-that is, samples stored at higher temperature and relative humidity or for longer duration had lower total impurities. Furthermore, replicate preparations of the same sample did not exhibit consistent degradation profiles.
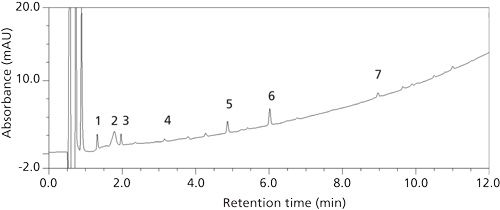
Figure 1: T = 0 (initial time point) development stability sample containing seven artifact peaks, labeled 1 to 7.
To address the appearance of the new, ghost peaks, historical data were considered and the analyst-to-analyst variability was assessed. The high performance liquid chromatography (HPLC) method was used for more than two years both in research and development (R&D) and good manufacturing practice (GMP) testing of the old formulations by multiple analysts without incident with regards to ghost peaks, suggesting good precision. This article summarizes the investigation into the root cause of these new peaks and an unusual source of contamination-the nitrile gloves.
Investigation
Since the diluent blank injections prepared during system conditioning and throughout the stability analysis did not exhibit the same peaks as the samples in question, any system-related causality (such as carryover, mobile phase, or system contamination) was ruled out.
The investigation focused on the samples and sample preparation, since the extra peaks must be either inherent to the drug product samples or introduced through handling of the samples during preparation for injection.
Studies to Determine Whether Peaks Are of Drug-Product Origin
Drug-Substance Degradation Peaks
Forced-degradation studies of the drug substance had been conducted and comparison of the new peaks neither matched retention time or peak absorbance spectrum with peaks generated during forced degradation (Figure 2). These studies indicated that the anomalous peaks were unlikely caused by degradation of the drug substance during sample preparation.
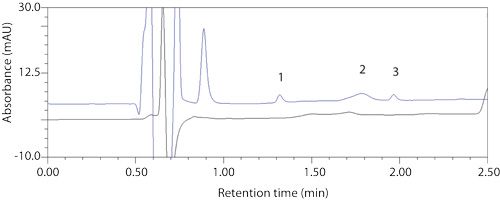
Figure 2: Top: formulation sample with artifact peaks 1, 2, and 3; bottom: photo-forced degraded API.
Excipient Degradation Peaks
The new formulation samples being tested contained >99% excipient, predominately a phospholipid of high purity (>99%). This phospholipid can degrade via hydrolysis and generate a highly polar degradant (glycerophosphatidylcholine) and a nonpolar fatty acid. However, high temperature (80 °C for 1 day) stressing of the placebo and formulation did not generate the same peaks. Additionally, the expected degradants of the excipient were likely to be not detectable at the absorbance detection wavelength of 230 nm. Thus, degradation of the excipient was ruled out as a likely cause of the new peaks.
Studies to Determine Whether Peaks Are of Sample Handling Origin
Extractables from Sample Vials
After interviewing the analyst performing the stability samples testing, it was revealed that instead of 4-mL vials, 7-mL vials were used in the sample preparation. Originally the 4-mL vials were selected because the final sample solution volume (4 mL) allowed for efficient rinsing of the vial headspace and cap by agitation with vortexing, if any sample powder happened to deposit on those surfaces. The caps of the 4-mL vials are lined with rubber with an inert polytetrafluoroethylene (PTFE) coating. During method development and validation, the new peaks in question were not observed. It was discovered that the caps of the 7-mL vials contained only a rubber lining without PTFE coating. Thus, it was suspected that extractables from the rubber liner may have contributed to some of the spurious peaks. As a result, a study was performed whereby 4-mL and 7-mL empty vials were extracted with sample solvent while placed in an inverted position to maximize solvent-cap liner contact. Five out of the seven new peaks were present in the 7-mL vial extraction. A small, sixth peak (peak 4) was observed in the 4-mL vial extraction, despite the PTFE lining in that vial’s cap (Figure 3). Thus, only one peak (peak 2), but the largest, of the new peaks remained a mystery.
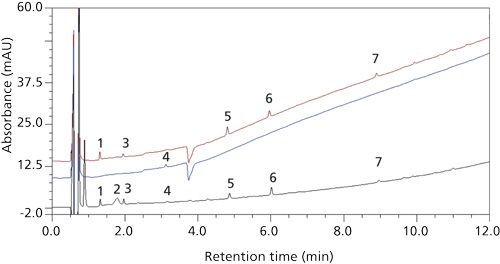
Figure 3: Top to bottom: Diluent in an inverted 7-mL vial with a rubber-lined cap; diluent in an inverted 4-mL vial with a PTFE-lined cap; and drug product sample in a 4-mL vial with a PTFE-lined cap. Peaks 1, 3, 5, 6, and 7 were attributed to the rubber cap liner from the 7-mL vial. Peak 4 was attributed to the PTFE cap liner from the 4-mL vial.
Nitrile Glove Contamination
There was suspicion that contamination came from the nitrile gloves worn in the laboratory. It was observed that a slight foam formed on the gloves when they were wetted with a small amount of water and agitated by rubbing. Information from the glove manufacturer further indicated that the gloves’ interiors are powder-free, chlorinated, and polymer coated (7,8), which further suggested the possibility of contamination from the glove residue. When a sample of the glove was extracted with the sample diluent, the predominant peak had the same retention time (Figure 4) and UV spectrum (Figure 5) as the unknown peak and the source of the last unknown peak was thus identified. The question then became, what was the contaminant?
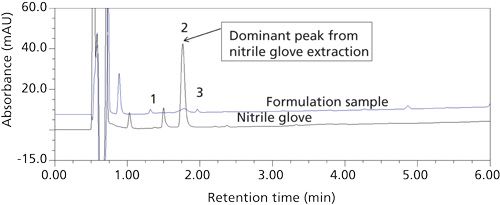
Figure 4: Top: drug product sample chromatogram with unknown peak 2; bottom: nitrile glove extracted with DDAB containing sample diluent.
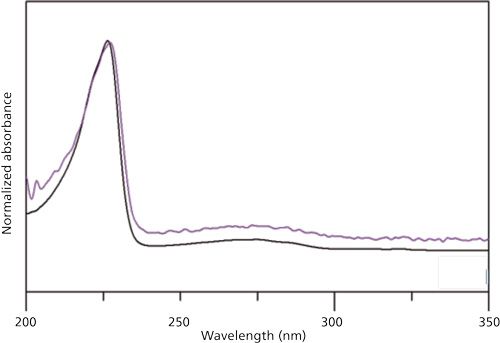
Figure 5: Top: UV spectrum of the 1.8-min retention time peak (peak 2) in the drug product sample; bottom: UV spectrum of nitrile glove extract peak at 1.8-min retention time.
Identification of Unknown Peak
A liquid chromatography-mass spectrometry (LC–MS) study of the nitrile glove extract yielded no ionizable peak in positive-mode electrospray ionization (ESI). In negative mode, a molecular ion of m/z 207 was observed (Figure 6). A prior nitrile glove extraction study using water (9) identified that naphthalene sulfonate, used as an emulsifying agent in nitrile rubber production, may be present. The structure of naphthalene sulfonate was corroborated by both published UV spectrum (10) with absorbance maxima at 227 nm and 275 nm and by mass spectral data. The initial observation that wet gloves produce foam is consistent with the presence of a surfactant residue. Finally, analysis of an authentic sample of naphthalene-2-sulfonate, matched both by retention time and by mass spectrum of the glove extract peak, confirmed the positional isomer structure. The final artifact peak of in the sample was thus identified.
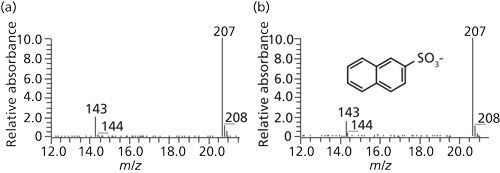
Figure 6: LC–MS negative-ion full-scan spectrum of unknown peak 2 at retention time of 1.8 min (left) and of authentic sodium naphthalene-2-sulfonate (right).
Discussion
Why was the nitrile-glove peak not observed earlier, despite the method having been in use for more than two years in both R&D and GMP testing and the same type of nitrile gloves having been in use in the laboratory? First, the new drug-product formulation requires the use of a surfactant, didodecyldimethylammonium bromide (DDAB), to disrupt the phospholipid matrix to facilitate full extraction of the drug substance. The surfactant likely enhanced extraction of organic residue from all surfaces, including the nitrile gloves. Second, the new formulation method called for an injection volume of 50 µL instead of 10 µL. The fivefold increase in injection volume magnified the sensitivity to any contaminant peaks. Peaks that previously may have been at or below the detection limit were detected, reportable peaks at the same concentrations. Third, the increase in water content in the new sample preparation procedure (80% water) compared to original procedure (20% water) probably had a sample peak focusing effect in reversed-phase gradient elution, especially since the artifact peak was eluted fairly early and close to the dead volume of the column. Finally, the analyst developing and validating the method had a practice of wiping the gloved hands with isopropyl alcohol wipes to remove static electricity before handling the powder samples. Serendipitously, this glove cleaning, which facilitated accurate quantitative sample transfer during weighing, also removed enough of the glove surface residue that contamination was not observed during method development. However, this glove wiping practice was not proceduralized and, hence, was not performed while preparing the stability samples. Thus, the sample contact surfaces (weighing paper, pipette tips, spatula) may have had incidental glove contamination.
Steps to mitigate the risk of glove contamination were evaluated. Although the predominant peak from the initial nitrile glove extract was the one observed in the formulation samples, a number of other extracted peaks were observed, particularly at higher retention times. Several other brands of nitriles gloves were extracted. Even clean-room-grade, powder free, residue free, and chlorinated gloves gave similar peak profiles and additional hydrophobic peaks (Figure 7). Therefore, the best practice recommended is to take extra precaution while using nitrile gloves, which, when balanced with the protection they provide to laboratory workers for common organic solvent used in HPLC and sample preparation, is still the glove of choice for hand protection in the laboratory. Transferable residue from the nitrile gloves can be minimized by wiping them with isopropyl alcohol wipes before sample handling. This practice should not compromise the integrity and protection of the nitrile glove (11). An alternative would be to wear an inner nitrile glove and an outer latex glove, which had far fewer extractable peaks (Figure 8).
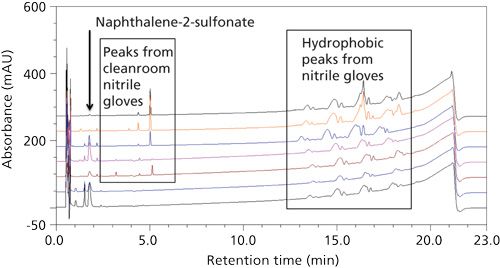
Figure 7: Reversed-phase LC chromatograms obtained from sample-solvent extractions of seven brands of nitrile gloves from various vendors.
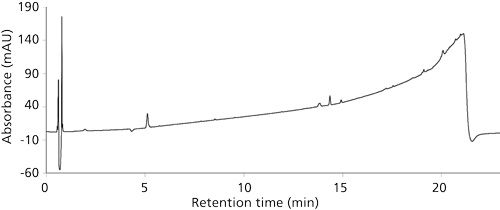
Figure 8: Latex glove (Microflex Safegrip, Microflex Corporation) extracted with DDAB sample diluent.
Conclusions
A systematic approach for evaluating all the possible sources was taken to isolate and identify the sources of the ghost peaks. Since injection of the sample solvent blank did not produce the ghost peaks of interest, system-related sources (for example, mobile-phase contamination, injector carryover, or contamination) were ruled out at the outset. Each component (drug substance or excipient) of the sample was studied and also ruled out. Finally, evaluation of the sample handling procedure identified extractables for both the (wrong) sample vial, the rubber-lined cap, and incidental transfer of residue from commonly used nitrile gloves as the sources of unintended contamination in sample analysis. Extra precaution in sample handling must be taken in trace impurities analysis and evaluated on a case-by-case basis, as we have shown that artifacts could come from the least expected of sources-the nitrile gloves used every day in the laboratory.
Acknowledgments
The authors would like to acknowledge Lennard Hachmann, Madhuri Nagadi, Jason Fleischauer, Betelham Guangul, Thomas Tarara, and Imad Haidar-Ahmad for their discussions and suggestions.
References
- S. Williams, J. Chromatogr. A1052(1-2), 1–11 (2004).
- J.W. Dolan, S. Sadikin, D.D. Zhang, R. Inloes, and S. Redkar, LCGC North Am.29(5), 394–400 (2011).
- J.W. Dolan, LC-GC6(2), 112–116 (1988).
- J.W. Dolan, LC-GC8(7), 516–518 (1990).
- J.W. Dolan, J. Kern, and T. Culley, LC-GC14(3), 202–208 (1996).
- J.W. Dolan, LCGC North Am.30(5), 392–400 (2012).
- http://www.microflex.com/Products/SEC375.aspx
- Microflex Supreno®EC Product Data Sheet, Ansell Limited ©2014.
- C. Reichel, Drug Testing and Analysis4(10), 761–774 (2012).
- Y. Tanizaki, H. Inoue, and N. Ando, Bulletin of the Chemical Society of Japan38(9), 1419–25 (1965).
- Chemical Resistance Guide for Microflex Latex and Nitrile Gloves, Ansell Limited (2014).
James Tam is a Fellow at Novartis Pharmaceuticals Corporation in San Carlos, California. Andrei Blasko is a Senior Fellow at Novartis Pharmaceuticals Corporation. Direct correspondence to: james.tam@novartis.com


.png&w=3840&q=75)

.png&w=3840&q=75)


.png&w=3840&q=75)


.png&w=3840&q=75)


