GCxGC: From Research to Routine
LCGC North America
Two-dimensional gas chromatography (GCxGC) is becoming the technique of choice for analysis of highly complex samples such as petroleum, pharmaceuticals, biological materials, food, flavors, and fragrances. Here, we explain how GCxGC works and provide examples that illustrate its advantages.
Comprehensive two-dimensional gas chromatography (GC×GC) is becoming increasingly popular. Since its inception in the 1990s, and its original commercial availability about 15 years ago, GC×GC has moved from a strict research realm into more routine applications and use. Although not yet a standard capability on all gas chromatographs, GC×GC is rapidly becoming the technique of choice for analysis of highly complex samples as diverse as petroleum, pharmaceuticals, biological materials, food, flavors, and fragrances. This installment of "GC Connections" begins with a brief introduction to GC×GC, follows with examples of how GC×GC opens additional avenues of analysis, and concludes with information about how to learn more.
GC×GC is continuing to see increased attention throughout the scientific community. Until fairly recently, most GC×GC work was performed and published by chromatography experts. Much like traditional gas chromatography (GC), which is now routinely used by analysts with a wide variety of scientific backgrounds, GC×GC is finding its way out of the chromatographer's laboratory. "Should I try GC×GC?" is one of the most common questions I receive when discussing GC or GC×GC. Following a short introduction, this article discusses scenarios in which GC×GC has proven useful and applicable to routine analyses, and some avenues for obtaining additional help and information.
A simple schematic of the basic instrumentation and data processing in GC×GC is shown in Figure 1. The instrumentation is based on a traditional GC system, with the same inlet, main column oven, and detector. A second column oven, usually smaller for ease of heating and cooling, is added to house the second-dimension column within a separate heated zone. Also, a modulator is added to provide the sample transfer between the two columns. These are all controlled by a specialized data system. A traditional column is used in the first dimension, and the second column is very short (often 1–2 m), to perform a fast separation. As analytes elute from the first column, they are refocused at the head of the second column, and injected very rapidly, with second dimension separations lasting for only a few seconds. This transfer is performed by the modulator, which is programmed to perform this step at regular intervals, essentially cutting the chromatogram into short slices. As seen in Figure 1, GC×GC has one major instrumental advantage over other multicolumn techniques in that it employs only one detector. LCGC's training partner ChromAcademy provides a summary of the various configurations of multidimensional GC that are available (1).
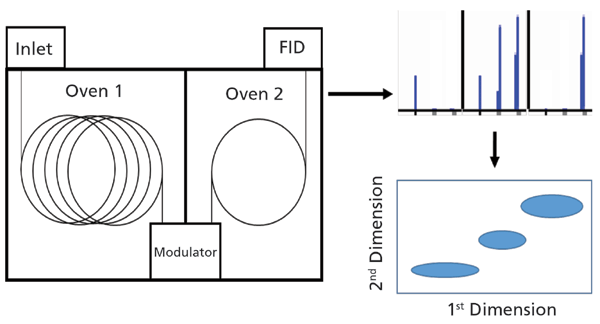
Figure 1: Simplified schematic of a GC×GC instrument and the data analysis process.
The right side of Figure 1 shows the data analysis process, performed by the data system. As there is one detector, a single chromatogram is generated, shown at the top. The solid vertical lines represent the beginning and end of each slice. The chromatogram is separated into these slices, which are then organized side-by-side, to generate the three-dimensional plot shown below.
Figure 2 shows a photograph of the column oven in a GC×GC instrument. The most important difference versus GC is the addition of the second column oven and the modulator hardware. In this configuration, the second column oven is installed within the main column oven; usually, the second column is maintained at the same or higher temperature as the main oven. The two columns are connected with a simple capillary column butt-connector. The modulator sits at the head of the second column. In this system, a two-stage thermal modulator is used with alternating cold liquid nitrogen and heated gaseous nitrogen gas jets that focus and inject the analytes into the second column, without allowing unwanted carryover from the first. There are numerous reviews and vendor websites that provide more detail about instrumentation, modulators and data analysis in GC×GC (2). A simple online search using "GC×GC" as keyword will point you to major vendors.
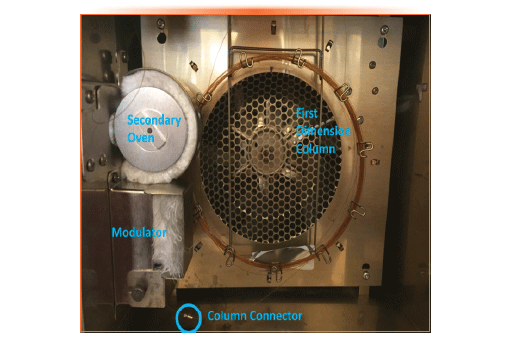
Figure 2: Photograph of the oven in a GC×GC system showing the primary column, column connection, modulator and secondary oven.
One major advantage of a GC×GC instrument is that the additional components (modulator and second column oven) are installed between the traditional inlet and detector in a gas chromatograph, allowing them to be used without modification. Given that GC×GC is most commonly used for analysis of extremely complex mixtures, most applications have been developed using split injection, which ensures a rapid transfer of the analyte mixture to the first-dimension column. Other injection techniques, and nearly all on- and off-line sample preparation techniques, have been attempted with GC×GC. In this article, examples using split, splitless, and solid-phase microextraction (SPME) injections are shown. In detection, there is one important caveat in GC×GC: The detector must be fast. The short second-dimension column generates peaks that are eluted with widths of 100–200 ms or less. If 10 data points are required to generate a properly symmetrical peak for good quantitative analysis, the detector must be able to respond by providing a signal within 10–20 ms. The data collection rate must therefore be set at a minimum of 50–100 Hz for proper peaks to be generated. A flame ionization detector is easily capable of this, but most benchtop mass selective detectors in full-scan mode are not, without careful optimization. Most GC×GC–MS applications are therefore performed using time-of-flight mass spectrometry (TOF-MS), which allows extremely fast full-scan rates.
The decision to consider GC×GC should be based on the overall needs and goals of the project, and on the other capabilities that can be built into the method. There is also a cost consideration, as the hardware for GC×GC and for GC×GC–TOF-MS requires larger capital and ongoing expenses than for traditional GC and GC–MS, and additional training and skill development for system operators are needed. Less expensive alternatives, such as heart-cutting or additional sample preparation, should also be considered. GC×GC has been described as a "super-resolution" technique, so the need for high resolution or peak capacity (the number of peaks that can theoretically be fit into the chromatogram) is the main driver for choosing it (3).
This main consideration leads to three situations where a multidimensional approach to the column in GC, leading to GC×GC, mainly apply.
- First, there is a complex sample matrix with many peaks and a smaller sub-set of them are of interest
- Second, there are many peaks of interest that must all be separated.
- Third, there are a few very closely spaced or overlapping peaks, and they are not separated following optimization of the method.
The first major application for GC×GC was in petroleum analysis, perhaps the most extreme example of the first situation. Petroleum-related samples often contain thousands of compounds, yet often only a few are of interest. They must still be separated from the rest of the extremely complex sample matrix. Figure 3 shows a traditional GC–MS chromatogram of a sample of "brown mousse" obtained from the surface of the Gulf of Mexico following the explosion of the Deepwater Horizon oil platform in 2010. A photograph of a brown mousse sample in a jar is included. The sample has the physical consistency of chocolate mousse, and the odor of another well-known brown substance. Extraction and chromatographic conditions are included with the figure. This chromatogram is typical of petroleum analysis in one dimension. The spikes represent signals from straight chain alkanes, and the "hump" results from a huge number, perhaps thousands, of overlapping hydrocarbon isomers. It is very difficult to detect individual compounds or compound classes of interest from such a complex one-dimensional chromatogram.
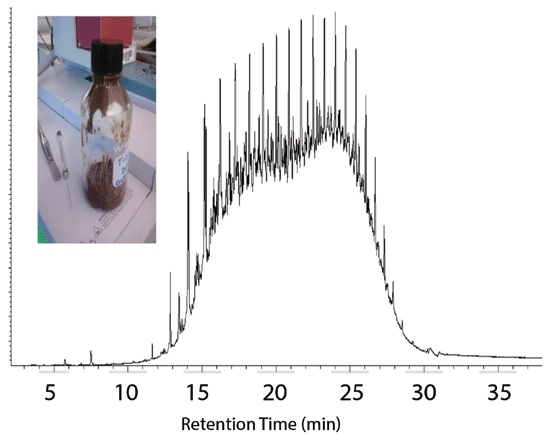
Figure 3: One-dimensional GC–MS total ion chromatogram of a 100-mg "brown mousse" sample in 2 mg of pentane from the surface of the Gulf of Mexico following the Deepwater Horizon oil spill. Instrument: Agilent 6890/5973 GC-MSD. Conditions: Splitless, 250 °C, 0.75 min, 1.0 mL/min, constant flow; DB-5MS, 15 mm × 0.25 mm × 0.25 µm, 40 °C, 1 min, 10 °C/min to 300 and hold; EI 70 eV, full scan 40-600 amu.
Figure 4 shows a GC×GC–TOF-MS separation of the same extract. The chromatogram is viewed as a contour plot, with the bright spots representing peaks against the blue baseline. The horizontal axis represents the traditional retention time on the first-dimension column; the total run time is 40 min, similar to the one-dimensional example. The vertical axis represents the short second-dimension retention time. As described above, the full chromatogram was separated into 8-s slices, and reassembled into the three-dimensional plot. The brighter and more red the spot, the taller the peak, while the blue color represents the baseline. The black dots represent the apexes of all the individual peaks identified by the data system. In this case, it is possible to generate a mass spectrum of each of these peaks, if desired.
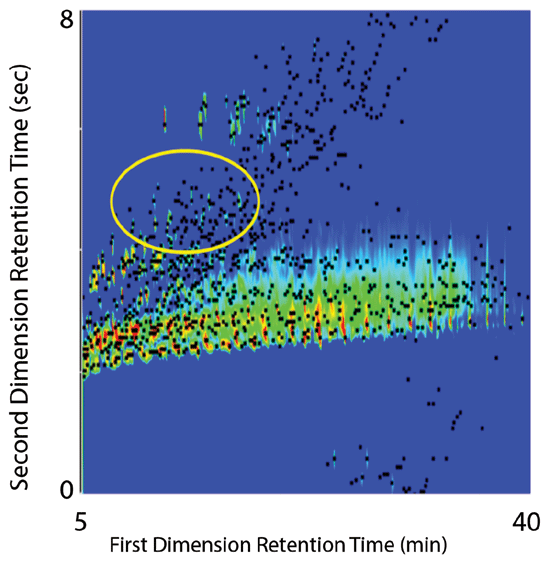
Figure 4: GC×GC–TOF-MS chromatogram of a "brown mousse" sample from the surface of the Gulf of Mexico following the Deepwater Horizon oil spill. Columns: 1D: DB-5MS, 30 m × 0.25 mm × 0.25 µm; 2D: Rtx-200 1.5 m × 0.25 mm 0.25 µm. Temperature program: 1D: 40 to 300 °C at 10 °C/min; 2D: 45 to 305 °C at 10 °C/min. Modulator: 0.90 s hot pules; 1.60 s cold pulse. MS: EI, full scan 40-600 amu.
We were interested in polycyclic aromatic hydrocarbons (PAHs). The PAHs were easily identified using extracted ion chromatograms; some are circled on the plot. This is the first and most important benefit of GC×GC: Individual compounds or compound classes of interest are much more easily separated from the remaining matrix components. With judicious choices of column sets, the chromatography can be made very highly selective for specific compounds of interest. In this case, the PAHs are found together near the "top" of the chromatogram in the circled region. In our application, GC×GC was used to separate and identify a small number of components of interest that share a common chemistry, from a large and complex sample matrix. Figure 4 also shows a few peaks near the bottom of the chromatogram. This is an example of "wraparound," an effect caused by second dimension peaks being retained longer on the second-dimension column than the modulation period (in this case 8 s). They then appear in the next slice.
Given that the analytes of interest were PAHs and related compounds, we chose to extract m/z 128, which is representative of naphthalene and related compounds. Figure 5 shows the extracted ion chromatogram (EIC) of an oil spill sample. This chromatogram demonstrates the very high selectivity that can be obtained when combining the separation power of a traditional first-dimension column with the added selectivity of the second-dimension column followed by a selective detector. The bright spots represent the peaks that included signals for m/z 128. Note that the large signals for the alkanes no longer appear. The black dots, which represent the maxima of all the peaks, are left in the figure to demonstrate the unique selectivity obtainable in GC×GC, especially when using MS detection, that enables the isolation of a few peaks from hundreds or thousands.
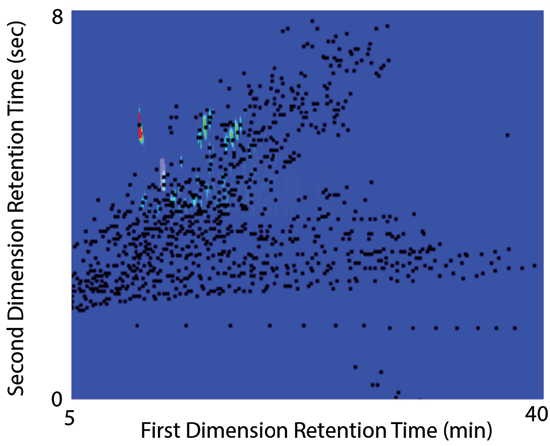
Figure 5: Extracted ion GC×GC×TOF-MS Chromatogram (m/z 128) of a "brown mousse" sample from the surface of the Gulf of Mexico following the Deepwater Horizon oil spill. Conditions identical to Figure 4.
In the second situation, there is a large number of analytes, which must be fully separated, either for good quantitative analysis (perhaps detection is performed with a flame ionization detector or other traditional detector, not a mass selective detector [MS]) or for resolution that must meet regulatory requirements. One example of this type of problem is the analysis of residual solvents in pharmaceuticals, which is governed in the United States by the United States Pharmacopeia, General Chapter <467> (USP <467>) (4). In 2008, Crimi and Snow published an article in LCGC North America describing the use of GC×GC–FID for this analysis (5). This article is available freely online. A two-dimensional separation of the complete set of class I (high toxicity), class II (moderate toxicity), and class III (low toxicity) residual solvents is described, along with discussion of the method development process.
Figure 6 shows the two-dimensional separation of the class II, moderately toxic solvents. These include common moderately toxic solvents, such as methanol, ethanol, acetonitrile, dichloromethane, and others. A full list of the analytes can be found in the article. In this example, the analytes were dissolved in methanol, which is not a traditional diluent for residual solvents analysis. As seen in the figure, the components are all well-separated from each other, from matrix components and from interferences inherent in GC analysis. The inset shows the separation of acetonitrile and dichloromethane, as an important system suitability test. Note the large solvent peak, methanol. It is also fully separated from these two analytes, including the long tail. In GC, most solvent peaks can exhibit a detectable tail long after the solvent has eluted. In traditional one-dimensional GC, the solvent peak tail would lie underneath all analyte peaks, possibly affecting quantitation. In GC×GC, the analytes are fully separated from the solvent peak tail. Also note the row of small, sharp peaks in the lower right quadrant of Figure 6. These are indications of a small amount of septum bleed. In a traditional separation, they would appear as "extra" peaks, possibly interfering with the analysis. In GC×GC, like the solvent peak, they are fully separated from the analytes. A complete separation of all the International Council for Harmonization (ICH) Class I, II, and III residual solvents (57 compounds) and full description of the separation conditions is provided in the article. In this case, GC×GC allowed separation of all 57 analytes, with separation from the solvent peak tail and other interferences.
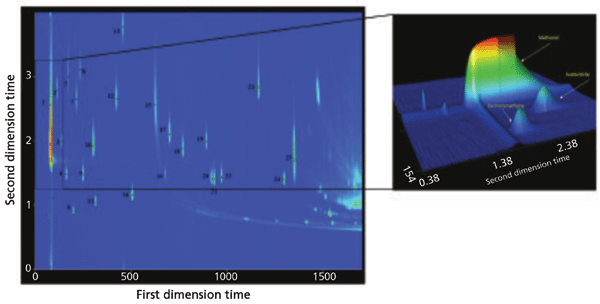
Figure 6: GC×GC-FID chromatogram of ICH class II pharmaceutical residual solvents. Inset shows three-dimensional plot of the separation of acetonitrile and dichloromethane as system suitability test. Reprinted with permission from Reference 5.
In the third situation, GC×GC can be used to separate several closely eluted or overlapping peaks that are not separated in more traditional method development. This situation may arise, especially in cases where the first-dimension separation is optimized for speed. A faster separation generally means less separating power and lower resolution. Figure 7 shows a one-dimensional separation, really a non-separation, of several steroids on a traditional 5% phenyl polydimethylsiloxane column, 15 m × 0.25 mm × 0.25 µm (6). I use this stationary phase and column dimensions for many separations in my own laboratory, because it represents an excellent compromise between separating power and analysis time. It is a good starting point for method development. There are about 10 overlapping peaks eluted in a very short time window at about 12 min. This situation is common with close structural isomers and closely related structures. There are several possible approaches for optimizing this separation, including further optimizing the temperature program (see Hinshaw's recent "GC Connections" column using a computer simulation [7]), changing the column to one with greater selectivity for steroids, or heart-cutting, a classical form of multidimensional GC in which the small portion of the chromatogram with the overlapping peaks is transferred to a second, more selective column (8). Heart-cutting is still often the method of choice in this situation, as the instrumentation required is simpler than for GC×GC.
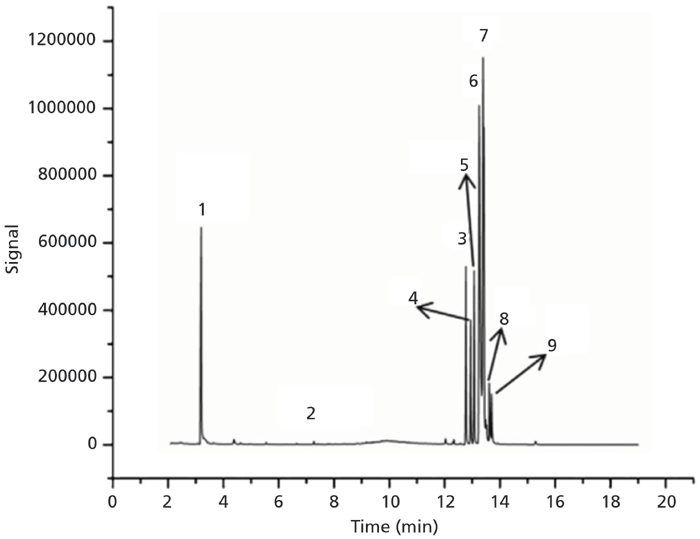
Figure 7: Selected-ion monitoring (SIM) chromatogram for SPME-GC–MS analysis of nine drugs. The drugs are identified in the article. Reprinted with permission from Reference 6.
In this case, we used GC×GC to separate the steroids. The resulting chromatogram is shown in Figure 8. The first-dimension column was the same as in the single dimension separation, so the retention times of the overlapping peaks are about the same and the total run time is about the same. The second-dimension column was 1.5 m × 0.25 mm × 0.25 µm trifluoro propyl methyl polysiloxane, which is more polar, and has better selectivity for steroids and other drugs due to greater opportunity for dispersive and dipole–dipole interactions between the trifluoropropyl methyl moieties on the stationary phase and the various functional groups on the drugs. This separation demonstrates increased resolving power of GC×GC in a similar run time to GC, with the formerly overlapping analytes now fully separated. Also note that SPME was used for the sample preparation and injection.
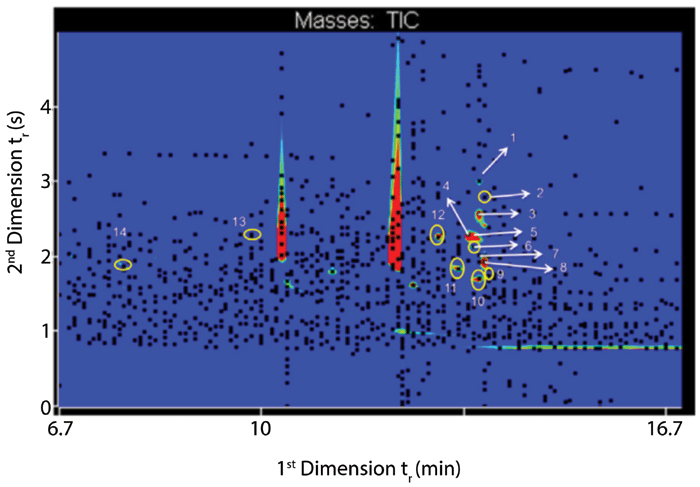
Figure 8: SPME-GC×GC–TOF-MS contour plot chromatogram of 14 drugs extracted from tap water. Drugs are identified in the article. Reprinted with permission from Reference 6.
There are now myriad applications of GC×GC in the chemical literature, and several instrumental configurations. Most major instrument manufacturers offer multidimensional GC in some form, ranging from simplified heart-cutting to fully implemented GC×GC. A simple search in Google Scholar using "GC×GC" as the keyword yielded about 5870 results (9). To quickly learn more about GC×GC, consider attending the International Symposium on Capillary Chromatography and GC×GC Symposium in Fort Worth, Texas, May 12–17, 2019 (10,11). This is the continuation of an annual series of small meetings of the best minds in capillary chromatography that began in Hindenlang, Germany, in the 1970s. The meeting is now held in alternating years in Ft. Worth (USA) and Riva del Garda (Italy). One of this year's plenary lectures, titled "Don't Bring a Football to a Baseball Game: Get GC×GC to Have its Own Rules, Field, and Fan Base," is being given by Chris Reddy of Woods Hole Oceanographic Institute. Chris Reddy is one of the leaders in bringing GC×GC from the realm of chromatography research laboratories into the "real world." Unlike most conferences, this symposium (of about 500 attendees) is built around discussion, well-attended poster sessions, and a strong social program where all attendees have opportunities to rub elbows and discuss chromatography in an informal setting with the leaders in the field. The GC×GC meeting begins with a GC×GC short course on Sunday, May 12, followed by the opening of the GC×GC symposium on Monday and the rest of the capillary chromatography program on Tuesday. This is an unparalleled opportunity to learn about GC and GC×GC directly from leaders and pioneers.
GC×GC is fully quantitative and automated as easily as GC. If "super-resolution" is a priority, GC×GC is clearly ready to take its place alongside GC as a major technique for both research and routine analysis in its own right.
Acknowledgement
The author is grateful to Prof. John R. Sowa, Jr. (now at Governor's State University) for providing the brown mousse sample and to Dr. Brian B. Barnes (now at ExxonMobil) for obtaining the chromatograms.
References
(1) ChromAcademy website. https://www.chromacademy.com/gc-training.html (Accessed January, 2019).
(2) M. Adahchour, J. Beens, R.J.J. Vreuls, and U.A.T. Brinkman, Trends Anal. Chem.25(5), 438–454 (2006).
(3) P. Marriott and Y. Nolvachai, The Analytical Scientist, 67 (2018).
(4) General chapter <467>, "Residual Solvents," in United States Pharmacopeia 40 – National Formulary 25 (United States Pharmacopeial Convention, Rockville, MD, 2017).
(5) C.M. Crimi and N.H. Snow, LCGC North Amer. 26(1), 62–70 (2008).
(6) P.C.F.L. Gomes, B.B. Barnes, A.J. Santos-Neto, F.M. Lancas, and N.H. Snow, J. Chromatogr. A 1299, 126–130 (2013).
(7) J.V. Hinshaw, LCGC North Amer.35(11), 810–815 (2017).
(8) P.Q. Tranchida, D. Sciarrone, P. Dugo, and L. Mondello, Anal. Chim. Acta, 716, 66-75 (2012).
(9) http://scholar.google.com (Accessed January 10, 2019)
(10) K.V. Schug, LCGC North Amer. 36(12), 891–893 (2018).
(11) https://www.isccGC×GC.com/ (Accessed January, 2019).
ABOUT THE COLUMN EDITOR
Nicholas H. Snow

Nicholas H. Snow is the Founding Endowed Professor in the Department of Chemistry and Biochemistry at Seton Hall University. He is also the university's Director of Research and an Adjunct Professor of Medical Science. During his 30 years as a chromatographer, he has published more than 60 refereed articles and book chapters and has given more than 200 presentations and short courses. He is interested in the fundamentals and applications of separation science, especially gas chromatography, sampling, and sample preparation for chemical analysis. His research group is very active, with ongoing projects using GC, GC–MS, two-dimensional GC, and extraction methods including headspace, liquid–liquid extraction, and solid-phase microextraction.
John V. Hinshaw

John V. Hinshaw "GC Connections" editor John V. Hinshaw is a Senior Scientist at Serveron Corporation in Beaverton, Oregon, and a member of LCGC's editorial advisory board. Direct correspondence about this column to the author via e-mail: LCGCedit@ubm.com

Fundamentals of Benchtop GC–MS Data Analysis and Terminology
April 5th 2025In this installment, we will review the fundamental terminology and data analysis principles in benchtop GC–MS. We will compare the three modes of analysis—full scan, extracted ion chromatograms, and selected ion monitoring—and see how each is used for quantitative and quantitative analysis.
From Gas to Gas: Fundamentals of Static Headspace Extraction-Gas Chromatography
August 9th 2024In this article, we discuss the fundamentals of headspace extraction, including static versus dynamic extraction, establishing equilibrium in the vial, consequences of the partition coefficient, temperature, pressure, and transfer to the gas chromatograph.


