GCxGC Forensic Analysis of Oil Sheens at the Deepwater Horizon Disaster Site Helps Pinpoint the Source of Oil Leakage
LECO Corporation
Background Information
On April 20, 2010 an explosion and fire aboard the drilling rig Deepwater Horizon killed 11 crew members and marked the beginning of the largest offshore oil spill ever to occur in US territorial waters. The Deepwater Horizon capsized and sank on April 21, 2010 coming to rest 400 m northwest of the well head at a depth of approximately 1500 m. Crude oil from the Macondo well flowed into the northern Gulf of Mexico between April 20th and August 4th 2010 before the well was finally sealed with drilling mud and cement. Over the course of the spill an estimated 4.9 million barrels of oil flowed into the Gulf of Mexico according to a US Federal On-Scene Coordinators (FOSC) report. Crude oil from this spill impacted beaches and marshes in Texas, Louisiana, Mississippi, Alabama, and Florida.

Figure 1: A surface oil sheen seen in October 2012, above the wreckage of the Deepwater Horizon drilling rig. (Courtesy of Chris Reddy.)
Scope of this Study
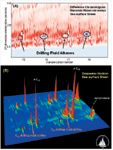
Alkenes commonly found in synthetic drilling-fluids were used to identify sources of oil sheens that were first observed in September 2012 close to the Deepwater Horizon (DWH) disaster site, more than two years after the Macondo well (MW) was sealed (Figure 1). Exploration of the sea floor by BP confirmed that the well was capped and sound. BP scientists and engineers identified the likely petroleum source as leakage from an 80-ton cofferdam abandoned during the operation to control the MW in May 2010. We acquired and analyzed sheen samples at the sea-surface above the DWH wreckage as well as oil samples collected directly from the cofferdam, the MW, and natural seeps in the area. GC×GC allowed the identification of drilling fluid C16- to C18-alkenes in sheen samples. Drilling fluid alkenes were absent in the cofferdam oil (Figure 2a), reservoir, and natural seeps. Furthermore, the spatial pattern of evaporative losses of sheen oil alkanes indicated that oil surfaced closer to the DWH wreckage than the cofferdam site. Lastly, ratios of alkenes and oil hydrocarbons pointed to a common source of oil found in sheen samples and recovered from oil-covered DWH debris collected shortly after the explosion. These lines of evidence suggest that the observed sheens do not originate from the MW, cofferdam, or from natural seeps. Rather, the likely source is oil in tanks and pits on the DWH wreckage, representing a finite oil volume for leakage.

Figure 2: (a) Difference chromatogram made by normalizing Macondo well petroleum and a surface sheen sample collected in October 2012. The red peaks represent components that are more abundant in the Macondo reservoir sample while blue peaks represent components that are more abundant on the sheen sample. (b) Zoomed in view of a GCÃGC analysis of a sea-surface sheen sample containing drilling fluid alkenes collected in October 2012.
Experimental
Instrument: LECO Pegasus IV GC × GC-TOF
Columns: 1st Dimension, Restek Rtx-1ms,
60 m × 0.25 mm × 0.25 μm
2nd Dimension, SGE BPX-50
1.5 m × 0.10 mm × 0.10 μm
Injection: Splitless at 300 °C
Carrier Gas: Helium at 1mL/min, constant flow
Temperature Ramps
Oven 1: 60 °C (10 min), 1.25 °C/min to 325 °C (5 min)
Oven 2: 65 °C (10 min), 1.25 °C/min to 330 °C (5 min)
Modulation Period: 10 s
Mass Range: 35–650 m/z
Acquisition Rate: 50 spectra/s
Source Temp: 225 °C
Transfer Line: 300 °C
Results and Discussion
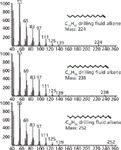
Identification of similarities and differences between complex mixtures such as petroleum is extremely difficult, tedious, and time consuming. GC–MS experiments in our lab and in other labs failed to pick up the drilling fluids in the sea-surface sheens therefore, due the large number co-eluting components in the saturate/olefin region and the very low concentrations of drilling fluid alkenes, GC×GC was the only option for this work. We have developed a methodology which uses difference chromatograms to rapidly distinguish between two complex mixtures (1). Briefly, chromatograms are normalized with a component that is common to both samples then one chromatogram is subtracted from the other. Positive values are assigned one color and negative values another color. In this case (Figure 2a), components that were unique to the oil surfacing and forming sheens in the Gulf of Mexico are shown in blue and components that are present in higher abundance in the MW reservoir are shown as red. Analyzing GC×GC chromatograms in this manner allowed us to quickly focus on the drilling fluid components present in surface sheens. Mass spectral examination of the peaks identified in the difference chromatogram confirmed that these compounds were alkenes derived from the drilling fluids used during drilling operations on the Deepwater Horizon rig (Figure 3).

Figure 3: Mass spectra obtained from drilling fluid alkene peaks first identified in the difference chromatograms from Figure 2a.
Conclusions
GC×GC forensic analysis of surface sheens collected above the Deepwater Horizon enabled us to eliminate a number of possible leakage sources based upon direct comparison with each source sample. We were able to confidently rule out the Macondo reservoir, the cofferdam, and natural oil seeps because none of these possible leakage sources contained drilling fluid alkenes. Comparison of the sheen samples with oil covered floating riser pipe buoyance compensator debris collected shortly after the explosion showed very high similarity (both contained drilling fluids) and lead to the conclusion that the source of oil surfacing 2 years after the explosion must be the wreckage of the Deepwater Horizon (2-5).
References
(1) R.K. Nelson, B.S. Kile, D.L. Plata, S.P. Sylva, L. Xu, C.M. Reddy, R.B. Gaines, G.S. Frysinger, and S.E. Reichenbach, Environ. Forensics 7, 33–44 (2006).
(2) C.M. Reddy, J. Arey, J.S. Seewald, S.P. Sylva, K.L. Lemkau, R.K. Nelson, C.A. Carmichael, C.P. McIntyre, J. Fenwick, G.T. Ventura, B.A.S. Van Mooy, and R. Camilli, Proceedings of the National Academy of Sciences of the United States of America 109, 20229–20234 (2011).
(3) C.A. Carmichael, J.S. Arey, W.M. Graham, L.J. Linn, K.L. Lemkau, R.K. Nelson, and C.M. Reddy, Environ. Res. Lett. 7, 015301 (2012).
(4) H.K. White, P.Y. Hsing, W. Cho, T.M. Shank, E.E. Cordes, A.M. Quattrini, R.K. Nelson, R. Camilli, A.W.J. Demopoulos, C.R. German, J.M. Brooks, H.H. Roberts, W. Shedd, C.M. Reddy, and C.R. Fisher, Proceedings of the National Academy of Sciences of the United States of America 109(50),, 20303–20308 (2012).
(5) C. Aeppli, C.M. Reddy, R.K. Nelson, M.Y. Kellerman, and D.L. Valentine,, Environ. Sci. Technol., 47(15), 8211–8219 (2013).

LECO Corporation
3000 :Lakeview Avenue, St. Joseph, MI 49085
tel. (269) 985-5496, fax (269) 982-8977
Website: www.leco.com

Analysis of Pesticides in Foods Using GC–MS/MS: An Interview with José Fernando Huertas-Pérez
December 16th 2024In this LCGC International interview with José Fernando Huertas-Pérez who is a specialist in chemical contaminants analytics and mitigation at the Nestlé Institute for Food Safety and Analytical Sciences at Nestlé Research in Switzerland, In this interview we discuss his recent research work published in Food Chemistry on the subject of a method for quantifying multi-residue pesticides in food matrices using gas chromatography–tandem mass spectrometry (GC–MS/MS) (1).


