Fundamentals of Benchtop GC–MS Data Analysis and Terminology


Small quadrupole mass spectrometers have made benchtop gas chromatography-mass spectrometry (GC–MS) one of the most powerful tools in analytical chemistry. Combining the unparalleled separation power of gas chromatography with the detection and identification capabilities of mass spectrometry, benchtop GC–MS provides both universal and selective separation and detection in a single system. In this installment, we will review the fundamental terminology and data analysis principles in benchtop GC–MS. We will compare the three modes of analysis—full scan, extracted ion chromatograms, and selected ion monitoring—and see how each is used for quantitative and quantitative analysis.
Benchtop gas chromatography-mass spectrometry (GC–MS) is a staple technique that has been available for decades for gas chromatographers who need to perform both qualitative and quantitative analysis. Modern benchtop GC–MS systems are simple to operate and combine the sensitivity and selectivity of mass selective detection with the high resolving power of capillary gas chromatography. In the context of GC–MS, a mass spectrometric detector may also be called a mass selective detector (MSD).
A mass spectrometer is an ionization-based detector. Vapor phase analyte molecules are ionized; the ionization process often leads to the molecule fragmenting, literally falling apart into smaller fragment ions. The ionized fragments are then passed to a mass analyzer, usually a quadrupole, where they are separated by mass-to-charge ratio (m/z). The separated ions are then detected by an electron multiplier. We will consider instrumental details in a later column and troubleshooting and optimizing have been discussed in previous columns (1,2).
When developing a new method using GC–MS, we usually start by developing the chromatographic method and conditions using full-scan mode. Figure 1 shows a full-scan chromatogram of a pesticide mixture. When running full scan, the detector continuously records mass spectra, often up to 20 or more spectra per s, depending on the scan rate and mass range selected. Figure 1a shows the full total ion chromatogram (TIC). Note that recording the full mass throughout the run leads to the slightly elevated baseline. The detector is recording a small signal for every mass within the chosen spectral range (in this case, 40-400 amu). The baseline drift toward the end of the run is typical of column bleed.

: Total ion chromatogram (TIC) of a pesticide mixture; (b) Zoomed TIC of a pesticide mixture showing detail of the peak for fenoxycarb at about 12.8 min. Peak Identification: 1: aldicarb, 2: propoxur, 3: carbofuran, 4: methiocarb, 5: fipronil, 6: imazalil, 7: chlorfenapyr, 8: fenoxycarb, 9: thiacloprid.")
FIGURE 1: (a): Total ion chromatogram (TIC) of a pesticide mixture; (b) Zoomed TIC of a pesticide mixture showing detail of the peak for fenoxycarb at about 12.8 min. Peak Identification: 1: aldicarb, 2: propoxur, 3: carbofuran, 4: methiocarb, 5: fipronil, 6: imazalil, 7: chlorfenapyr, 8: fenoxycarb, 9: thiacloprid.
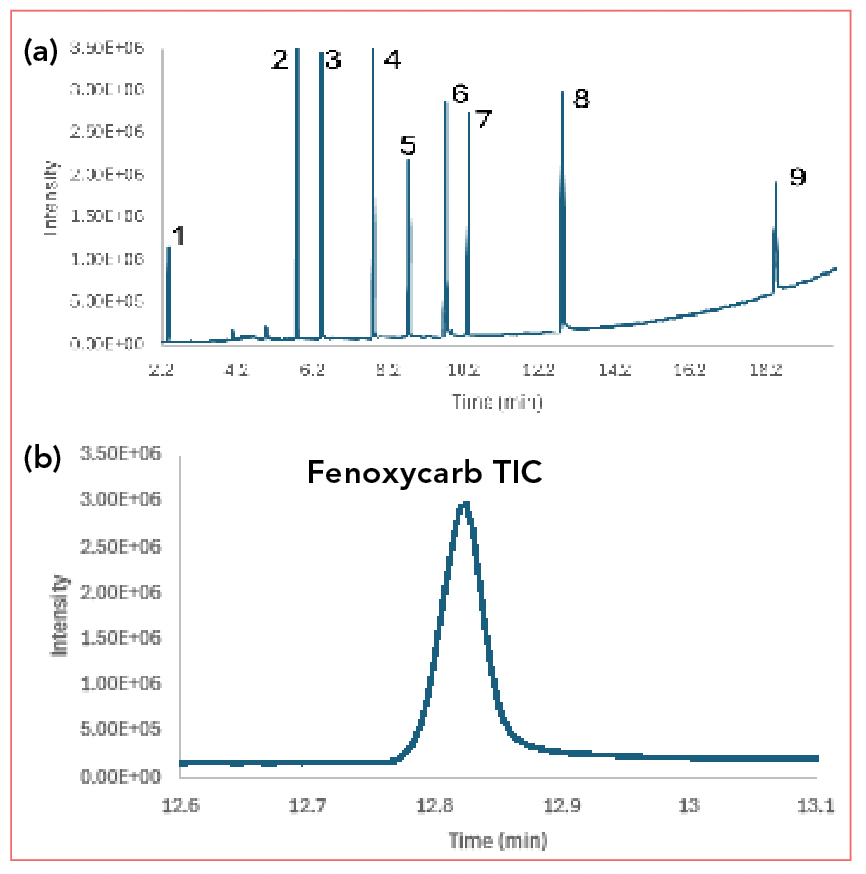
Figure 1b shows the chromatogram zoomed in on one compound, fenoxycarb. Note the peak width, which is typical in temperature programmed capillary GC (about 0.1 min), and look carefully at the top of the peak. We see that it is not a perfectly shaped Gaussian peak; this is a result of the limited scan rate in typical full scan GC–MS. By comparison, a flame ionization detector (FID) can collect data points up to 200 points/s; the GC–MS usually scans at about 10 points/s. We can see the baseline starting to drift, again as the result of column bleed.
This full scan chromatogram is called a total ion chromatogram (TIC). The data system constructs the chromatogram as the sum of all ion signals reaching the detector. In the TIC, we begin to see both the universal and selective properties of the MSD, and both the benefits and the challenges. The main benefit and challenge are the same: Every vapor phase molecule that reaches the detector is detected and contributes to the signal shown in the chromatogram.
In Figure 1a, we see the elevated baseline that results from instrumental noise as a signal is being detected for every ion scanned, and these signals are then added to generate the TIC. Remember that there is always a background signal, even if there is no analyte. If air, water, or other contaminants are present in the carrier gas, these can also contribute to the baseline signal. Many operators mitigate this problem by not scanning masses below about m/z 40. In this case, oxygen (m/z 32), nitrogen (m/z 28) and water (m/z 18) ions are not detected and do not contribute to the baseline. If you check the spectrum at any point on the baseline and you are scanning to low enough masses, you may see a mass spectrum including air (oxygen and nitrogen), water and possibly argon (m/z 40) and carbon dioxide (m/z 44). As the elevated baseline from column bleed is reached, fragments related to the slight degradation of the stationary phase can appear as well.
The MSD’s universal property is seen in Figure 2; a universal detector detects all or nearly all molecules that pass into it. Thermal conductivity (TCD) is the classical universal detector and flame ionization (FID) is considered nearly universal for carbon containing analytes. Figure 2 shows a mass spectrum and structure for the peak and analyte highlighted in Figure 1b, fenoxycarb. On the mass spectrum, the x-axis is m/z and the y-axis is the relative abundance or signal, relative to the m/z with the highest signal.

FIGURE 2: Mass spectrum of fenoxycarb obtained from the TIC in Figure 1a and molecular structure of fenoxycarb.
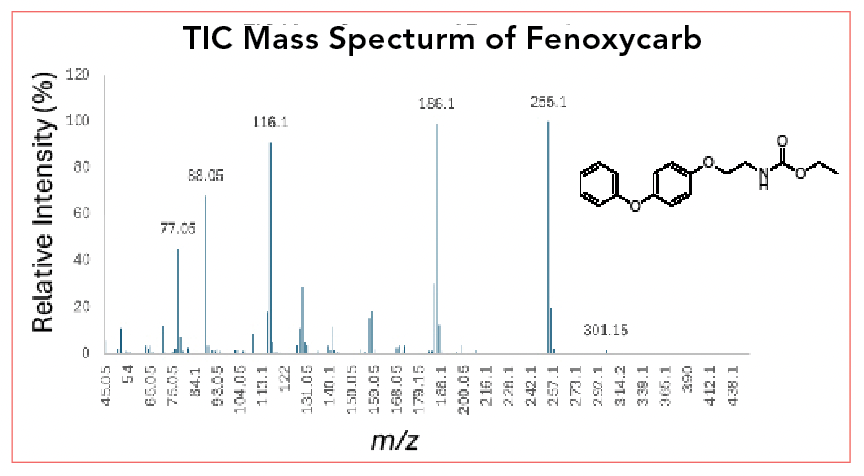
In a mass spectrum, the peak, usually at the highest mass, representing the +1 ion of the whole molecule, is called the molecular ion peak. For fenoxycarb, which has a molar mass of 301.13 Da, the molecular ion peak is seen at m/z 301.15. Note that slight variations in the determined mass are expected. The tallest peak in the spectrum, in this case normalized to a height of 100%, is called the base peak, and is seen at m/z 255.1.
Besides the molecular ion, the lower mass peaks in the spectrum represent smaller ionized fragments remaining after the loss of a neutral fragment. While we will not cover spectral interpretation here, one advantage of classical electron ionization mass spectrometry is that the spectra obtained follow classical fragmentation patterns that have been known for many decades. The spectral interpretation guidelines provided in McLafferty’s famous text that dates to the 1960s still apply (3).
Note that each major peak also appears to include a cluster of smaller peaks at slightly higher masses, usually M+1 and M+2. These peaks result from naturally occurring isotopes of each element, and can be used in most cases to determine the number of atoms of that element in the full structure. This is an important tool in spectral interpretation. Fenoxycarb is also somewhat unusual in that it has an odd-mass molecular ion. Organic compounds made from carbon, oxygen, and hydrogen nearly always have a total molar mass that is even, as they almost always have an even number of protons. The inclusion of nitrogen, which can bind one fewer proton than carbon, then allows for an odd number of protons and an odd molar mass. This is the famous “nitrogen” rule, which indicates that an odd molar mass also means an odd number of nitrogen atoms in the structure.
A TIC is one of the most powerful tools for qualitative analysis available in all analytical chemistry. To determine the structure of an analyte, the mass spectra obtained from the TIC can be interpreted using the classical, well-known techniques described in the McLafferty text, or an automated search can be performed in which the obtained spectrum is compared to a spectral library. The retention time of the analyte provides a second means of identification. It is reasonable to expect that a compound is positively determined if its identity by retention time matching, spectral interpretation and by spectral library searching is confirmed by all three methods.
The TIC can also be used for quantitative analysis. For rough estimations, the peak areas obtained from a peak area report, based on the TIC can be used. However, there is an additional analysis that can be done that starts to illustrate the selective capabilities of GC–MS. Figure 3 shows overlaid extracted ion chromatograms of the fenoxycarb peak. Once we know the mass spectrum of a target analyte, we can choose 3-4 prominent ions and generate individual chromatograms for each. These are termed extracted ion chromatograms (EICs); we are extracting chromatograms for individual ions from the TIC. The four masses chosen for extraction were m/z 77, 116, 186, and 255. Note that the molecular ion mass, which had a very small peak is not chosen. Usually, the most prominent mass peaks are chosen, including the base peak and 2-3 additional large peaks.

FIGURE 3: Extracted ion chromatograms of fenoxycarb showing overlay of EICs for m/z 77, 116, 186, and 255.
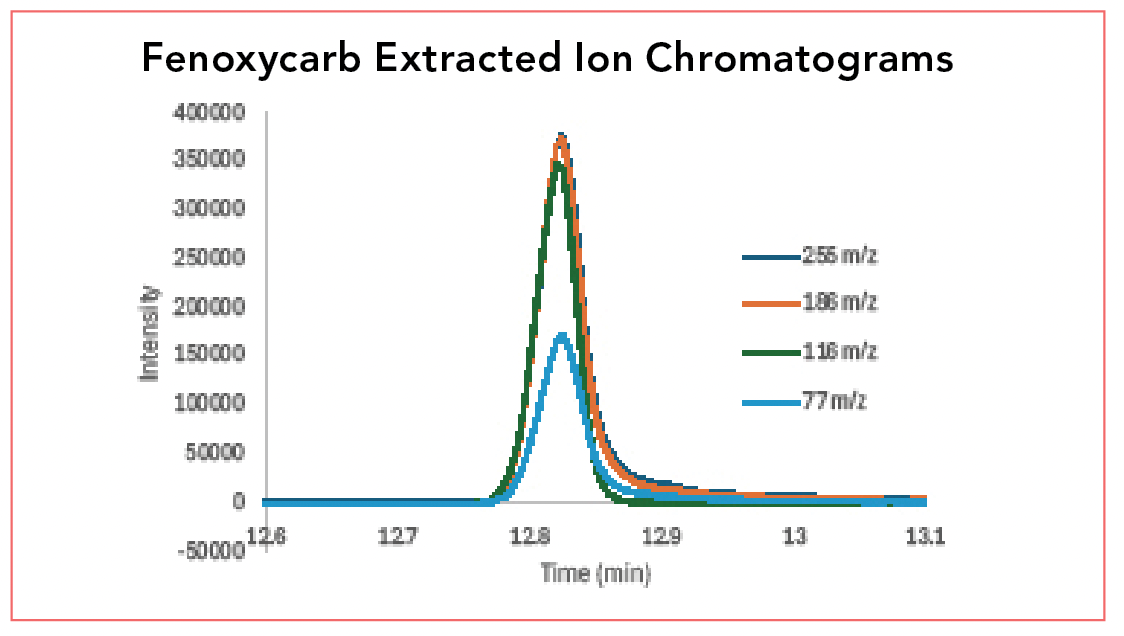
For quantitative analysis, each of these peaks has its own peak height and peak area. Typically, one of the peaks, often the base peak, is chosen for quantitation, and the others are used for confirmation. If one of the mass peaks is missing, then the compound is not the analyte of interact and is not quantitated.
Using both the TIC and EICs provides a quick and straightforward means for performing both qualitative and quantitative analysis in a single run. However, this analysis still suffers from the combined blessing and curse described earlier: Everything that reaches the detector is analyzed, even if you are only interested in a few targeted compounds, and the resulting instrumental noise related to collecting so many signals is additive (TICs are often noisy, limiting sensitivity).
Once the target analytes are known and their mass spectra determined, a separate experiment, selected ion monitoring (SIM), can significantly increase the sensitivity of the analysis by reducing the noise. SIM is a separate experiment from full scan and from obtaining a TIC; many users confuse SIM with EIC, there are separate experiments.
Figure 4 shows overlaid SIM chromatograms of fenoxycarb, using m/z 116, 186, and 255. In this experiment, through the data system, the mass spectrometer is instructed to only detect the chosen ions; the others are not passed through the quadrupole to the detector. This has three impacts. First, the universal detector is now a selective detector, one of the most selective detectors available. Using these three ions for detection, combined with the known retention time, effectively makes the instrument a highly selective fenoxycarb detector. With modern control systems, separate sets of ions can be programmed for each analyte at each retention time. Second, by only observing a few masses, instead of a wide range of masses, instrumental noise is significantly reduced, since the wide range of masses, each of which generates noise, is no longer detected. Finally, only observing a few masses allows a faster data acquisition rate, meaning more data points defining each peak and more reproducible peaks.

FIGURE 4: Selected ion monitoring (SIM) overlaid chromatograms of fenoxycarb using m/z 116, 186 and 255.
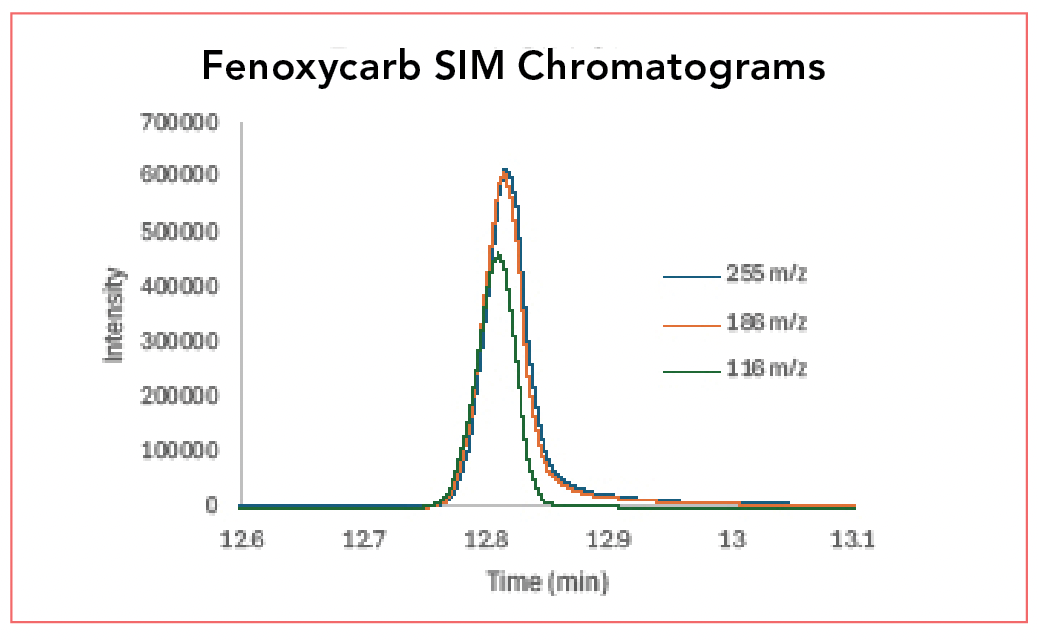
Some of these features are seen in a close examination of Figure 4 and comparison to Figure 3. In Figure 4, the curve, especially near the peak maximum, appears smoother than in Figure 3. This is a direct result of the more rapid data point acquisition. If the baselines of Figures 3 and 4 were magnified, Figure 3 would likely show a both more elevated and noisier baseline. Compared with TIC and EIC, SIM provides much more sensitive quantitative analysis through an increased signal-to-noise (S/N) ratio; the signal is not significantly increased (no more mass of analyte is reaching the detector) but the noise is significantly decreased.
Summary
In this installment, we have reviewed the fundamentals and terminology involved with data analysis in GC–MS. The three modes of GC–MS analysis are:
Total ion chromatogram (TIC): The chromatogram obtained by continuously scanning mass spectra throughout a run.
Extracted ion chromatogram (EIC): The chromatogram(s) obtained by selecting one or more masses from the TIC, using the TIC data.
Selected ion monitoring (SIM): A separate quantitative experiment in which the instrument is set to analyze only a few masses; all others are ignored.
Users are cautioned not to confuse EIC and SIM; they are separate experiments. Some additional terms include:
Mass spectrum: A plot of intensity versus m/z ratio.
Molecular ion peak: The highest mass peak in the mass spectrum, representing the molar mass of the analyte.
Base peak: The highest intensity peak in the mass spectrum, usually not the same m/z as the molecular ion.
GC–MS is among the most powerful and versatile methods in all analytical chemistry. It is among the few that are both universal, selective, qualitative, quantitative, and highly sensitive, all in a single instrument. While modern systems are simple to operate, there is much chemistry, theory, and terminology behind a successful analysis.
References
(1) Snow, N. H. Stopping GC and GC–MS Problems Before They Start. LCGC North Am. 2019, 37 (1), 18–23.
(2) Snow, N. H. Flying High with Sensitivity and Selectivity: GC–MS to GC–MS/MS. LCGC North Am.2021,39 (2), 61–67.
(3) McLafferty, F. W.; Turecek, F. Interpretation of Mass Spectra; University Science Books, 1993.
About the Authors

James Mizvesky is a Ph.D. candidate in the Department of Chemistry and Biochemistry at Seton Hall University. He has research interests in separation science with a focus in limits of detection theory, green analytical chemistry, and fundamentals of gas chromatography. He holds an M.S. in chemistry and a B.S. in biology from Fairleigh Dickinson University, Florham Park, NJ.


Nicholas H. Snow is the Thomas and Sylvia Tencza Professor and Chair in the Department of Chemistry and Biochemistry at Seton Hall University, and an adjunct professor of medical science. During his 30 years as a chromatographer, he has published more than 70 refereed articles and book chapters and has given more than 200 presentations and short courses. He is interested in the fundamentals and applications of separation science, especially gas chromatography, sampling, and sample preparation for chemical analysis. His research group is very active, with ongoing projects using GC, GC–MS, two-dimensional GC, and extraction methods including headspace, liquid–liquid extraction, and solid-phase microextraction.


How Many Repetitions Do I Need? Caught Between Sound Statistics and Chromatographic Practice
April 7th 2025In chromatographic analysis, the number of repeated measurements is often limited due to time, cost, and sample availability constraints. It is therefore not uncommon for chromatographers to do a single measurement.


Rethinking Chromatography Workflows with AI and Machine Learning
April 1st 2025Interest in applying artificial intelligence (AI) and machine learning (ML) to chromatography is greater than ever. In this article, we discuss data-related barriers to accomplishing this goal and how rethinking chromatography data systems can overcome them.

Quantifying Microplastics in Meconium Samples Using Pyrolysis–GC-MS
March 26th 2025Using pyrolysis-gas chromatography and mass spectrometry, scientists from Fudan University and the Putuo District Center for Disease Control and Prevention detected and quantified microplastics in newborn stool samples.

The Role of SPME Combined with GC–MS for PFAS Analysis
Published: March 25th 2025 | Updated: March 25th 2025Emanuela Gionfriddo and Madison Williams from University at Buffalo, the State University of New York, NY, USA discuss the important role that solid-phase microextraction (SPME) techniques with gas chromatography mass spectrometry (GC–MS) can play in the analysis of per- and polyfluoroalkyl substances (PFAS).


