Finding a Needle in a Haystack
LCGC Europe
This month's "GC Connections" examines the various ways - and their attendant benefits and drawbacks - that chromatographers and chromatography data-handling systems locate and measure peaks.
This month's "GC Connections" examines the various ways — and their attendant benefits and drawbacks — that chromatographers and chromatography data-handling systems locate and measure peaks.
Chromatographers go to great lengths to prepare, inject, and separate their samples, but they sometimes do not pay as much attention to the next step: peak detection and measurement. Identification and quantification of peaks can influence the quality of one's results as much as or even more than sample preparation, separation, and detection. Good laboratory quality procedures include consideration of the data-handling aspects of an analysis, and that the associated method development schemes incorporate the variables of data handling. Despite a lot of exposure to computerized data handling, however, many practicing chromatographers do not have a good idea of how a stored chromatogram file — a set of data points arrayed in time — gets translated into a set of peaks with quantitative attributes such as area, height, and amount. This column examines the basics of peak identification and quantification.
Development of Computerized Data Handling
Analysts take computerized chromatographic data handling for granted today, but the sophisticated systems we use now are a relatively recent development. Starting from the first decade of the 20th century, the earliest liquid chromatography (LC) practitioners relied on weighing collected fractions, measuring their spectroscopic absorption bands, or performing additional chemical tests to quantify and identify separated materials. As columns grew smaller and elution volumes shrank, correspondingly higher separation speeds and demand for better sensitivity made fraction collection impractical for analytical purposes. Analysts began to use electronic detectors — fixed-wavelength UV–vis and refractive index (RI) detectors, for example — that produce an evanescent time-based electrical signal that must be recorded.
Similarly, early gas adsorption separations in the 1930s and 1940s made extensive use of the katharometer, a precursor of today's thermal conductivity detector. In many instances, because chart recorders were expensive and hard to obtain, analysts recorded signal amplitudes manually at regular intervals and reconstructed their chromatograms later. With the rapid development of gas chromatography (GC) starting in the 1950s, separations also became too fast to be recorded manually. These accelerations in LC and GC speeds drove corresponding developments of data recording and measurement technology, and high-speed analog chart recorders proliferated in analytical laboratories. With the incorporation of computer control into analytical instrumentation in the 1970s and the subsequent explosion of microprocessors and related large-scale integration chip technologies, chromatographic data handling began undergoing the transformations that have brought it to its present state.
Today, the analog origins of modern digital chromatography data only exist inside the detector instrumentation between active detector elements and integrated analog-to-digital converters. Chart recorders have largely become antiques, and chromatograms are displayed on-screen or printed instead. Electrical wires that carry an analog signal between instrument and data system are nearly obsolete, having been replaced by digital data cables.
Processing Peaks
And yet, despite all the technology advances, chromatograms take nearly the same form today as they did 40 or 50 years ago: a signal dispersed in time and, in the case of multichannel detectors such as mass spectrometric or diode array types, multiple scans captured in sequence. Although they can occur quite rapidly, peaks still exist as deviations from a more or less noisy background, they have definable starting and stopping points, and, of course, chromatographers still need to find and measure them.
"Natural" Peak Detection: When chart recorders were in common use, before the widespread adoption of computerized digital data handling, chromatographers could call on several peak measurement methods. Peak heights could be measured with a ruler and peak areas either with a planimeter, by cutting and weighing the chart paper, or by simple triangulation methods. A planimeter is a mechanical drafting instrument that measures area by circumscribing the peak under manual control. The destructive cut-and-weigh option filled many lab notebooks with neatly sliced peaks and made use of readily available microgram balances. It also fostered a demand for chart papers with well-controlled characteristics. Triangulation, which is less accurate than the first two methods, is a simple on-chart graphical measurement that does not destroy the original record of the chromatogram. Many chart recorders came with a disk integration option that automated area measurement somewhat. Regardless, chromatographers had to define peak start- and stop-points and baselines first to measure their peaks. With computer-controlled data handling, the system makes the decisions, but these critical determinations often go unchallenged and sometimes are never examined at all (at least not until an obvious problem arises).
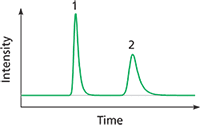
Figure 1: Two peaks with different shapes. Which has the larger area, peak 1 or peak 2?
Seeing is Believing: Every chromatographer possesses an excellent natural system for finding peaks in chromatographic data. The visual cortex excels at perceiving minute trends away from random noise sequences such as those that occur at the boundaries of a peak. It is relatively easy to eyeball peak starting and stopping points manually and to designate a reasonable baseline for chart-recorded or on-screen peaks. When it comes to measuring peak areas, however, even a practiced eye cannot be relied upon. Look at the two peaks in Figure 1. Which has the greater area? The answer is at the end of this article.
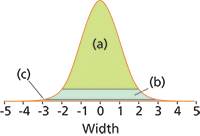
Figure 2: Effect of peak start and stop points. A normal Gaussian peak plotted against the distance from its midpoint in standard deviation (s) units. The labelled shaded sections represent the apparent peak size when the startâstop points are extended to (a) ±2Ï; (b) ±3Ï; and (c) ±4Ï from the centre.
Figure 2 shows an ideal normal Gaussian peak and the effects that selected peak start and stop points at various distances from the peak's centre have on the corresponding measured height and area compared to the actual height and area. Differences of opinion about the starting and stopping points will cause only minor inconsistencies in the ideal peak's apparent area and height as long as the points are far enough part. As illustrated in Figure 3, extending the peak start and stop points beyond about ±3.75σ gives a loss in measured peak height relative to actual peak height of less than 0.1%. For peak area, a start–stop extent of greater than ±4.0σ will give measured areas within 0.1% of the actual peak area.
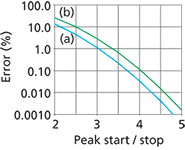
Figure 3: Error in (a) peak height and (b) peak area associated with peak startâstop choices. The lost fraction of measured peak size as a percent of the actual peak height or area is plotted against the integration startâstop extents. The startâstop points are assumed to be symmetrical about the midpoint of an ideal Gaussian peak.
These estimates of peak measurement accuracy are based on purely theoretical considerations of an ideal normal Gaussian peak, which approximates real chromatographic peaks but omits some important additional considerations. Most peaks tail to some degree: they rise more rapidly than they fall, as illustrated by the peak in Figure 4(a). In such cases, the peak stop point should be extended to include the tail. Another significant contributor is noise in the chromatographic signal, which is discussed later in this column. For a more detailed discussion of errors in peak measurement, as well as many more aspects of chromatography data handling and signal processing, see the excellent book by Felinger (1), which influenced some of the ideas in this column instalment.
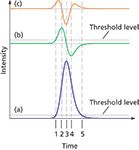
Figure 4: Peak detection by derivatives. Plots: (a) tailing Gaussian peak, (b) first derivative, and (c) second derivative. Points of interest: 1 = peak start, 2 = leading inflection point, 3 = peak apex, 4 = trailing inflection point, 5 = peak end.
Computer Vision
To a chromatographer's eye, peak starts and stops are usually easy to spot. But how are data-handling systems programmed to "see" what is so obvious to the operator? Most data-handling systems rely on computing some peak-shape metrics as the data is scanned. Peak start, apex, and end points are triggered as these metrics pass through various values or thresholds.
Figure 4 illustrates this process using the chromatographic signal and its derivatives. The original chromatogram is shown in Figure 4(a), the first derivative — the rate of change or slope of the chromatogram — is shown in Figure 4(b), and the second derivative — the rate of change of the first derivative — is shown in Figure 4(c). Various individual commercial chromatographic data-handling systems use many types of peak detection algorithms, but in general, the computer system is programmed to trigger the start of a peak when the original signal or the first derivative exceeds a threshold level. For a single stand-alone peak, the second derivative will pass through zero at the peak's inflection points and the first derivative will pass through zero at the peak apex. Finally, the signal itself and the derivatives all settle down below the threshold level and the peak end is declared. There are many variations on this scheme. A different threshold can be used for determining the ending point, or the peak start point can be qualified by requiring a peak to exceed a minimum area before it is declared. Also, using the set of peak start and stop points at the peak thresholds as measurement bounds can cause peak areas and heights to be underestimated, so many systems will expand the start and stop points appropriately after a peak is confirmed. In any case, operator training on the specific data-handling flavour in use is indispensable for those who must interact with chromatography systems on a regular basis.
Fusion: As long as subsequent peaks are separated with a resolution (RS) of greater than about 3.0, each peak can be treated separately. The situation becomes more complex when two peaks are not as well separated. Figures 5 and 6 show what happens when peak resolution drops below 2.0. In Figure 5(a), the two peaks are merged. They have a resolution of less than 1.0, but a discernable minimum, or valley, point exists between them. The second derivative in Figure 5(b) passes through zero after the valley point. In Figure 6(a), the peaks are almost completely merged and there is no discernable valley point. Yet, the second derivative in Figure 6 still goes through the same ups and downs. It just doesn't cross through zero at the junction of the peaks. The presence of two fused peaks is confirmed if the second derivative crosses through zero five times. If the two peaks merge completely, the situation reverts to that shown in Figure 4 for a single peak.
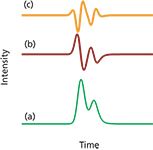
Figure 5: Partially fused peaks. Shown are (a) the original chromatogram, (b) the first derivative, and (c) the second derivative. The peaks are the same as in Figure 4.
Measuring fused peak sizes is difficult and fraught with potential errors. For the partially fused peaks in Figure 5, peak integration on either side of a simple vertical line at the valley point between the peaks gives a fairly good area estimate of whether the peaks are of similar size. As the disparity between peaks increases and as their separation decreases, the error in the areas from using a simple vertical line becomes large. Another approach involves skimming off the smaller peak from the larger with a tangent or curve that estimates the division between them, as shown in Figure 6(a). Most data systems use a combination of these and other baseline reconstruction techniques that depend on the relative sizes of the peaks involved, both heights and widths, and on their degree of separation.
A third approach to measuring fused peaks uses mathematical techniques to reconstruct the individual peaks from their merged chromatographic signal. Such methods make some assumptions about the original peak shapes. Chromatographers have used iterative curve fitting, deconvolution, and other techniques to pull apart poorly resolved peaks, but such methods are appropriate only when the separation process itself cannot be adjusted to resolve the peaks in the first place. Many chromatographers probably rely too strongly on their computerized data-handling systems to resolve separation problems instead of attacking the fundamental separation itself.
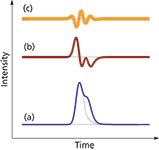
Figure 6: Fused peaks. There is no valley between the peaks. Same as Figure 5, except that the second peak has half the area of the first and has been moved slightly closer to it. The second derivative (b) no longer crosses zero between the peaks.
Tuning Out the Noise
Noise accompanies every chromatogram. Small amounts of noise with root mean square (rms) magnitudes of less than about 1% of the peak height are not of great concern. Noise increasingly influences peaks as they become smaller, however, and peaks with less than four times the rms noise level are considered by most chromatographers to lie under a minimum detectable quantity level. Even though such peaks can be discerned by the practiced eye, the run-to-run deviations associated with quantifying them make it difficult to assign meaningful values. Figure 7(b) shows a single peak with about 30 µV rms of added noise, which puts it at around two times the minimum detectable quantity level, or eight times the rms noise level. The noise includes both some lower frequency components typical of detector drift as well as higher frequency components that would originate in the electronics and data-conversion steps.
All chromatography recording systems use some type of noise filtering, located in the detector electronics if not in other places, as well. A mechanical chart recorder's response naturally falls off at higher frequencies, and analog-to-digital converters usually have programmable filtration through signal averaging and sometimes more sophisticated digital signal processing techniques. In addition to this kind of front-end signal filtration, many chromatography data-handling systems incorporate some additional filtration and signal processing that can be applied to the chromatography data after it is acquired. One of the most popular signal filtering methods in analytical chemical applications is the Savitsky–Golay filter (2,3), which fits a third-order or higher polynomial to a moving sample window on either side and through each data point. A good discussion of this filter appeared in Spectroscopy (4). The trace in Figure 7(c) shows the result of applying a fourth-order Savitsky–Golay filter with a 15-point window. Many other filtering methods also can be applied by chromatography data-handling software.
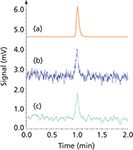
Figure 7: Effect of noise and filtration on peak appearance. (a) Tailing Gaussian peak; wh = 3.5 s, asymmetry = 1.5, tR = 1.0 min, area = 1000 µV-s. (b) The same peak with ~30 µV rms added noise. (c) The same signal from (b) after filtration with a fourth-order Savitsky-Golay filter (m = 15), which reduced the high-frequency noise considerably and the overall noise level by about two times to ~15 µV rms.
Noise adds ambiguity to peak measurements. The degree of influence depends on the distribution and type of noise, but in general, for a peak near the minimum detectable quantity level, noise will contribute up to 25% or more uncertainty in peak height and area. For example, if a particular component peak has a minimum detectable quantity level of 1 ppm under specific sample preparation and separation conditions, the uncertainty in the determination from peak height measurements would lie close to ±0.25 ppm or 25% at the 1 ppm level. At 100 ppm, however, the same uncertainty amounts to only 0.25%. Area measurements tend to show more uncertainty than corresponding peak height measurements.
I ran a quick check on this idea by running five simulations, each comprising 10 randomized computer-generated chromatograms with various peak sizes and processing conditions. Granted, these dry experiments do not model a real chromatograph in every respect, but they do completely detach the peaks from any sample preparation, injection, or separation influences. As such, these simulations serve the purposes of this discussion. The first two series were performed with a peak at about 1.1 times the minimum detectable quantity level, the second two with a peak that had 100 times more area, and the fifth set with a peak 10 times larger again. Table 1 summarizes the results both before and after signal filtration.
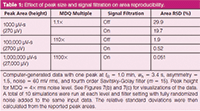
Table 1: Effect of peak size and signal filtration on area reproducibility.
Looking only at the unfiltered data first, the uncertainties expressed as percent standard deviation relative to the average area or height values (%RSD) for 10 simulations do indeed follow the expected trends. The uncertainties fall off rapidly as the peak size increases. Applying a filter to the chromatogram before detecting and measuring the peaks has a more noticeable effect when the noise is large in relation to the peaks, as might be expected.
Noise also affects the ability of the data-handling system to find peaks and to properly determine the boundaries of merged peaks. In the case of the partially merged peaks in Figure 5, for example, the minimum detectable quantity amounts probably should be increased by a factor of two or more over the minimum detectable quantity levels of the peaks taken individually.
Answer to the Natural Peak Integration Problem in Figure 1: They both have the same area. Most people will choose the broader peak because the eye tends to emphasize width and not height.
Conclusion
As analytical scientists, chromatographers should learn not to trust the pronouncements of their computerized data-handling systems without first carefully examining the basis for detection and measurement of each peak in their chromatograms. As with all computerized systems, inappropriate setup and use will produce useless or even misleading results. Controlled method development and validation, regular quality checks, and appropriate operator training are all essential to obtaining the best possible results.
John V. Hinshaw is a senior scientist at Serveron Corporation in Beaverton, Oregon, USA, and is a member of the LCGC Europe editorial advisory board. Direct correspondence about this column should be addressed to "GC Connections", LCGC Europe, Honeycomb West, Chester Business Park, Chester, CH4 9QH, UK, or e-mail the editor-in-chief, Alasdair Matheson, at amatheson@advanstar.com
References
(1) A. Felinger, Data Analysis and Signal Processing in Chromatography (Elsevier, New York, USA, 1998).
(2) A. Savitzky and M. Golay, Anal. Chem. 36(8), 1627–1639 (1964).
(3) J. Steinier, Y. Termonia, and J. Deltour, Anal. Chem. 44(11), 1906–1909 (1971).
(4) H. Mark and J. Workman, Spectroscopy 18(12), 106–111 (2003).

New Study Reviews Chromatography Methods for Flavonoid Analysis
April 21st 2025Flavonoids are widely used metabolites that carry out various functions in different industries, such as food and cosmetics. Detecting, separating, and quantifying them in fruit species can be a complicated process.
Quantifying Terpenes in Hydrodistilled Cannabis sativa Essential Oil with GC-MS
April 21st 2025A recent study conducted at the University of Georgia, (Athens, Georgia) presented a validated method for quantifying 18 terpenes in Cannabis sativa essential oil, extracted via hydrodistillation. The method, utilizing gas chromatography–mass spectrometry (GC–MS) with selected ion monitoring (SIM), includes using internal standards (n-tridecane and octadecane) for accurate analysis, with key validation parameters—such as specificity, accuracy, precision, and detection limits—thoroughly assessed. LCGC International spoke to Noelle Joy of the University of Georgia, corresponding author of this paper discussing the method, about its creation and benefits it offers the analytical community.


